Estimated zip code population in 2022: 11,058 Zip code population in 2010: 10,917 Zip code population in 2000: 10,545
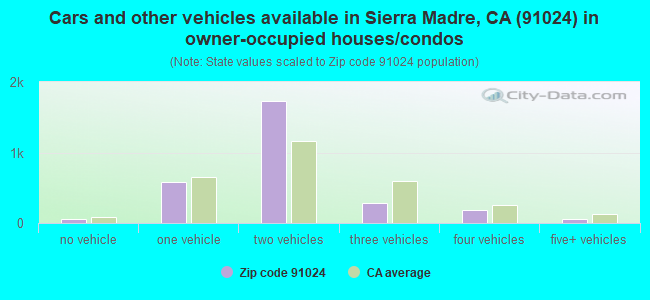
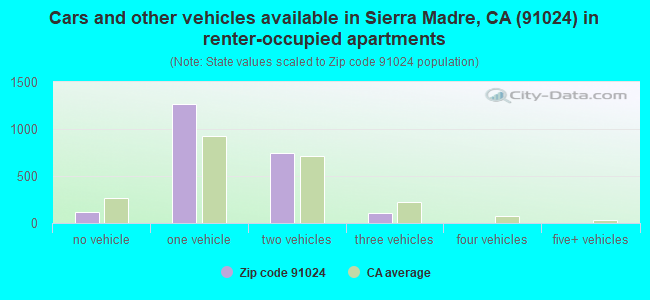
Houses and condos: 5,667 Renter-occupied apartments: 2,224
% of renters here:
44%
State:
44%
March 2022 cost of living index in zip code 91024: 136.8 (high, U.S. average is 100)
Land area: 3.0 sq. mi. Water area: 0.0 sq. mi.
Population density: 3,745 people per square mile
(average).
OSM Map
General Map
Google Map
MSN Map
OSM Map
General Map
Google Map
MSN Map
OSM Map
General Map
Google Map
MSN Map
OSM Map
General Map
Google Map
MSN Map
Please wait while loading the map...
Real estate property taxes paid for housing units in 2022:
This zip code:
0.7% ($8,265)
California:
0.7% ($4,831)
Median real estate property taxes paid for housing units with mortgages in 2022: $9,214 (0.7%) Median real estate property taxes paid for housing units with no mortgage in 2022: $6,727 (0.6%)
Estimated median house/condo value in 2022: $1,239,170
91024:
$1,239,170
California:
$715,900
According to our research of California and other state lists, there were 3 registered sex offenders living in 91024 zip code as of June 16, 2024. The ratio of all residents to sex offenders in zip code 91024 is 3,742 to 1. The ratio of registered sex offenders to all residents in this zip code is much lower than the state average.
Median resident age:
This zip code:
47.3 years
California median age:
37.9 years
Average household size:
This zip code:
2.2 people
California:
2.8 people
Averages for the 2020 tax year for zip code 91024, filed in 2021:
Average Adjusted Gross Income (AGI) in 2020: $153,248 (Individual Income Tax Returns)
Here:
$153,248
State:
$95,910
Salary/wage: $116,187 (reported on 73.3% of returns)
Here:
$116,187
State:
$77,331
(% of AGI for various income ranges: 1150.4% for AGIs below $25k, 4081.9% for AGIs $25k-50k, 7064.2% for AGIs $50k-75k, 10851.7% for AGIs $75k-100k, 20092.2% for AGIs $100k-200k, 99737.5% for AGIs over 200k)
Taxable interest for individuals: $2,327 (reported on 54.4% of returns)
This zip code:
$2,327
California:
$2,294
(% of AGI for various income ranges: 55.1% for AGIs below $25k, 108.6% for AGIs $25k-50k, 87.4% for AGIs $50k-75k, 174.7% for AGIs $75k-100k, 369.7% for AGIs $100k-200k, 1177.9% for AGIs over 200k)
Ordinary dividends: $9,493 (reported on 39.2% of returns)
Here:
$9,493
State:
$10,949
(% of AGI for various income ranges: 108.1% for AGIs below $25k, 204.8% for AGIs $25k-50k, 266.1% for AGIs $50k-75k, 477.0% for AGIs $75k-100k, 712.0% for AGIs $100k-200k, 4584.6% for AGIs over 200k)
Net capital gain/loss in AGI: +$36,362 (reported on 37.5% of returns)
Here:
+$36,362
State:
+$49,306
(% of AGI for various income ranges: 48.1% for AGIs below $25k, 328.6% for AGIs $25k-50k, 245.0% for AGIs $50k-75k, 432.7% for AGIs $75k-100k, 1094.6% for AGIs $100k-200k, 23819.3% for AGIs over 200k)
Profit/loss from business: +$23,644 (reported on 24.0% of returns)
Here:
+$23,644
State:
+$15,671
(% of AGI for various income ranges: 251.2% for AGIs below $25k, 554.0% for AGIs $25k-50k, 577.9% for AGIs $50k-75k, 443.7% for AGIs $75k-100k, 1285.1% for AGIs $100k-200k, 6075.7% for AGIs over 200k)
Taxable individual retirement arrangement distribution: $27,468 (reported on 13.3% of returns)
91024:
$27,468
California:
$23,505
(% of AGI for various income ranges: 79.0% for AGIs below $25k, 323.3% for AGIs $25k-50k, 372.9% for AGIs $50k-75k, 544.3% for AGIs $75k-100k, 1336.3% for AGIs $100k-200k, 2775.7% for AGIs over 200k)
Self-employed (Keogh) retirement plans: $27,023 (reported on 2.3% of returns)
91024:
$27,023
California:
$30,163
(% of AGI for various income ranges: 137.8% for AGIs $100k-200k, 964.3% for AGIs over 200k)
Total itemized deductions: $37,907 (reported on 27.2% of returns)
Here:
$37,907
State:
$39,517
(% of AGI for various income ranges: 243.1% for AGIs below $25k, 576.7% for AGIs $25k-50k, 744.7% for AGIs $50k-75k, 1393.3% for AGIs $75k-100k, 2781.7% for AGIs $100k-200k, 11028.6% for AGIs over 200k)
Charity contributions: $8,776 (reported on 23.9% of returns)
Here:
$8,776
State:
$12,598
(% of AGI for various income ranges: 10.6% for AGIs below $25k, 55.7% for AGIs $25k-50k, 80.0% for AGIs $50k-75k, 143.0% for AGIs $75k-100k, 413.2% for AGIs $100k-200k, 2989.6% for AGIs over 200k)
Taxes paid: $9,206 (reported on 27.2% of returns)
91024:
$9,206
State:
$8,807
(% of AGI for various income ranges: 52.5% for AGIs below $25k, 122.6% for AGIs $25k-50k, 164.5% for AGIs $50k-75k, 351.7% for AGIs $75k-100k, 824.7% for AGIs $100k-200k, 2414.3% for AGIs over 200k)
Earned income credit: $1,297 (reported on 6.2% of returns)
Here:
$1,297
State:
$2,074
(% of AGI for various income ranges: 42.1% for AGIs below $25k, 40.0% for AGIs $25k-50k)
Percentage of individuals using paid preparers for their 2020 taxes: 91.3%
Here:
91%
State:
92%
(% for various income ranges: 88.4% for AGIs below $25k, 90.0% for AGIs $25k-50k, 92.4% for AGIs $50k-75k, 89.7% for AGIs $75k-100k, 93.8% for AGIs $100k-200k, 93.3% for AGIs over 200k)
Averages for the 2012 tax year for zip code 91024, filed in 2013:
Average Adjusted Gross Income (AGI) in 2012: $112,888 (Individual Income Tax Returns)
Here:
$112,888
State:
$72,726
Salary/wage: $94,400 (reported on 75.0% of returns)
Here:
$94,400
State:
$59,079
(% of AGI for various income ranges: 62.0% for AGIs below $25k, 67.3% for AGIs $25k-50k, 69.5% for AGIs $50k-75k, 67.2% for AGIs $75k-100k, 69.1% for AGIs $100k-200k, 57.5% for AGIs over 200k)
Taxable interest for individuals: $1,857 (reported on 54.2% of returns)
This zip code:
$1,857
California:
$2,146
(% of AGI for various income ranges: 3.2% for AGIs below $25k, 1.0% for AGIs $25k-50k, 0.9% for AGIs $50k-75k, 1.3% for AGIs $75k-100k, 0.9% for AGIs $100k-200k, 0.7% for AGIs over 200k)
Ordinary dividends: $8,556 (reported on 36.2% of returns)
Here:
$8,556
State:
$9,308
(% of AGI for various income ranges: 4.5% for AGIs below $25k, 2.4% for AGIs $25k-50k, 2.1% for AGIs $50k-75k, 2.5% for AGIs $75k-100k, 2.3% for AGIs $100k-200k, 3.0% for AGIs over 200k)
Net capital gain/loss in AGI: +$17,640 (reported on 32.0% of returns)
Here:
+$17,640
State:
+$30,460
(% of AGI for various income ranges: 0.8% for AGIs $25k-50k, 1.0% for AGIs $50k-75k, 1.1% for AGIs $75k-100k, 1.3% for AGIs $100k-200k, 8.7% for AGIs over 200k)
Profit/loss from business: +$19,363 (reported on 24.8% of returns)
Here:
+$19,363
State:
+$17,064
(% of AGI for various income ranges: 17.0% for AGIs below $25k, 8.7% for AGIs $25k-50k, 5.6% for AGIs $50k-75k, 3.8% for AGIs $75k-100k, 5.0% for AGIs $100k-200k, 2.6% for AGIs over 200k)
Taxable individual retirement arrangement distribution: $23,368 (reported on 13.5% of returns)
91024:
$23,368
California:
$19,557
(% of AGI for various income ranges: 6.2% for AGIs below $25k, 3.8% for AGIs $25k-50k, 2.9% for AGIs $50k-75k, 3.3% for AGIs $75k-100k, 3.7% for AGIs $100k-200k, 2.0% for AGIs over 200k)
Self-employment retirement plans: $21,492 (reported on 2.4% of returns)
91024:
$21,492
California:
$24,530
(% of AGI for various income ranges: 0.9% for AGIs $25k-50k, 0.3% for AGIs $100k-200k, 0.7% for AGIs over 200k)
Total itemized deductions: $41,479 (23% of AGI, reported on 52.7% of returns)
Here:
$41,479
State:
$34,004
Here:
22.8% of AGI
State:
22.7% of AGI
(% of AGI for various income ranges: 25.9% for AGIs below $25k, 19.3% for AGIs $25k-50k, 15.8% for AGIs $50k-75k, 21.5% for AGIs $75k-100k, 21.5% for AGIs $100k-200k, 18.2% for AGIs over 200k)
Charity contributions: $4,595 (reported on 47.3% of returns)
Here:
$4,595
State:
$4,659
(% of AGI for various income ranges: 1.4% for AGIs below $25k, 1.5% for AGIs $25k-50k, 1.4% for AGIs $50k-75k, 2.1% for AGIs $75k-100k, 2.3% for AGIs $100k-200k, 1.9% for AGIs over 200k)
Taxes paid: $18,370 (reported on 52.7% of returns)
91024:
$18,370
State:
$14,448
(% of AGI for various income ranges: 4.6% for AGIs below $25k, 4.5% for AGIs $25k-50k, 4.5% for AGIs $50k-75k, 6.9% for AGIs $75k-100k, 8.8% for AGIs $100k-200k, 10.0% for AGIs over 200k)
Earned income credit: $1,573 (reported on 8.3% of returns)
Here:
$1,573
State:
$2,286
(% of AGI for various income ranges: 3.4% for AGIs below $25k, 0.4% for AGIs $25k-50k)
Percentage of individuals using paid preparers for their 2012 taxes: 64.1%
Here:
64%
State:
64%
(% for various income ranges: 55.5% for AGIs below $25k, 62.5% for AGIs $25k-50k, 62.7% for AGIs $50k-75k, 66.7% for AGIs $75k-100k, 69.4% for AGIs $100k-200k, 76.1% for AGIs over 200k)
Averages for the 2004 tax year for zip code 91024, filed in 2005:
Average Adjusted Gross Income (AGI) in 2004: $82,806 (Individual Income Tax Returns)
Here:
$82,806
State:
$58,600
Salary/wage: $74,993 (reported on 75.5% of returns)
Here:
$74,993
State:
$49,455
(% of AGI for various income ranges: 208.6% for AGIs below $10k, 59.5% for AGIs $10k-25k, 69.1% for AGIs $25k-50k, 73.4% for AGIs $50k-75k, 71.5% for AGIs $75k-100k, 66.6% for AGIs over 100k)
Taxable interest for individuals: $2,374 (reported on 64.0% of returns)
This zip code:
$2,374
California:
$2,365
(% of AGI for various income ranges: 23.3% for AGIs below $10k, 4.3% for AGIs $10k-25k, 2.9% for AGIs $25k-50k, 1.9% for AGIs $50k-75k, 2.0% for AGIs $75k-100k, 1.4% for AGIs over 100k)
Taxable dividends: $4,401 (reported on 41.0% of returns)
Here:
$4,401
State:
$4,746
(% of AGI for various income ranges: 21.1% for AGIs below $10k, 4.4% for AGIs $10k-25k, 1.9% for AGIs $25k-50k, 1.9% for AGIs $50k-75k, 1.6% for AGIs $75k-100k, 2.2% for AGIs over 100k)
Net capital gain/loss: +$11,783 (reported on 36.2% of returns)
Here:
+$11,783
State:
+$23,418
(% of AGI for various income ranges: -12.4% for AGIs below $10k, -0.2% for AGIs $10k-25k, 0.5% for AGIs $25k-50k, 1.0% for AGIs $50k-75k, 1.8% for AGIs $75k-100k, 7.4% for AGIs over 100k)
Profit/loss from business: +$19,406 (reported on 23.7% of returns)
Here:
+$19,406
State:
+$16,826
(% of AGI for various income ranges: 12.6% for AGIs below $10k, 9.8% for AGIs $10k-25k, 8.9% for AGIs $25k-50k, 5.6% for AGIs $50k-75k, 4.9% for AGIs $75k-100k, 5.0% for AGIs over 100k)
IRA payment deduction: $3,247 (reported on 3.7% of returns)
91024:
$3,247
California:
$3,192
(% of AGI for various income ranges: 0.4% for AGIs $10k-25k, 0.4% for AGIs $25k-50k, 0.2% for AGIs $50k-75k, 0.2% for AGIs $75k-100k, 0.1% for AGIs over 100k)
Self-employed pension: $16,548 (reported on 3.2% of returns)
Here:
$16,548
California:
$17,688
(% of AGI for various income ranges: 0.3% for AGIs $25k-50k, 0.4% for AGIs $50k-75k, 0.3% for AGIs $75k-100k, 0.8% for AGIs over 100k)
Total itemized deductions: $30,726 (24% of AGI, reported on 53.1% of returns)
Here:
$30,726
State:
$28,113
Here:
23.6% of AGI
State:
25.3% of AGI
(% of AGI for various income ranges: 82.0% for AGIs below $10k, 22.9% for AGIs $10k-25k, 17.6% for AGIs $25k-50k, 19.1% for AGIs $50k-75k, 23.0% for AGIs $75k-100k, 19.1% for AGIs over 100k)
Charity contributions deductions: $4,525 (3% of AGI, reported on 49.5% of returns)
Here:
$4,525
State:
$3,923
Here:
3.4% of AGI
State:
3.3% of AGI
(% of AGI for various income ranges: 4.6% for AGIs below $10k, 2.3% for AGIs $10k-25k, 2.0% for AGIs $25k-50k, 2.4% for AGIs $50k-75k, 3.1% for AGIs $75k-100k, 2.8% for AGIs over 100k)
Total tax: $15,546 (reported on 85.8% of returns)
91024:
$15,546
State:
$10,761
(% of AGI for various income ranges: 11.4% for AGIs below $10k, 5.6% for AGIs $10k-25k, 9.1% for AGIs $25k-50k, 11.1% for AGIs $50k-75k, 11.2% for AGIs $75k-100k, 19.3% for AGIs over 100k)
Earned income credit: $1,053 (reported on 5.4% of returns)
Here:
$1,053
State:
$1,763
Percentage of individuals using paid preparers for their 2004 taxes: 65.4%
Here:
65%
State:
66%
(% for various income ranges: 57.6% for AGIs below $10k, 62.7% for AGIs $10k-25k, 59.2% for AGIs $25k-50k, 65.7% for AGIs $50k-75k, 72.4% for AGIs $75k-100k, 74.0% for AGIs over 100k)
Likely homosexual households (counted as self-reported same-sex unmarried-partner households)
Lesbian couples: 0.0% of all households
Gay men: 0.5% of all households
Household received Food Stamps/SNAP in the past 12 months: 164 Household did not receive Food Stamps/SNAP in the past 12 months: 4,838
Women who had a birth in the past 12 months: 10 (10 now married, 0 unmarried) Women who did not have a birth in the past 12 months: 2,020 (1,135 now married, 871 unmarried)
Housing units in zip code 91024 with a mortgage: 1,839 (257 second mortgage, 10 home equity loan, 221 both second mortgage and home equity loan) Houses without a mortgage: 18
Median monthly owner costs for units with a mortgage: $3,876 Median monthly owner costs for units without a mortgage: $1,026
Residents with income below the poverty level in 2022:
This zip code:
6.3%
Whole state:
12.2%
Residents with income below 50% of the poverty level in 2022:
This zip code:
1.6%
Whole state:
6.2%
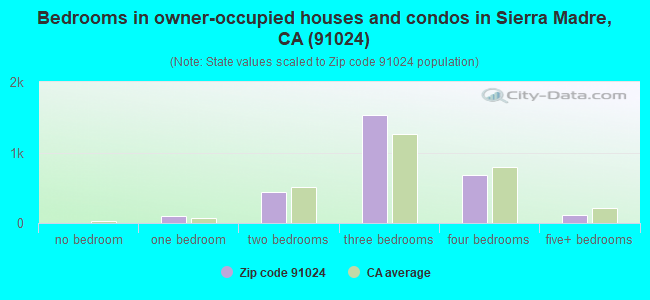
Median number of rooms in houses and condos:
Here:
6.3
State:
6.0
Median number of rooms in apartments:
Here:
4.1
State:
3.9
Notable locations in this zip code not listed on our city pages
Notable locations in zip code 91024: Sierra Madre City Hall (A), Barlow Villa (B), Sierra Madre Public Library (C), Mount Oliva Passionist Fathers Home (D), Sierra Madre Volunteer Fire Department (E). Display/hide their locations on the map
Churches in zip code 91024 include: Bethany Church (A), Church of Christ (B), Episcopal Church of the Ascension (C), Gloria Dei Evangelical Lutheran Church (D), Mater Dolorosa Monastery (E), Old North Church (F), Saint Ritas Catholic Church (G), Sierra Madre Congregational Church (H), Sierra Madre United Methodist Church (I). Display/hide their locations on the map
Parks in zip code 91024 include: Sierra Madre Park (1), Sierra Vista Park (2), Bailey Canyon Park (3), Bailey Canyon Wilderness Park (4), Mount Wilson Trail Park (5). Display/hide their locations on the map
In group quarters: 34 (-1 institutionalized population)
Size of family households: 1,471 2-persons, 744 3-persons, 538 4-persons, 128 5-persons, 13 6-persons, 22 7-or-more-persons
Size of nonfamily households: 1,909 1-person, 292 2-persons, 17 3-persons
1,572 married couples with children.
279 single-parent households (45 men, 234 women).
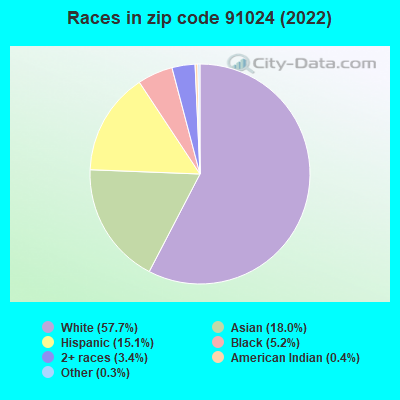
79.6% of residents of 91024 zip code speak English at home.
3.5% of residents speak Spanish at home (90% very well, 5% well, 5% not well).
2.6% of residents speak other Indo-European language at home (93% very well, 7% well).
11.6% of residents speak Asian or Pacific Island language at home (65% very well, 17% well, 18% not well).
2.6% of residents speak other language at home (76% very well, 12% well, 5% not well, 7% not at all).
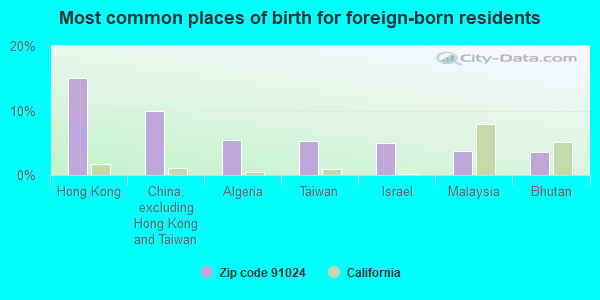
Foreign born population: 2,054 (18.6%) (63.6% of them are naturalized citizens)
This zip code:
18.6%
Whole state:
26.7%
15%Hong Kong
10%China, excluding Hong Kong and Taiwan
5%Algeria
5%Taiwan
5%Israel
4%Malaysia
4%Bhutan
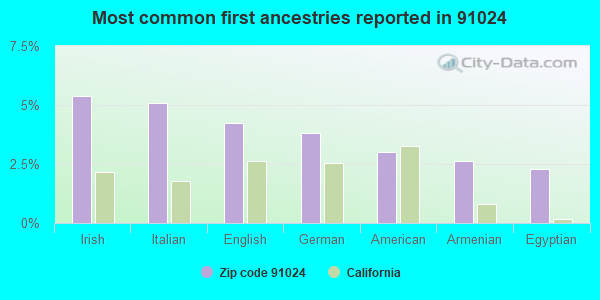
5%Irish
5%Italian
4%English
4%German
3%American
3%Armenian
2%Egyptian
Year of entry for the foreign-born population
7322010 or later
1312000 to 2009
6391990 to 1999
714Before 1990
Facilities with environmental interests located in this zip code:
GERMAN AUTO RPR (54 N BALDWIN in SIERRA MADRE, CA)
Small Quantity Generators, between 100 kg and 1000 kg of hazardous waste/month (Resource Conservation and Recovery Act (tracking hazardous waste)) - notification Organizations: MIKE EING (CONTACT/OWNER)
MARANATHA HIGH (160 N CANON AVE in SIERRA MADRE, CA)
COMPLIANCE ACTIVITY (Tracking inspections of insecticide, fungicide, and rodenticide, and toxic substances) Alternative names: MARANATHA HIGH SCHOOL
Housing units lacking complete plumbing facilities: 1.4% Housing units lacking complete kitchen facilities: 2.3%
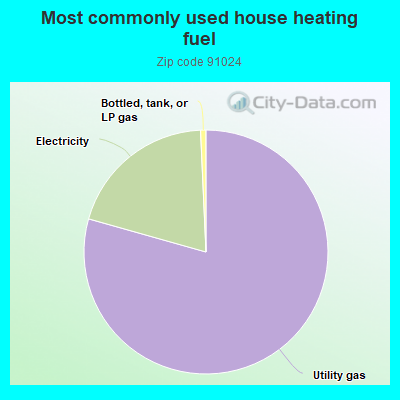
79.3%Utility gas
19.9%Electricity
0.7%Bottled, tank, or LP gas
Population in 1990: 10,560.
Place of birth for U.S.-born residents:
This state: 6,313
Northeast: 712
Midwest: 960
South: 390
West: 455
61% of the 91024 zip code residents lived in the same house 5 years ago. Out of people who lived in different houses, 75% lived in this county. Out of people who lived in different counties, 50% lived in California.
90% of the 91024 zip code residents lived in the same house 1 year ago. Out of people who lived in different houses, 82% moved from this county. Out of people who lived in different houses, 6% moved from different county within same state. Out of people who lived in different houses, 8% moved from different state.
Private vs. public school enrollment:
Students in private schools in grades 1 to 8 (elementary and middle school): 330
Here:
37.0%
California:
10.5%
Students in private schools in grades 9 to 12 (high school): 161
Here:
40.4%
California:
8.5%
Students in private undergraduate colleges: 108
Here:
36.7%
California:
15.9%
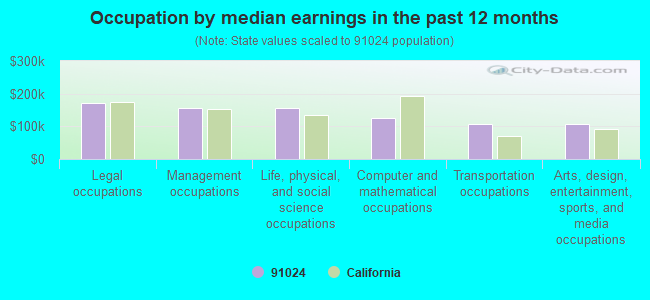
Occupation by median earnings in the past 12 months ($)
172,544Legal occupations
156,872Management occupations
155,752Life, physical, and social science occupations
124,119Computer and mathematical occupations
106,536Transportation occupations
106,094Arts, design, entertainment, sports, and media occupations
Companies with federal contracts located in this zip code:
TRLOKOM (124 VISTA CIRCLE DRIVE in SIERRA MADRE, CA; small business) : $2,740,533 in 11 contractsfrom 2000 to 2003
Contracts for Other Defense -- Applied Research and Exploratory Development (R&D), Other Defense -- Advanced Development (R&D), Other Defense -- Operational Systems Development (R&D), Defense Electronics and Communication Equipment -- Basic Research (R&D) by Army, Air Force Signed by year:2000: $168,828; 2001: $539,390; 2002: $1,460,392; 2003: $571,923; 2004: $0; 2005: $0; 2006: $0.
Biggest contracts:
$389,736 with Army for Other Defense -- Applied Research and Exploratory Development (R&D). Signed on 2001-07-02. Completion date: 2003-10-01.
$375,000 with Air Force for Other Defense -- Advanced Development (R&D). Signed on 2002-05-03. Completion date: 2004-08-01.
$371,923 with Air Force for Other Defense -- Operational Systems Development (R&D). Signed on 2003-01-16. Completion date: 2004-08-01.
$364,205 with Army for Defense Electronics and Communication Equipment -- Basic Research (R&D). Signed on 2002-01-30. Completion date: 2004-01-30.
Top industries in this zip code by the number of employees in 2005:
Other Services (except Public Administration): Religious Organizations (50-99 employees: 1 establishment, 20-49 employees: 2 establishments, 5-9 employees: 3 establishments, 1-4 employees: 3 establishments)
Health Care and Social Assistance: Nursing Care Facilities (50-99: 1)
Educational Services: Elementary and Secondary Schools (20-49: 2)
Accommodation and Food Services: Limited-Service Restaurants (10-19: 4, 1-4: 2)
2005 - 2018 National Fire Incident Reporting System (NFIRS) incidents
Based on the data from the years 2005 - 2018 the average number of fires per year is 15. The highest number of reported fire incidents - 38 took place in 2005, and the least - 1 in 2009. The data has a dropping trend.
When looking into fire subcategories, the most incidents belonged to: Outside Fires (40.0%), and Structure Fires (35.2%).
Fire incident types reported to NFIRS in Zip Code 91024

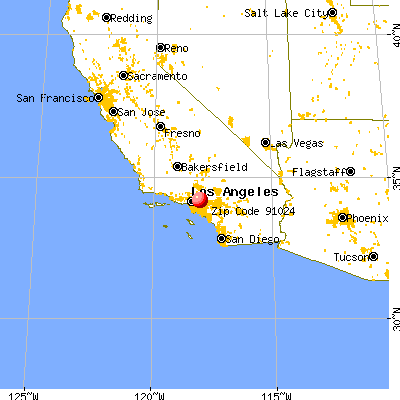


 Nearest zip codes: 91107, 91006, 91007, 91016, 91775, 91780.
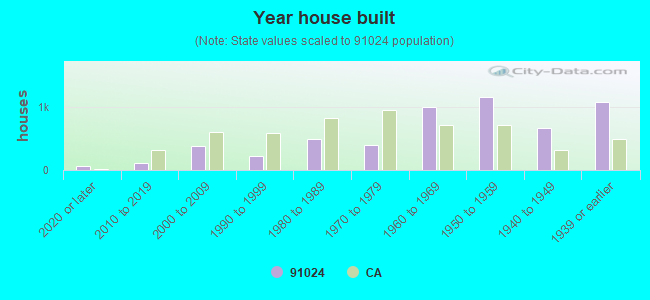


 Based on the data from the years 2005 - 2018 the average number of fires per year is 15. The highest number of reported fire incidents - 38 took place in 2005, and the least - 1 in 2009. The data has a dropping trend.
 When looking into fire subcategories, the most incidents belonged to: Outside Fires (40.0%), and Structure Fires (35.2%).