Estimated median house/condo value in 2022: $467,784
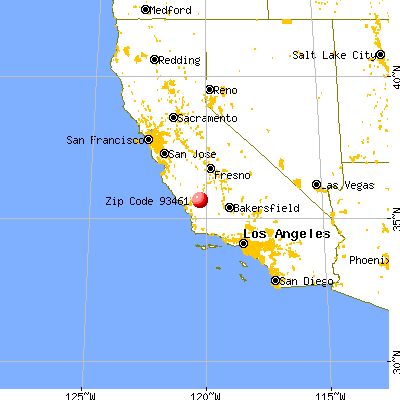
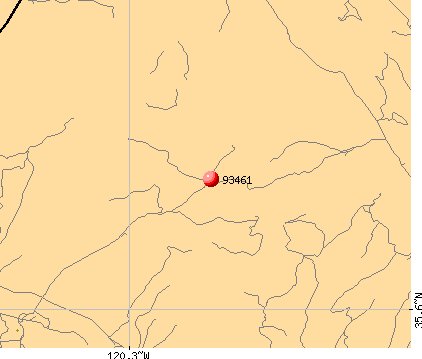
93461:
$467,784
California:
$715,900
According to our research of California and other state lists, there were 2 registered sex offenders living in 93461 zip code as of June 17, 2024. The ratio of all residents to sex offenders in zip code 93461 is 734 to 1. The ratio of registered sex offenders to all residents in this zip code is near the state average.
Median resident age:
This zip code:
37.7 years
California median age:
37.9 years
Average household size:
This zip code:
2.9 people
California:
2.8 people
Averages for the 2020 tax year for zip code 93461, filed in 2021:
Average Adjusted Gross Income (AGI) in 2020: $50,314 (Individual Income Tax Returns)
Here:
$50,314
State:
$95,910
Salary/wage: $44,758 (reported on 86.4% of returns)
Here:
$44,758
State:
$77,331
(% of AGI for various income ranges: 1673.8% for AGIs below $25k, 5180.0% for AGIs $25k-50k, 7831.2% for AGIs $50k-75k, 12272.5% for AGIs $75k-100k, 27140.0% for AGIs $100k-200k)
Taxable interest for individuals: $322 (reported on 27.3% of returns)
This zip code:
$322
California:
$2,294
(% of AGI for various income ranges: 3.1% for AGIs below $25k, 1.5% for AGIs $25k-50k, 6.2% for AGIs $50k-75k, 35.0% for AGIs $75k-100k, 165.0% for AGIs $100k-200k)
Ordinary dividends: $1,525 (reported on 6.1% of returns)
Here:
$1,525
State:
$10,949
(% of AGI for various income ranges: 23.8% for AGIs below $25k, 75.0% for AGIs $75k-100k)
Net capital gain/loss in AGI: +$4,800 (reported on 7.6% of returns)
Here:
+$4,800
State:
+$49,306
(% of AGI for various income ranges: 9.2% for AGIs $25k-50k, 570.0% for AGIs $75k-100k)
Profit/loss from business: +$9,478 (reported on 13.6% of returns)
Here:
+$9,478
State:
+$15,671
(% of AGI for various income ranges: 176.2% for AGIs below $25k, 159.2% for AGIs $25k-50k, 521.2% for AGIs $50k-75k)
Total itemized deductions: $22,600 (reported on 6.1% of returns)
Here:
$22,600
State:
$39,517
(% of AGI for various income ranges: 2260.0% for AGIs $75k-100k)
Taxes paid: $5,775 (reported on 6.1% of returns)
93461:
$5,775
State:
$8,807
(% of AGI for various income ranges: 288.8% for AGIs $50k-75k)
Earned income credit: $2,350 (reported on 15.2% of returns)
Here:
$2,350
State:
$2,074
(% of AGI for various income ranges: 94.6% for AGIs below $25k, 86.2% for AGIs $25k-50k)
Percentage of individuals using paid preparers for their 2020 taxes: 90.9%
Here:
91%
State:
92%
(% for various income ranges: 85.7% for AGIs below $25k, 90.5% for AGIs $25k-50k, 91.7% for AGIs $50k-75k, 100.0% for AGIs $75k-100k, 100.0% for AGIs $100k-200k)
Averages for the 2012 tax year for zip code 93461, filed in 2013:
Average Adjusted Gross Income (AGI) in 2012: $68,312 (Individual Income Tax Returns)
Here:
$68,312
State:
$72,726
Salary/wage: $33,215 (reported on 89.4% of returns)
Here:
$33,215
State:
$59,079
(% of AGI for various income ranges: 86.6% for AGIs below $25k, 90.1% for AGIs $25k-50k, 86.3% for AGIs $50k-75k, 83.4% for AGIs $75k-100k, 8.9% for AGIs $100k-200k)
Taxable interest for individuals: $856 (reported on 24.2% of returns)
This zip code:
$856
California:
$2,146
(% of AGI for various income ranges: 0.1% for AGIs $25k-50k, 0.1% for AGIs $50k-75k, 0.5% for AGIs $100k-200k)
Ordinary dividends: $19,950 (reported on 6.1% of returns)
Here:
$19,950
State:
$9,308
Net capital gain/loss in AGI: +$394,050 (reported on 6.1% of returns)
Here:
+$394,050
State:
+$30,460
Profit/loss from business: +$4,914 (reported on 10.6% of returns)
Here:
+$4,914
State:
+$17,064
Total itemized deductions: $26,800 (13% of AGI, reported on 21.2% of returns)
Here:
$26,800
State:
$34,004
Here:
12.7% of AGI
State:
22.7% of AGI
(% of AGI for various income ranges: 7.7% for AGIs $25k-50k, 21.6% for AGIs $50k-75k, 8.0% for AGIs $100k-200k)
Charity contributions: $5,200 (reported on 12.1% of returns)
Here:
$5,200
State:
$4,659
(% of AGI for various income ranges: 0.7% for AGIs below $25k, 1.3% for AGIs $50k-75k, 1.3% for AGIs $100k-200k)
Taxes paid: $9,986 (reported on 21.2% of returns)
93461:
$9,986
State:
$14,448
(% of AGI for various income ranges: 1.5% for AGIs $25k-50k, 4.3% for AGIs $50k-75k, 4.2% for AGIs $100k-200k)
Earned income credit: $2,215 (reported on 19.7% of returns)
Here:
$2,215
State:
$2,286
(% of AGI for various income ranges: 4.8% for AGIs below $25k, 1.1% for AGIs $25k-50k)
Percentage of individuals using paid preparers for their 2012 taxes: 71.2%
Here:
71%
State:
64%
(% for various income ranges: 71.4% for AGIs below $25k, 72.7% for AGIs $25k-50k, 88.9% for AGIs $50k-75k, 75.0% for AGIs $100k-200k)
Averages for the 2004 tax year for zip code 93461, filed in 2005:
Average Adjusted Gross Income (AGI) in 2004: $36,952 (Individual Income Tax Returns)
Here:
$36,952
State:
$58,600
Salary/wage: $29,859 (reported on 87.4% of returns)
Here:
$29,859
State:
$49,455
(% of AGI for various income ranges: 185.1% for AGIs below $10k, 85.5% for AGIs $10k-25k, 85.9% for AGIs $25k-50k, 78.6% for AGIs $50k-75k, 84.3% for AGIs $75k-100k, 17.8% for AGIs over 100k)
Taxable interest for individuals: $2,610 (reported on 36.4% of returns)
This zip code:
$2,610
California:
$2,365
(% of AGI for various income ranges: 15.4% for AGIs below $10k, 3.2% for AGIs $10k-25k, 1.4% for AGIs $25k-50k, 0.9% for AGIs $50k-75k, 0.1% for AGIs $75k-100k, 5.9% for AGIs over 100k)
Taxable dividends: $5,014 (reported on 12.3% of returns)
Here:
$5,014
State:
$4,746
(% of AGI for various income ranges: 8.8% for AGIs below $10k, 0.6% for AGIs $25k-50k, 0.5% for AGIs $50k-75k, 16.1% for AGIs $75k-100k)
Net capital gain/loss: +$6,294 (reported on 11.6% of returns)
Here:
+$6,294
State:
+$23,418
(% of AGI for various income ranges: 29.8% for AGIs below $10k, 0.7% for AGIs $25k-50k, 0.1% for AGIs $50k-75k, 17.9% for AGIs $75k-100k)
Profit/loss from business: +$7,554 (reported on 12.6% of returns)
Here:
+$7,554
State:
+$16,826
(% of AGI for various income ranges: -14.0% for AGIs below $10k, 2.3% for AGIs $10k-25k, 2.6% for AGIs $25k-50k, 6.9% for AGIs $50k-75k)
Total itemized deductions: $17,546 (29% of AGI, reported on 31.3% of returns)
Here:
$17,546
State:
$28,113
Here:
28.7% of AGI
State:
25.3% of AGI
(% of AGI for various income ranges: 10.2% for AGIs $10k-25k, 15.4% for AGIs $25k-50k, 21.2% for AGIs $50k-75k, 22.0% for AGIs $75k-100k, 8.6% for AGIs over 100k)
Charity contributions deductions: $1,277 (2% of AGI, reported on 23.4% of returns)
Here:
$1,277
State:
$3,923
Here:
1.9% of AGI
State:
3.3% of AGI
(% of AGI for various income ranges: 0.5% for AGIs $10k-25k, 0.7% for AGIs $25k-50k, 1.3% for AGIs $50k-75k, 1.2% for AGIs $75k-100k, 0.6% for AGIs over 100k)
Total tax: $4,756 (reported on 61.0% of returns)
93461:
$4,756
State:
$10,761
(% of AGI for various income ranges: 4.8% for AGIs below $10k, 2.9% for AGIs $10k-25k, 4.6% for AGIs $25k-50k, 7.9% for AGIs $50k-75k, 8.0% for AGIs $75k-100k, 16.3% for AGIs over 100k)
Earned income credit: $1,704 (reported on 19.7% of returns)
Here:
$1,704
State:
$1,763
Percentage of individuals using paid preparers for their 2004 taxes: 72.3%
Here:
72%
State:
66%
(% for various income ranges: 65.3% for AGIs below $10k, 74.3% for AGIs $10k-25k, 73.7% for AGIs $25k-50k, 67.9% for AGIs $50k-75k, 75.0% for AGIs $75k-100k, 94.1% for AGIs over 100k)
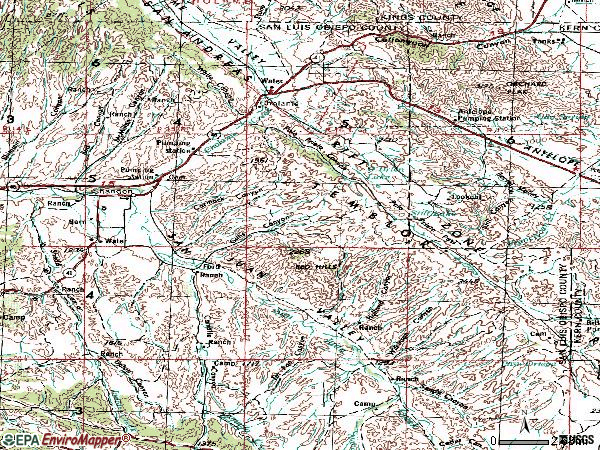
Notable locations in zip code 93461: Taylor Ranch (A), Spring Ranch (B), Shandon Pump Station (C), Sacramento Ranch (D), Ludeke Ranch (E), Kester Ranch (F), Jack Ranch (G), Iverson Ranch (H), French Camp (I), Fahey Ranch (J), Upton Ranch (K), Clarke Ranch (L), Cholame Ranch (M), Canyon Ranch (N), Hancock Ranch (O), Alfalfa Ranch (P), C W Clarke Ranch (Q), Eddy Ranch (R), California Department of Forestry and Fire Protection Station 31 Shandon (S). Display/hide their locations on the map
Lakes: Poso Ortega (A), Poison Water Pond (B), Kerr Lake (C), Twisselmann Lake (D), Long Lake (E), Still Lake (F), O'Brien Lake (G). Display/hide their locations on the map
Creeks: Cholame Creek (A), Cottonwood Creek (B), Camatta Creek (C), Shell Creek (D), San Juan Creek (E), Indian Creek (F). Display/hide their locations on the map
Size of family households: 93 2-persons, 82 3-persons, 83 4-persons, 23 5-persons, 2 6-persons, 7 7-or-more-persons
Size of nonfamily households: 66 1-person, 101 2-persons
170 married couples with children.
32 single-parent households (19 men, 13 women).
59.3% of residents of 93461 zip code speak English at home.
39.3% of residents speak Spanish at home (69% very well, 9% well, 17% not well, 5% not at all).
0.6% of residents speak Asian or Pacific Island language at home (100% very well).
Foreign born population: 221 (16.3%) (49.1% of them are naturalized citizens)
This zip code:
16.3%
Whole state:
26.7%
90%Honduras
4%Costa Rica
3%Micronesia
18%German
5%English
5%American
5%Irish
2%Scottish
2%Italian
1%Polish
Year of entry for the foreign-born population
842010 or later
492000 to 2009
1441990 to 1999
71Before 1990
Facilities with environmental interests located in this zip code:
HEARST CORPORATION (76903 CHOLAME VALLEY RD in SHANDON, CA)
National Pollutant Discharge Elimination System NON-MAJOR (Tracking pollutant discharge elimination systems) - permit
CHEVRON USA INC SHANDON STA (HWY FORTY FIRST in SHANDON, CA)
Small Quantity Generators, between 100 kg and 1000 kg of hazardous waste/month (Resource Conservation and Recovery Act (tracking hazardous waste))
CALTRANS DISTRICT 05 (CT MTC YD ON CENTRE ST HWY 41 in SHANDON, CA)
Small Quantity Generators, between 100 kg and 1000 kg of hazardous waste/month (Resource Conservation and Recovery Act (tracking hazardous waste))
CHEVRON SHANDON PUMP STATION (HWY 46 in SHANDON, CA)
CRITERIA AND HAZARDOUS AIR POLLUTANT INVENTORY (Inventory of air pollution sources) Business SIC classification: CRUDE PETROLEUM PIPELINES
46.9%Utility gas
25.1%Electricity
18.9%Bottled, tank, or LP gas
9.8%Wood
Population in 1990: 908. Population change in the 1990s: +346 (+38.1%).
Place of birth for U.S.-born residents:
This state: 823
Northeast: 31
Midwest: 24
South: 11
West: 116
49% of the 93461 zip code residents lived in the same house 5 years ago. Out of people who lived in different houses, 68% lived in this county. Out of people who lived in different counties, 50% lived in California.
95% of the 93461 zip code residents lived in the same house 1 year ago. Out of people who lived in different houses, 73% moved from this county. Out of people who lived in different houses, 29% moved from different county within same state.
Private vs. public school enrollment:
Students in private schools in grades 1 to 8 (elementary and middle school): 3
Here:
1.9%
California:
10.5%
Students in private schools in grades 9 to 12 (high school):
Here:
0.0%
California:
8.5%
Students in private undergraduate colleges:
Here:
0.0%
California:
15.9%
Occupation by median earnings in the past 12 months ($)
40,545Construction and extraction occupations
36,242Office and administrative support occupations
34,895Healthcare support occupations
34,176Management occupations
29,300Production occupations
25,265Building and grounds cleaning and maintenance occupations
Top industries in this zip code by the number of employees in 2005:
Professional, Scientific, and Technical Services: Research and Development in the Physical, Engineering, and Life Sciences (20-49 employees: 1 establishment)
Accommodation and Food Services: Full-Service Restaurants (5-9: 1)
Other Services (except Public Administration): General Automotive Repair (1-4: 1)
Health Care and Social Assistance: Community Food Services (1-4: 1)
People in group quarters in 2010:
4 people in group homes for juveniles (non-correctional)
2 people in group homes intended for adults
People in group quarters in 2000:
6 people in agriculture workers' dormitories on farms
3 people in other noninstitutional group quarters
Fatal accident statistics in 2013:
Fatal accident count: 2
Vehicles involved in fatal accidents: 4
Fatal accidents caused by drunken drivers: 1
Fatalities: 3
Persons involved in fatal accidents: 6
Pedestrians involved in fatal accidents: 0
Fatal accident statistics in 2012:
Fatal accident count: 2
Vehicles involved in fatal accidents: 4
Fatal accidents caused by drunken drivers: 0
Fatalities: 2
Persons involved in fatal accidents: 8
Pedestrians involved in fatal accidents: 0
Home Mortgage Disclosure Act Aggregated Statistics For Year 2009 (Based on 2 partial tracts)
A) FHA, FSA/RHS & VA Home Purchase Loans
B) Conventional Home Purchase Loans
C) Refinancings
D) Home Improvement Loans
F) Non-occupant Loans on < 5 Family Dwellings (A B C & D)
G) Loans On Manufactured Home Dwelling (A B C & D)
Number
Average Value
Number
Average Value
Number
Average Value
Number
Average Value
Number
Average Value
Number
Average Value
LOANS ORIGINATED
48
$274,013
62
$320,087
218
$283,338
17
$182,549
23
$365,598
16
$246,261
APPLICATIONS APPROVED, NOT ACCEPTED
5
$267,894
6
$258,075
17
$329,412
2
$273,880
4
$236,365
1
$131,650
APPLICATIONS DENIED
12
$232,605
10
$423,200
100
$302,058
6
$193,633
16
$237,054
13
$218,890
APPLICATIONS WITHDRAWN
4
$330,265
10
$286,307
47
$288,109
3
$77,637
4
$232,452
6
$266,973
FILES CLOSED FOR INCOMPLETENESS
0
$0
2
$280,325
14
$281,178
0
$0
1
$383,890
1
$176,760
Aggregated Statistics For Year 2008 (Based on 2 partial tracts)
A) FHA, FSA/RHS & VA Home Purchase Loans
B) Conventional Home Purchase Loans
C) Refinancings
D) Home Improvement Loans
E) Loans on Dwellings For 5+ Families
F) Non-occupant Loans on < 5 Family Dwellings (A B C & D)
G) Loans On Manufactured Home Dwelling (A B C & D)
Number
Average Value
Number
Average Value
Number
Average Value
Number
Average Value
Number
Average Value
Number
Average Value
Number
Average Value
LOANS ORIGINATED
16
$322,152
63
$342,200
112
$311,919
17
$154,336
0
$0
17
$307,047
15
$270,043
APPLICATIONS APPROVED, NOT ACCEPTED
5
$261,082
8
$334,754
27
$321,903
6
$198,697
0
$0
5
$256,480
4
$156,732
APPLICATIONS DENIED
5
$222,786
17
$295,892
134
$370,713
14
$178,070
1
$460,300
10
$270,012
7
$234,753
APPLICATIONS WITHDRAWN
4
$239,355
15
$285,202
42
$355,790
8
$239,011
0
$0
3
$170,617
9
$291,523
FILES CLOSED FOR INCOMPLETENESS
0
$0
6
$369,622
15
$405,801
1
$265,130
0
$0
1
$383,890
2
$239,355
Aggregated Statistics For Year 2007 (Based on 2 partial tracts)
A) FHA, FSA/RHS & VA Home Purchase Loans
B) Conventional Home Purchase Loans
C) Refinancings
D) Home Improvement Loans
F) Non-occupant Loans on < 5 Family Dwellings (A B C & D)
G) Loans On Manufactured Home Dwelling (A B C & D)
Number
Average Value
Number
Average Value
Number
Average Value
Number
Average Value
Number
Average Value
Number
Average Value
LOANS ORIGINATED
1
$338,780
118
$342,892
239
$331,035
43
$179,710
31
$372,190
22
$274,004
APPLICATIONS APPROVED, NOT ACCEPTED
0
$0
29
$346,558
46
$345,905
6
$323,745
8
$546,836
6
$209,130
APPLICATIONS DENIED
1
$340,620
37
$386,975
188
$386,676
15
$124,158
16
$370,024
9
$212,044
APPLICATIONS WITHDRAWN
0
$0
23
$284,345
81
$346,612
9
$316,174
7
$363,637
5
$164,420
FILES CLOSED FOR INCOMPLETENESS
0
$0
2
$356,270
16
$386,422
2
$147,755
1
$348,910
2
$241,660
Aggregated Statistics For Year 2006 (Based on 2 partial tracts)
A) FHA, FSA/RHS & VA Home Purchase Loans
B) Conventional Home Purchase Loans
C) Refinancings
D) Home Improvement Loans
F) Non-occupant Loans on < 5 Family Dwellings (A B C & D)
G) Loans On Manufactured Home Dwelling (A B C & D)
Number
Average Value
Number
Average Value
Number
Average Value
Number
Average Value
Number
Average Value
Number
Average Value
LOANS ORIGINATED
0
$0
197
$358,179
366
$341,580
55
$214,232
44
$430,234
17
$305,260
APPLICATIONS APPROVED, NOT ACCEPTED
0
$0
34
$295,161
65
$399,923
9
$177,471
8
$380,668
6
$295,820
APPLICATIONS DENIED
0
$0
57
$352,444
209
$361,721
28
$287,458
14
$435,575
14
$247,773
APPLICATIONS WITHDRAWN
1
$313,000
37
$339,527
157
$346,116
9
$203,657
11
$518,046
9
$314,948
FILES CLOSED FOR INCOMPLETENESS
0
$0
9
$313,924
23
$400,421
0
$0
0
$0
0
$0
Aggregated Statistics For Year 2005 (Based on 2 partial tracts)
B) Conventional Home Purchase Loans
C) Refinancings
D) Home Improvement Loans
F) Non-occupant Loans on < 5 Family Dwellings (A B C & D)
G) Loans On Manufactured Home Dwelling (A B C & D)
Number
Average Value
Number
Average Value
Number
Average Value
Number
Average Value
Number
Average Value
LOANS ORIGINATED
291
$307,559
467
$317,737
64
$184,149
59
$275,431
36
$223,859
APPLICATIONS APPROVED, NOT ACCEPTED
42
$300,466
60
$290,726
6
$189,950
5
$230,150
5
$154,108
APPLICATIONS DENIED
72
$332,337
180
$326,302
35
$123,360
15
$249,667
26
$202,355
APPLICATIONS WITHDRAWN
47
$275,534
170
$295,334
22
$230,066
7
$303,534
11
$274,925
FILES CLOSED FOR INCOMPLETENESS
10
$288,240
31
$345,997
3
$95,130
2
$225,545
1
$262,370
Aggregated Statistics For Year 2004 (Based on 2 partial tracts)
A) FHA, FSA/RHS & VA Home Purchase Loans
B) Conventional Home Purchase Loans
C) Refinancings
D) Home Improvement Loans
F) Non-occupant Loans on < 5 Family Dwellings (A B C & D)
G) Loans On Manufactured Home Dwelling (A B C & D)
Number
Average Value
Number
Average Value
Number
Average Value
Number
Average Value
Number
Average Value
Number
Average Value
LOANS ORIGINATED
8
$245,455
274
$251,902
439
$258,919
46
$191,865
61
$269,464
37
$211,614
APPLICATIONS APPROVED, NOT ACCEPTED
2
$202,990
37
$255,131
75
$254,577
11
$125,620
5
$265,502
11
$274,841
APPLICATIONS DENIED
1
$206,210
68
$258,878
136
$301,876
33
$93,622
16
$296,491
20
$236,180
APPLICATIONS WITHDRAWN
0
$0
41
$279,256
160
$243,430
13
$78,322
6
$273,112
8
$254,891
FILES CLOSED FOR INCOMPLETENESS
0
$0
6
$183,507
18
$216,034
4
$42,578
1
$133,490
2
$205,755
Aggregated Statistics For Year 2003 (Based on 2 partial tracts)
A) FHA, FSA/RHS & VA Home Purchase Loans
B) Conventional Home Purchase Loans
C) Refinancings
D) Home Improvement Loans
F) Non-occupant Loans on < 5 Family Dwellings (A B C & D)
Number
Average Value
Number
Average Value
Number
Average Value
Number
Average Value
Number
Average Value
LOANS ORIGINATED
14
$224,429
203
$248,957
853
$219,313
29
$68,664
62
$226,185
APPLICATIONS APPROVED, NOT ACCEPTED
0
$0
22
$216,843
103
$204,847
9
$39,994
6
$215,727
APPLICATIONS DENIED
2
$197,470
39
$218,961
179
$230,808
11
$43,854
12
$195,014
APPLICATIONS WITHDRAWN
1
$216,340
30
$267,373
143
$227,208
6
$55,390
7
$255,796
FILES CLOSED FOR INCOMPLETENESS
1
$220,940
1
$147,300
29
$225,325
2
$34,525
1
$262,370
Aggregated Statistics For Year 2002 (Based on 2 partial tracts)
A) FHA, FSA/RHS & VA Home Purchase Loans
B) Conventional Home Purchase Loans
C) Refinancings
D) Home Improvement Loans
F) Non-occupant Loans on < 5 Family Dwellings (A B C & D)
Number
Average Value
Number
Average Value
Number
Average Value
Number
Average Value
Number
Average Value
LOANS ORIGINATED
17
$176,268
188
$212,879
628
$196,412
34
$73,404
48
$227,005
APPLICATIONS APPROVED, NOT ACCEPTED
1
$220,020
25
$171,600
77
$200,798
6
$25,777
6
$140,085
APPLICATIONS DENIED
5
$164,972
33
$167,493
163
$202,391
12
$29,229
10
$215,052
APPLICATIONS WITHDRAWN
1
$136,250
17
$184,608
114
$197,776
8
$38,435
1
$208,980
FILES CLOSED FOR INCOMPLETENESS
0
$0
6
$130,725
25
$176,092
0
$0
1
$61,680
Aggregated Statistics For Year 2001 (Based on 2 partial tracts)
A) FHA, FSA/RHS & VA Home Purchase Loans
B) Conventional Home Purchase Loans
C) Refinancings
D) Home Improvement Loans
F) Non-occupant Loans on < 5 Family Dwellings (A B C & D)
Number
Average Value
Number
Average Value
Number
Average Value
Number
Average Value
Number
Average Value
LOANS ORIGINATED
41
$164,204
209
$169,650
524
$171,634
20
$43,636
31
$207,432
APPLICATIONS APPROVED, NOT ACCEPTED
0
$0
12
$142,617
46
$176,355
7
$57,734
3
$132,873
APPLICATIONS DENIED
16
$153,855
42
$136,556
108
$200,435
17
$26,644
3
$295,820
APPLICATIONS WITHDRAWN
3
$139,623
10
$158,619
115
$174,418
9
$24,242
5
$199,954
FILES CLOSED FOR INCOMPLETENESS
0
$0
1
$193,330
33
$165,290
0
$0
1
$151,900
Aggregated Statistics For Year 2000 (Based on 2 partial tracts)
A) FHA, FSA/RHS & VA Home Purchase Loans
B) Conventional Home Purchase Loans
C) Refinancings
D) Home Improvement Loans
E) Loans on Dwellings For 5+ Families
F) Non-occupant Loans on < 5 Family Dwellings (A B C & D)
Number
Average Value
Number
Average Value
Number
Average Value
Number
Average Value
Number
Average Value
Number
Average Value
LOANS ORIGINATED
37
$134,184
159
$164,811
136
$145,922
17
$33,521
1
$162,030
27
$214,602
APPLICATIONS APPROVED, NOT ACCEPTED
1
$113,230
16
$429,402
23
$106,750
9
$47,258
0
$0
4
$91,140
APPLICATIONS DENIED
11
$139,178
37
$151,376
115
$142,021
19
$29,847
1
$101,270
6
$174,760
APPLICATIONS WITHDRAWN
3
$163,867
16
$142,521
44
$123,549
6
$33,448
0
$0
3
$176,450
FILES CLOSED FOR INCOMPLETENESS
1
$153,740
6
$112,620
11
$145,538
1
$27,620
0
$0
0
$0
Aggregated Statistics For Year 1999 (Based on 1 partial tract)
A) FHA, FSA/RHS & VA Home Purchase Loans
B) Conventional Home Purchase Loans
C) Refinancings
D) Home Improvement Loans
E) Loans on Dwellings For 5+ Families
F) Non-occupant Loans on < 5 Family Dwellings (A B C & D)
Detailed PMIC statistics for the following Tracts:0103.00
2005 - 2018 National Fire Incident Reporting System (NFIRS) incidents
Based on the data from the years 2005 - 2018 the average number of fire incidents per year is 13. The highest number of reported fires - 23 took place in 2017, and the least - 3 in 2005. The data has an increasing trend.
When looking into fire subcategories, the most incidents belonged to: Outside Fires (61.9%), and Mobile Property/Vehicle Fires (22.7%).
Fire incident types reported to NFIRS in Zip Code 93461


 Nearest zip codes: 93432, 93204, 93453, 93249, 93451, 93446.


 Based on the data from the years 2005 - 2018 the average number of fire incidents per year is 13. The highest number of reported fires - 23 took place in 2017, and the least - 3 in 2005. The data has an increasing trend.
 When looking into fire subcategories, the most incidents belonged to: Outside Fires (61.9%), and Mobile Property/Vehicle Fires (22.7%).