According to our research of California and other state lists, there was 1 registered sex offender living in 94535 zip code as of June 16, 2024. The ratio of all residents to sex offenders in zip code 94535 is 4,330 to 1. The ratio of registered sex offenders to all residents in this zip code is much lower than the state average.
Median resident age:
This zip code:
22.9 years
California median age:
37.9 years
Average household size:
This zip code:
3.4 people
California:
2.8 people
Averages for the 2020 tax year for zip code 94535, filed in 2021:
Average Adjusted Gross Income (AGI) in 2020: $49,251 (Individual Income Tax Returns)
Here:
$49,251
State:
$95,910
Salary/wage: $47,127 (reported on 97.3% of returns)
Here:
$47,127
State:
$77,331
(% of AGI for various income ranges: 1887.0% for AGIs below $25k, 3626.9% for AGIs $25k-50k, 6428.8% for AGIs $50k-75k, 9215.4% for AGIs $75k-100k, 18763.8% for AGIs $100k-200k)
Taxable interest for individuals: $319 (reported on 17.4% of returns)
This zip code:
$319
California:
$2,294
(% of AGI for various income ranges: 0.8% for AGIs below $25k, 2.2% for AGIs $25k-50k, 3.1% for AGIs $50k-75k, 8.5% for AGIs $75k-100k, 50.8% for AGIs $100k-200k)
Ordinary dividends: $1,045 (reported on 12.0% of returns)
Here:
$1,045
State:
$10,949
(% of AGI for various income ranges: 1.2% for AGIs below $25k, 2.9% for AGIs $25k-50k, 6.5% for AGIs $50k-75k, 6.2% for AGIs $75k-100k, 140.0% for AGIs $100k-200k)
Net capital gain/loss in AGI: +$2,121 (reported on 15.2% of returns)
Here:
+$2,121
State:
+$49,306
(% of AGI for various income ranges: 4.2% for AGIs below $25k, 9.6% for AGIs $25k-50k, 28.5% for AGIs $50k-75k, 6.2% for AGIs $75k-100k, 333.8% for AGIs $100k-200k)
Profit/loss from business: +$2,108 (reported on 6.5% of returns)
Here:
+$2,108
State:
+$15,671
(% of AGI for various income ranges: 1.0% for AGIs below $25k, 19.1% for AGIs $25k-50k, 61.9% for AGIs $50k-75k)
Total itemized deductions: $27,800 (reported on 1.6% of returns)
Here:
$27,800
State:
$39,517
(% of AGI for various income ranges: 641.5% for AGIs $75k-100k)
Taxes paid: $7,033 (reported on 1.6% of returns)
94535:
$7,033
State:
$8,807
(% of AGI for various income ranges: 162.3% for AGIs $75k-100k)
Earned income credit: $2,875 (reported on 19.6% of returns)
Here:
$2,875
State:
$2,074
(% of AGI for various income ranges: 53.7% for AGIs below $25k, 126.4% for AGIs $25k-50k, 6.9% for AGIs $50k-75k)
Percentage of individuals using paid preparers for their 2020 taxes: 97.8%
Here:
98%
State:
92%
(% for various income ranges: 96.9% for AGIs below $25k, 98.2% for AGIs $25k-50k, 100.0% for AGIs $50k-75k, 100.0% for AGIs $75k-100k, 94.7% for AGIs $100k-200k)
Averages for the 2012 tax year for zip code 94535, filed in 2013:
Average Adjusted Gross Income (AGI) in 2012: $37,047 (Individual Income Tax Returns)
Here:
$37,047
State:
$72,726
Salary/wage: $36,050 (reported on 98.6% of returns)
Here:
$36,050
State:
$59,079
(% of AGI for various income ranges: 99.7% for AGIs below $25k, 98.8% for AGIs $25k-50k, 96.0% for AGIs $50k-75k, 95.1% for AGIs $75k-100k, 86.8% for AGIs $100k-200k)
Taxable interest for individuals: $193 (reported on 19.3% of returns)
This zip code:
$193
California:
$2,146
(% of AGI for various income ranges: 0.1% for AGIs $50k-75k, 0.2% for AGIs $100k-200k)
Ordinary dividends: $881 (reported on 7.3% of returns)
Here:
$881
State:
$9,308
(% of AGI for various income ranges: 0.2% for AGIs $25k-50k, 0.1% for AGIs $50k-75k, 0.3% for AGIs $75k-100k, 0.4% for AGIs $100k-200k)
Net capital gain/loss in AGI: +$390 (reported on 4.6% of returns)
Here:
+$390
State:
+$30,460
(% of AGI for various income ranges: 0.2% for AGIs $75k-100k, 0.1% for AGIs $100k-200k)
Profit/loss from business: +$1,400 (reported on 4.6% of returns)
Here:
+$1,400
State:
+$17,064
(% of AGI for various income ranges: 0.3% for AGIs $25k-50k, 0.5% for AGIs $50k-75k)
Total itemized deductions: $20,412 (23% of AGI, reported on 7.3% of returns)
Here:
$20,412
State:
$34,004
Here:
23.4% of AGI
State:
22.7% of AGI
(% of AGI for various income ranges: 3.1% for AGIs $25k-50k, 4.3% for AGIs $50k-75k, 6.7% for AGIs $75k-100k, 8.6% for AGIs $100k-200k)
Charity contributions: $3,392 (reported on 5.5% of returns)
Here:
$3,392
State:
$4,659
(% of AGI for various income ranges: 0.4% for AGIs $25k-50k, 0.5% for AGIs $50k-75k, 0.9% for AGIs $75k-100k, 1.1% for AGIs $100k-200k)
Taxes paid: $5,520 (reported on 6.9% of returns)
94535:
$5,520
State:
$14,448
(% of AGI for various income ranges: 0.7% for AGIs $25k-50k, 0.9% for AGIs $50k-75k, 1.6% for AGIs $75k-100k, 2.7% for AGIs $100k-200k)
Earned income credit: $2,660 (reported on 28.4% of returns)
Here:
$2,660
State:
$2,286
(% of AGI for various income ranges: 4.8% for AGIs below $25k, 3.4% for AGIs $25k-50k)
Percentage of individuals using paid preparers for their 2012 taxes: 27.1%
Here:
27%
State:
64%
(% for various income ranges: 23.6% for AGIs below $25k, 27.3% for AGIs $25k-50k, 33.3% for AGIs $50k-75k, 38.5% for AGIs $75k-100k, 33.3% for AGIs $100k-200k)
Averages for the 2004 tax year for zip code 94535, filed in 2005:
Average Adjusted Gross Income (AGI) in 2004: $30,417 (Individual Income Tax Returns)
Here:
$30,417
State:
$58,600
Salary/wage: $29,731 (reported on 99.0% of returns)
Here:
$29,731
State:
$49,455
(% of AGI for various income ranges: 101.2% for AGIs below $10k, 99.3% for AGIs $10k-25k, 98.7% for AGIs $25k-50k, 97.6% for AGIs $50k-75k, 96.3% for AGIs $75k-100k, 79.9% for AGIs over 100k)
Taxable interest for individuals: $272 (reported on 24.4% of returns)
This zip code:
$272
California:
$2,365
(% of AGI for various income ranges: 0.1% for AGIs below $10k, 0.1% for AGIs $10k-25k, 0.1% for AGIs $25k-50k, 0.2% for AGIs $50k-75k, 0.2% for AGIs $75k-100k, 1.0% for AGIs over 100k)
Taxable dividends: $676 (reported on 10.4% of returns)
Here:
$676
State:
$4,746
(% of AGI for various income ranges: 0.3% for AGIs below $10k, 0.1% for AGIs $10k-25k, 0.1% for AGIs $25k-50k, 0.1% for AGIs $50k-75k, 0.2% for AGIs $75k-100k, 1.5% for AGIs over 100k)
Net capital gain/loss: +$2,208 (reported on 7.0% of returns)
Here:
+$2,208
State:
+$23,418
(% of AGI for various income ranges: 0.0% for AGIs below $10k, -0.0% for AGIs $10k-25k, 0.0% for AGIs $25k-50k, 0.1% for AGIs $50k-75k, 0.3% for AGIs $75k-100k, 5.4% for AGIs over 100k)
Profit/loss from business: +$1,443 (reported on 4.4% of returns)
Here:
+$1,443
State:
+$16,826
IRA payment deduction: $2,189 (reported on 1.9% of returns)
94535:
$2,189
California:
$3,192
Total itemized deductions: $18,651 (25% of AGI, reported on 5.4% of returns)
Here:
$18,651
State:
$28,113
Here:
24.8% of AGI
State:
25.3% of AGI
(% of AGI for various income ranges: 0.8% for AGIs $10k-25k, 2.1% for AGIs $25k-50k, 4.5% for AGIs $50k-75k, 6.7% for AGIs $75k-100k, 9.5% for AGIs over 100k)
Charity contributions deductions: $3,281 (4% of AGI, reported on 4.6% of returns)
Here:
$3,281
State:
$3,923
Here:
4.2% of AGI
State:
3.3% of AGI
(% of AGI for various income ranges: 1.0% for AGIs below $10k, 0.3% for AGIs $25k-50k, 0.8% for AGIs $50k-75k, 1.0% for AGIs $75k-100k, 1.4% for AGIs over 100k)
Total tax: $2,386 (reported on 68.3% of returns)
94535:
$2,386
State:
$10,761
(% of AGI for various income ranges: 1.1% for AGIs below $10k, 3.7% for AGIs $10k-25k, 2.7% for AGIs $25k-50k, 6.2% for AGIs $50k-75k, 9.4% for AGIs $75k-100k, 14.7% for AGIs over 100k)
Earned income credit: $1,763 (reported on 22.3% of returns)
Here:
$1,763
State:
$1,763
Percentage of individuals using paid preparers for their 2004 taxes: 42.3%
Here:
42%
State:
66%
(% for various income ranges: 43.3% for AGIs below $10k, 39.7% for AGIs $10k-25k, 43.3% for AGIs $25k-50k, 44.5% for AGIs $50k-75k, 52.1% for AGIs $75k-100k, 56.6% for AGIs over 100k)
Household received Food Stamps/SNAP in the past 12 months: 45 Household did not receive Food Stamps/SNAP in the past 12 months: 969
Women who had a birth in the past 12 months: 153 (136 now married, 17 unmarried) Women who did not have a birth in the past 12 months: 954 (803 now married, 132 unmarried)
Residents with income below the poverty level in 2022:
This zip code:
3.7%
Whole state:
12.2%
Residents with income below 50% of the poverty level in 2022:
This zip code:
2.6%
Whole state:
6.2%
Median number of rooms in apartments:
Here:
5.4
State:
3.9
Notable locations in this zip code not listed on our city pages
In group quarters: 382 (-1 institutionalized population)
Size of family households: 289 2-persons, 237 3-persons, 280 4-persons, 109 5-persons, 49 6-persons, 19 7-or-more-persons
Size of nonfamily households: 26 1-person, 5 2-persons
1,283 married couples with children.
122 single-parent households (46 men, 76 women).
83.6% of residents of 94535 zip code speak English at home.
7.4% of residents speak Spanish at home (88% very well, 9% well, 3% not well).
0.9% of residents speak other Indo-European language at home (89% very well, 11% well).
6.2% of residents speak Asian or Pacific Island language at home (38% very well, 55% well, 7% not well).
0.2% of residents speak other language at home (100% very well).
Foreign born population: 205 (5.4%) (52.9% of them are naturalized citizens)
This zip code:
5.4%
Whole state:
26.7%
16%Bhutan
14%Honduras
12%Greece
8%Tanzania
7%Japan
7%Cambodia
7%Indonesia
29%European
7%American
4%African
3%Irish
2%German
1%English
1%Scotch-Irish
Year of entry for the foreign-born population
2392010 or later
1722000 to 2009
1131990 to 1999
50Before 1990
Facilities with environmental interests located in this zip code:
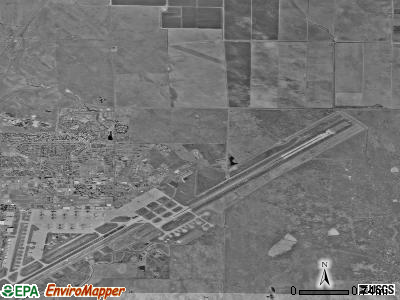
CENTER ELEMENTARY (2900 ARMSTRONG ST. in TRAVIS AFB, CA)
(National Center for Education Statistics) - STATE ID-6051254 Organizations: TRAVIS UNIFIED (SCHOOL DISTRICT)
Housing units lacking complete kitchen facilities: 0.4%
56.3%Utility gas
39.7%Electricity
4.0%Bottled, tank, or LP gas
Population in 1990: 9,874. Population change in the 1990s: +92 (+0.9%).
Place of birth for U.S.-born residents:
This state: 1,032
Northeast: 266
Midwest: 501
South: 1,067
West: 350
14% of the 94535 zip code residents lived in the same house 5 years ago. Out of people who lived in different houses, 17% lived in this county. Out of people who lived in different counties, 50% lived in California.
66% of the 94535 zip code residents lived in the same house 1 year ago. Out of people who lived in different houses, 26% moved from this county. Out of people who lived in different houses, 1% moved from different county within same state. Out of people who lived in different houses, 44% moved from different state. Out of people who lived in different houses, 33% moved from abroad.
Private vs. public school enrollment:
Students in private schools in grades 1 to 8 (elementary and middle school): 50
Here:
10.4%
California:
10.5%
Students in private schools in grades 9 to 12 (high school): 96
Here:
65.1%
California:
8.5%
Students in private undergraduate colleges: 132
Here:
34.6%
California:
15.9%
Occupation by median earnings in the past 12 months ($)
100,373Health diagnosing and treating practitioners and other technical occupations
71,370Management occupations
58,121Computer and mathematical occupations
43,054Transportation occupations
41,847Production occupations
35,795Sales and related occupations
Companies with federal contracts located in this zip code:
AT&T CORP (115 1ST ST TRAVIS AFB in FAIRFIELD, CA)
$104,899 with Air Force for Installation of Equipment -- Communication, Detection, and Coherent Radiation Equipment. Signed on 1999-11-24. Completion date: 2000-09-30.
GEISKOPF'S ENTERPRISES INC (600 PARKER RD in FAIRFIELD, CA; small business)
$16,200 with Air Force for Lease or Rental of Equipment -- Ground Effect Vehicles, Motor Vehicles, Trailers, and Cycles. Signed on 2004-10-20. Completion date: 2005-02-05.
NICOLE PETERSON (108 MICHIGAN ST in TRAVIS AFB, CA; small business) : $9,010 in 4 contractsfrom 2004 to 2005
$6,900 with Air Force for Other Education and Training Services. Signed on 2004-10-01. Completion date: 2005-09-30.
$4,250, same as above.Signed on 2005-10-01. Completion date: 2006-09-30.
$3,910, same as above.Signed on 2004-10-01. Completion date: 2005-09-30.
-$6,050 with Air Force for Educational Services. Signed on 2005-07-12. Completion date: 2005-07-12.
Top industries in this zip code by the number of employees in 2005:
Health Care and Social Assistance: General Medical and Surgical Hospitals (over 1000 employees: 1 establishment)
Accommodation and Food Services: Limited-Service Restaurants (100-249: 1, 20-49: 1)
Professional, Scientific, and Technical Services: Marketing Consulting Services (100-249: 1)
Administrative and Support and Waste Management and Remediation Services: Janitorial Services (50-99: 1, 10-19: 1)
Wholesale Trade: General Line Grocery Merchant Wholesalers (50-99: 1)
Administrative and Support and Waste Management and Remediation Services: Facilities Support Services (50-99: 1)
Administrative and Support and Waste Management and Remediation Services: Landscaping Services (20-49: 1)
Construction: Commercial and Institutional Building Construction (20-49: 1)
People in group quarters in 2010:
908 people in military barracks and dormitories (nondisciplinary)
People in group quarters in 2000:
2,008 people in military barracks, etc.
7 people in military transient quarters for temporary residents
5 people in wards in military hospitals for patients who have no usual home elsewhere
2 people in unknown juvenile institutions
Home Mortgage Disclosure Act Aggregated Statistics For Year 2009 (Based on 2 full tracts)
A) FHA, FSA/RHS & VA Home Purchase Loans
B) Conventional Home Purchase Loans
E) Loans on Dwellings For 5+ Families
Number
Average Value
Number
Average Value
Number
Average Value
LOANS ORIGINATED
0
$0
0
$0
2
$4,689,190
APPLICATIONS APPROVED, NOT ACCEPTED
0
$0
0
$0
0
$0
APPLICATIONS DENIED
2
$474,905
0
$0
0
$0
APPLICATIONS WITHDRAWN
0
$0
6
$239,448
0
$0
FILES CLOSED FOR INCOMPLETENESS
0
$0
0
$0
0
$0
Aggregated Statistics For Year 2008 (Based on 2 full tracts)
A) FHA, FSA/RHS & VA Home Purchase Loans
B) Conventional Home Purchase Loans
E) Loans on Dwellings For 5+ Families
Number
Average Value
Number
Average Value
Number
Average Value
LOANS ORIGINATED
2
$367,155
2
$302,305
2
$79,436,875
APPLICATIONS APPROVED, NOT ACCEPTED
2
$299,310
0
$0
0
$0
APPLICATIONS DENIED
0
$0
0
$0
0
$0
APPLICATIONS WITHDRAWN
0
$0
0
$0
0
$0
FILES CLOSED FOR INCOMPLETENESS
0
$0
2
$185,570
0
$0
Aggregated Statistics For Year 2007 (Based on 2 full tracts)
B) Conventional Home Purchase Loans
C) Refinancings
D) Home Improvement Loans
Number
Average Value
Number
Average Value
Number
Average Value
LOANS ORIGINATED
6
$302,968
2
$371,145
0
$0
APPLICATIONS APPROVED, NOT ACCEPTED
0
$0
0
$0
0
$0
APPLICATIONS DENIED
4
$653,492
0
$0
2
$29,930
APPLICATIONS WITHDRAWN
2
$371,145
0
$0
0
$0
FILES CLOSED FOR INCOMPLETENESS
0
$0
2
$414,045
0
$0
Aggregated Statistics For Year 2006 (Based on 2 full tracts)
B) Conventional Home Purchase Loans
C) Refinancings
D) Home Improvement Loans
F) Non-occupant Loans on < 5 Family Dwellings (A B C & D)
Number
Average Value
Number
Average Value
Number
Average Value
Number
Average Value
LOANS ORIGINATED
6
$205,858
0
$0
6
$171,605
2
$14,965
APPLICATIONS APPROVED, NOT ACCEPTED
0
$0
0
$0
0
$0
0
$0
APPLICATIONS DENIED
12
$223,651
12
$296,816
2
$24,940
0
$0
APPLICATIONS WITHDRAWN
6
$315,273
2
$69,840
0
$0
2
$367,155
FILES CLOSED FOR INCOMPLETENESS
0
$0
0
$0
0
$0
0
$0
Aggregated Statistics For Year 2005 (Based on 2 full tracts)
B) Conventional Home Purchase Loans
C) Refinancings
D) Home Improvement Loans
F) Non-occupant Loans on < 5 Family Dwellings (A B C & D)
G) Loans On Manufactured Home Dwelling (A B C & D)
Number
Average Value
Number
Average Value
Number
Average Value
Number
Average Value
Number
Average Value
LOANS ORIGINATED
8
$284,095
0
$0
0
$0
0
$0
0
$0
APPLICATIONS APPROVED, NOT ACCEPTED
10
$151,850
0
$0
0
$0
2
$193,555
2
$69,840
APPLICATIONS DENIED
20
$277,460
4
$118,728
6
$55,207
4
$178,588
4
$50,882
APPLICATIONS WITHDRAWN
6
$266,387
4
$204,030
0
$0
0
$0
0
$0
FILES CLOSED FOR INCOMPLETENESS
10
$147,261
0
$0
2
$1,995
0
$0
0
$0
Aggregated Statistics For Year 2004 (Based on 2 full tracts)
A) FHA, FSA/RHS & VA Home Purchase Loans
B) Conventional Home Purchase Loans
C) Refinancings
D) Home Improvement Loans
F) Non-occupant Loans on < 5 Family Dwellings (A B C & D)
G) Loans On Manufactured Home Dwelling (A B C & D)
Number
Average Value
Number
Average Value
Number
Average Value
Number
Average Value
Number
Average Value
Number
Average Value
LOANS ORIGINATED
0
$0
36
$273,148
2
$1,995
2
$333,230
2
$390,100
2
$333,230
APPLICATIONS APPROVED, NOT ACCEPTED
0
$0
10
$233,063
8
$231,466
2
$2,995
2
$31,925
0
$0
APPLICATIONS DENIED
2
$252,420
16
$224,732
16
$164,496
0
$0
6
$108,417
2
$67,845
APPLICATIONS WITHDRAWN
0
$0
2
$567,690
10
$170,208
0
$0
0
$0
2
$79,815
FILES CLOSED FOR INCOMPLETENESS
0
$0
0
$0
0
$0
0
$0
0
$0
0
$0
Aggregated Statistics For Year 2003 (Based on 2 full tracts)
B) Conventional Home Purchase Loans
C) Refinancings
D) Home Improvement Loans
F) Non-occupant Loans on < 5 Family Dwellings (A B C & D)
Number
Average Value
Number
Average Value
Number
Average Value
Number
Average Value
LOANS ORIGINATED
36
$343,042
14
$250,565
0
$0
0
$0
APPLICATIONS APPROVED, NOT ACCEPTED
6
$240,113
6
$214,505
2
$8,980
2
$291,330
APPLICATIONS DENIED
14
$151,223
12
$201,202
8
$5,488
0
$0
APPLICATIONS WITHDRAWN
4
$425,020
4
$261,895
0
$0
0
$0
FILES CLOSED FOR INCOMPLETENESS
6
$192,888
2
$322,255
0
$0
0
$0
Aggregated Statistics For Year 2002 (Based on 2 full tracts)
A) FHA, FSA/RHS & VA Home Purchase Loans
B) Conventional Home Purchase Loans
C) Refinancings
F) Non-occupant Loans on < 5 Family Dwellings (A B C & D)
Number
Average Value
Number
Average Value
Number
Average Value
Number
Average Value
LOANS ORIGINATED
0
$0
40
$215,752
38
$246,589
0
$0
APPLICATIONS APPROVED, NOT ACCEPTED
2
$244,435
14
$123,572
0
$0
0
$0
APPLICATIONS DENIED
0
$0
8
$169,859
10
$281,152
0
$0
APPLICATIONS WITHDRAWN
2
$122,715
14
$243,296
10
$193,753
2
$59,860
FILES CLOSED FOR INCOMPLETENESS
0
$0
10
$229,471
0
$0
0
$0
Aggregated Statistics For Year 2001 (Based on 2 full tracts)
B) Conventional Home Purchase Loans
C) Refinancings
D) Home Improvement Loans
Number
Average Value
Number
Average Value
Number
Average Value
LOANS ORIGINATED
4
$128,205
4
$236,952
2
$44,895
APPLICATIONS APPROVED, NOT ACCEPTED
14
$127,563
0
$0
0
$0
APPLICATIONS DENIED
14
$83,521
16
$124,463
2
$4,990
APPLICATIONS WITHDRAWN
0
$0
10
$97,575
0
$0
FILES CLOSED FOR INCOMPLETENESS
0
$0
0
$0
0
$0
Aggregated Statistics For Year 2000 (Based on 2 full tracts)
A) FHA, FSA/RHS & VA Home Purchase Loans
B) Conventional Home Purchase Loans
C) Refinancings
D) Home Improvement Loans
Number
Average Value
Number
Average Value
Number
Average Value
Number
Average Value
LOANS ORIGINATED
0
$0
2
$224,480
0
$0
0
$0
APPLICATIONS APPROVED, NOT ACCEPTED
0
$0
4
$121,220
2
$30,930
0
$0
APPLICATIONS DENIED
2
$178,590
4
$92,288
6
$36,915
2
$3,990
APPLICATIONS WITHDRAWN
0
$0
2
$139,680
2
$24,940
0
$0
FILES CLOSED FOR INCOMPLETENESS
2
$138,680
0
$0
0
$0
0
$0
Aggregated Statistics For Year 1999 (Based on 1 full tract)
A) FHA, FSA/RHS & VA Home Purchase Loans
B) Conventional Home Purchase Loans
C) Refinancings
F) Non-occupant Loans on < 5 Family Dwellings (A B C & D)


 Nearest zip codes: 95687, 95625, 94533, 94585, 95688, 94512.