Estimated zip code population in 2022: 25,497 Zip code population in 2010: 25,592 Zip code population in 2000: 21,203
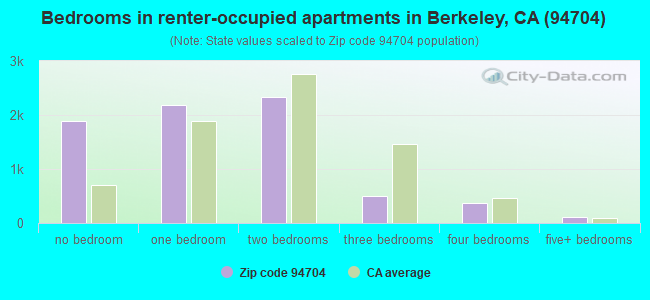
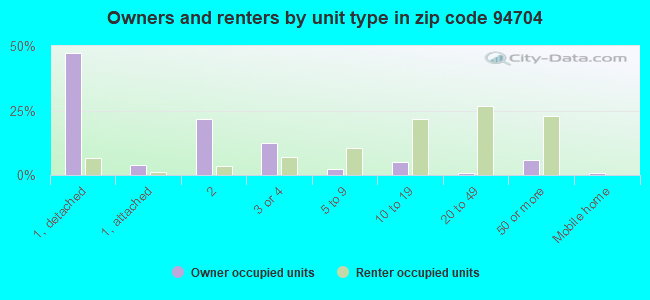
Houses and condos: 9,669 Renter-occupied apartments: 7,298
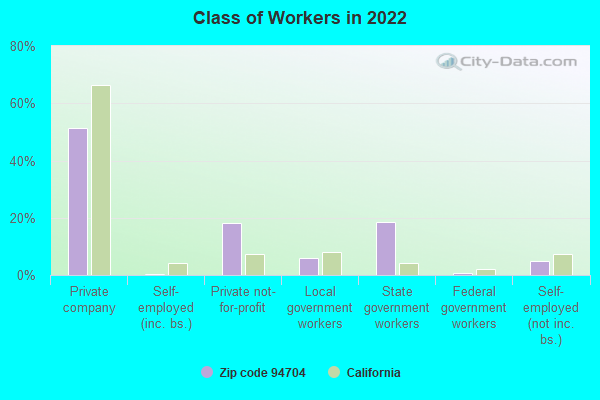
% of renters here:
88%
State:
44%
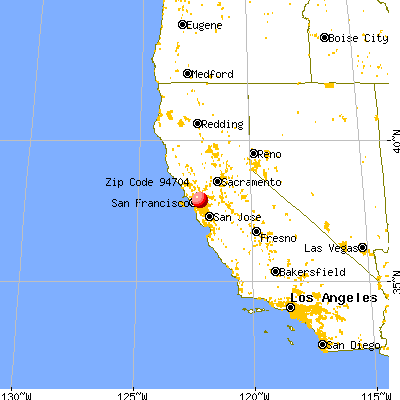
March 2022 cost of living index in zip code 94704: 134.0 (high, U.S. average is 100)
Land area: 1.1 sq. mi. Water area: 0.0 sq. mi.
Population density: 23,841 people per square mile
(very high).
OSM Map
General Map
Google Map
MSN Map
OSM Map
General Map
Google Map
MSN Map
OSM Map
General Map
Google Map
MSN Map
OSM Map
General Map
Google Map
MSN Map
Please wait while loading the map...
Real estate property taxes paid for housing units in 2022:
This zip code:
1.0% ($10,292)
California:
0.7% ($4,831)
Median real estate property taxes paid for housing units with mortgages in 2022: $10,330 (0.9%) Median real estate property taxes paid for housing units with no mortgage in 2022: $7,100 (1.0%)
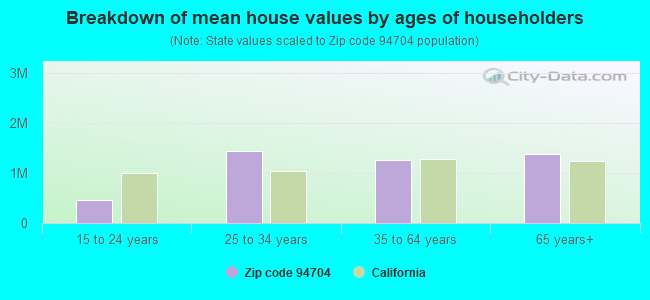
Estimated median house/condo value in 2022: $1,060,983
94704:
$1,060,983
California:
$715,900
According to our research of California and other state lists, there were 8 registered sex offenders living in 94704 zip code as of June 16, 2024. The ratio of all residents to sex offenders in zip code 94704 is 3,424 to 1. The ratio of registered sex offenders to all residents in this zip code is much lower than the state average.
Median resident age:
This zip code:
22.3 years
California median age:
37.9 years
Average household size:
This zip code:
2.4 people
California:
2.8 people
Averages for the 2020 tax year for zip code 94704, filed in 2021:
Average Adjusted Gross Income (AGI) in 2020: $77,048 (Individual Income Tax Returns)
Here:
$77,048
State:
$95,910
Salary/wage: $64,274 (reported on 82.2% of returns)
Here:
$64,274
State:
$77,331
(% of AGI for various income ranges: 1095.7% for AGIs below $25k, 4218.6% for AGIs $25k-50k, 7409.6% for AGIs $50k-75k, 11846.5% for AGIs $75k-100k, 21585.3% for AGIs $100k-200k, 103312.7% for AGIs over 200k)
Taxable interest for individuals: $1,923 (reported on 32.5% of returns)
This zip code:
$1,923
California:
$2,294
(% of AGI for various income ranges: 14.8% for AGIs below $25k, 38.8% for AGIs $25k-50k, 60.4% for AGIs $50k-75k, 87.3% for AGIs $75k-100k, 257.5% for AGIs $100k-200k, 1535.5% for AGIs over 200k)
Ordinary dividends: $6,370 (reported on 28.7% of returns)
Here:
$6,370
State:
$10,949
(% of AGI for various income ranges: 30.1% for AGIs below $25k, 77.9% for AGIs $25k-50k, 158.5% for AGIs $50k-75k, 230.4% for AGIs $75k-100k, 556.2% for AGIs $100k-200k, 5668.2% for AGIs over 200k)
Net capital gain/loss in AGI: +$29,436 (reported on 27.5% of returns)
Here:
+$29,436
State:
+$49,306
(% of AGI for various income ranges: 35.1% for AGIs below $25k, 112.0% for AGIs $25k-50k, 173.4% for AGIs $50k-75k, 368.8% for AGIs $75k-100k, 1103.8% for AGIs $100k-200k, 36280.0% for AGIs over 200k)
Profit/loss from business: +$15,351 (reported on 19.4% of returns)
Here:
+$15,351
State:
+$15,671
(% of AGI for various income ranges: 138.4% for AGIs below $25k, 252.8% for AGIs $25k-50k, 363.2% for AGIs $50k-75k, 696.2% for AGIs $75k-100k, 963.1% for AGIs $100k-200k, 5567.3% for AGIs over 200k)
Taxable individual retirement arrangement distribution: $19,221 (reported on 4.8% of returns)
94704:
$19,221
California:
$23,505
(% of AGI for various income ranges: 22.5% for AGIs below $25k, 60.4% for AGIs $25k-50k, 136.6% for AGIs $50k-75k, 215.0% for AGIs $75k-100k, 407.2% for AGIs $100k-200k, 1764.5% for AGIs over 200k)
Self-employed (Keogh) retirement plans: $24,325 (reported on 1.4% of returns)
94704:
$24,325
California:
$30,163
(% of AGI for various income ranges: 245.0% for AGIs $75k-100k, 1190.0% for AGIs over 200k)
Total itemized deductions: $37,512 (reported on 8.3% of returns)
Here:
$37,512
State:
$39,517
(% of AGI for various income ranges: 35.8% for AGIs below $25k, 130.4% for AGIs $25k-50k, 298.7% for AGIs $50k-75k, 501.2% for AGIs $75k-100k, 1224.1% for AGIs $100k-200k, 8682.7% for AGIs over 200k)
Charity contributions: $15,435 (reported on 6.9% of returns)
Here:
$15,435
State:
$12,598
(% of AGI for various income ranges: 18.6% for AGIs $25k-50k, 50.0% for AGIs $50k-75k, 149.2% for AGIs $75k-100k, 374.7% for AGIs $100k-200k, 3785.5% for AGIs over 200k)
Taxes paid: $8,556 (reported on 8.3% of returns)
94704:
$8,556
State:
$8,807
(% of AGI for various income ranges: 8.3% for AGIs below $25k, 29.2% for AGIs $25k-50k, 72.8% for AGIs $50k-75k, 162.7% for AGIs $75k-100k, 389.4% for AGIs $100k-200k, 1525.5% for AGIs over 200k)
Earned income credit: $1,038 (reported on 9.2% of returns)
Here:
$1,038
State:
$2,074
(% of AGI for various income ranges: 25.0% for AGIs below $25k, 20.0% for AGIs $25k-50k)
Percentage of individuals using paid preparers for their 2020 taxes: 91.5%
Here:
92%
State:
92%
(% for various income ranges: 89.5% for AGIs below $25k, 92.2% for AGIs $25k-50k, 92.5% for AGIs $50k-75k, 91.1% for AGIs $75k-100k, 93.8% for AGIs $100k-200k, 95.0% for AGIs over 200k)
Averages for the 2012 tax year for zip code 94704, filed in 2013:
Average Adjusted Gross Income (AGI) in 2012: $53,224 (Individual Income Tax Returns)
Here:
$53,224
State:
$72,726
Salary/wage: $43,771 (reported on 84.0% of returns)
Here:
$43,771
State:
$59,079
(% of AGI for various income ranges: 83.1% for AGIs below $25k, 83.2% for AGIs $25k-50k, 79.2% for AGIs $50k-75k, 77.3% for AGIs $75k-100k, 72.7% for AGIs $100k-200k, 47.1% for AGIs over 200k)
Taxable interest for individuals: $1,360 (reported on 35.7% of returns)
This zip code:
$1,360
California:
$2,146
(% of AGI for various income ranges: 0.9% for AGIs below $25k, 0.7% for AGIs $25k-50k, 0.5% for AGIs $50k-75k, 1.1% for AGIs $75k-100k, 1.3% for AGIs $100k-200k, 0.8% for AGIs over 200k)
Ordinary dividends: $6,108 (reported on 24.1% of returns)
Here:
$6,108
State:
$9,308
(% of AGI for various income ranges: 2.7% for AGIs below $25k, 1.8% for AGIs $25k-50k, 1.7% for AGIs $50k-75k, 2.3% for AGIs $75k-100k, 3.7% for AGIs $100k-200k, 3.3% for AGIs over 200k)
Net capital gain/loss in AGI: +$22,680 (reported on 20.4% of returns)
Here:
+$22,680
State:
+$30,460
(% of AGI for various income ranges: 0.4% for AGIs below $25k, 0.9% for AGIs $25k-50k, 1.0% for AGIs $50k-75k, 1.0% for AGIs $75k-100k, 2.0% for AGIs $100k-200k, 26.2% for AGIs over 200k)
Profit/loss from business: +$15,804 (reported on 18.9% of returns)
Here:
+$15,804
State:
+$17,064
(% of AGI for various income ranges: 10.1% for AGIs below $25k, 6.1% for AGIs $25k-50k, 4.7% for AGIs $50k-75k, 6.0% for AGIs $75k-100k, 5.9% for AGIs $100k-200k, 4.0% for AGIs over 200k)
Taxable individual retirement arrangement distribution: $18,379 (reported on 5.3% of returns)
94704:
$18,379
California:
$19,557
(% of AGI for various income ranges: 1.2% for AGIs below $25k, 1.1% for AGIs $25k-50k, 1.3% for AGIs $50k-75k, 2.5% for AGIs $75k-100k, 2.2% for AGIs $100k-200k, 2.2% for AGIs over 200k)
Self-employment retirement plans: $15,438 (reported on 1.5% of returns)
94704:
$15,438
California:
$24,530
(% of AGI for various income ranges: 0.5% for AGIs $25k-50k, 1.9% for AGIs $75k-100k, 0.5% for AGIs over 200k)
Total itemized deductions: $29,597 (20% of AGI, reported on 20.6% of returns)
Here:
$29,597
State:
$34,004
Here:
19.8% of AGI
State:
22.7% of AGI
(% of AGI for various income ranges: 6.1% for AGIs below $25k, 4.2% for AGIs $25k-50k, 8.8% for AGIs $50k-75k, 11.9% for AGIs $75k-100k, 15.3% for AGIs $100k-200k, 15.5% for AGIs over 200k)
Charity contributions: $4,082 (reported on 15.4% of returns)
Here:
$4,082
State:
$4,659
(% of AGI for various income ranges: 0.5% for AGIs below $25k, 0.4% for AGIs $25k-50k, 1.0% for AGIs $50k-75k, 1.1% for AGIs $75k-100k, 1.7% for AGIs $100k-200k, 1.7% for AGIs over 200k)
Taxes paid: $15,068 (reported on 20.6% of returns)
94704:
$15,068
State:
$14,448
(% of AGI for various income ranges: 1.5% for AGIs below $25k, 1.3% for AGIs $25k-50k, 2.8% for AGIs $50k-75k, 5.7% for AGIs $75k-100k, 7.5% for AGIs $100k-200k, 10.0% for AGIs over 200k)
Earned income credit: $1,059 (reported on 10.3% of returns)
Here:
$1,059
State:
$2,286
(% of AGI for various income ranges: 1.7% for AGIs below $25k, 0.2% for AGIs $25k-50k)
Percentage of individuals using paid preparers for their 2012 taxes: 33.3%
Here:
33%
State:
64%
(% for various income ranges: 27.8% for AGIs below $25k, 28.8% for AGIs $25k-50k, 38.3% for AGIs $50k-75k, 47.1% for AGIs $75k-100k, 48.9% for AGIs $100k-200k, 61.1% for AGIs over 200k)
Averages for the 2004 tax year for zip code 94704, filed in 2005:
Average Adjusted Gross Income (AGI) in 2004: $37,483 (Individual Income Tax Returns)
Here:
$37,483
State:
$58,600
Salary/wage: $32,386 (reported on 84.1% of returns)
Here:
$32,386
State:
$49,455
(% of AGI for various income ranges: 230.9% for AGIs below $10k, 82.2% for AGIs $10k-25k, 83.9% for AGIs $25k-50k, 84.8% for AGIs $50k-75k, 81.4% for AGIs $75k-100k, 48.7% for AGIs over 100k)
Taxable interest for individuals: $1,210 (reported on 42.4% of returns)
This zip code:
$1,210
California:
$2,365
(% of AGI for various income ranges: 9.5% for AGIs below $10k, 1.5% for AGIs $10k-25k, 1.1% for AGIs $25k-50k, 1.4% for AGIs $50k-75k, 1.2% for AGIs $75k-100k, 1.2% for AGIs over 100k)
Taxable dividends: $3,914 (reported on 25.0% of returns)
Here:
$3,914
State:
$4,746
(% of AGI for various income ranges: 10.5% for AGIs below $10k, 1.8% for AGIs $10k-25k, 1.3% for AGIs $25k-50k, 1.7% for AGIs $50k-75k, 2.0% for AGIs $75k-100k, 4.0% for AGIs over 100k)
Net capital gain/loss: +$14,062 (reported on 20.7% of returns)
Here:
+$14,062
State:
+$23,418
(% of AGI for various income ranges: -5.3% for AGIs below $10k, 0.9% for AGIs $10k-25k, 0.9% for AGIs $25k-50k, 0.9% for AGIs $50k-75k, 1.7% for AGIs $75k-100k, 19.7% for AGIs over 100k)
Profit/loss from business: +$17,881 (reported on 17.1% of returns)
Here:
+$17,881
State:
+$16,826
(% of AGI for various income ranges: 16.4% for AGIs below $10k, 8.4% for AGIs $10k-25k, 6.9% for AGIs $25k-50k, 5.0% for AGIs $50k-75k, 4.9% for AGIs $75k-100k, 11.0% for AGIs over 100k)
IRA payment deduction: $2,978 (reported on 3.4% of returns)
94704:
$2,978
California:
$3,192
(% of AGI for various income ranges: 0.9% for AGIs below $10k, 0.4% for AGIs $10k-25k, 0.5% for AGIs $25k-50k, 0.2% for AGIs $50k-75k, 0.2% for AGIs $75k-100k, 0.1% for AGIs over 100k)
Self-employed pension: $14,906 (reported on 2.0% of returns)
Here:
$14,906
California:
$17,688
(% of AGI for various income ranges: 0.4% for AGIs $25k-50k, 0.5% for AGIs $50k-75k, 0.6% for AGIs $75k-100k, 1.5% for AGIs over 100k)
Total itemized deductions: $19,785 (21% of AGI, reported on 20.3% of returns)
Here:
$19,785
State:
$28,113
Here:
20.7% of AGI
State:
25.3% of AGI
(% of AGI for various income ranges: 16.7% for AGIs below $10k, 5.3% for AGIs $10k-25k, 6.9% for AGIs $25k-50k, 9.0% for AGIs $50k-75k, 14.8% for AGIs $75k-100k, 14.2% for AGIs over 100k)
Charity contributions deductions: $3,219 (3% of AGI, reported on 14.7% of returns)
Here:
$3,219
State:
$3,923
Here:
2.8% of AGI
State:
3.3% of AGI
(% of AGI for various income ranges: 0.8% for AGIs below $10k, 0.5% for AGIs $10k-25k, 0.5% for AGIs $25k-50k, 1.1% for AGIs $50k-75k, 1.8% for AGIs $75k-100k, 1.9% for AGIs over 100k)
Total tax: $6,908 (reported on 74.7% of returns)
94704:
$6,908
State:
$10,761
(% of AGI for various income ranges: 7.3% for AGIs below $10k, 6.0% for AGIs $10k-25k, 10.1% for AGIs $25k-50k, 13.4% for AGIs $50k-75k, 14.3% for AGIs $75k-100k, 18.9% for AGIs over 100k)
Earned income credit: $767 (reported on 8.1% of returns)
Here:
$767
State:
$1,763
Percentage of individuals using paid preparers for their 2004 taxes: 32.3%
Here:
32%
State:
66%
(% for various income ranges: 25.7% for AGIs below $10k, 27.6% for AGIs $10k-25k, 33.5% for AGIs $25k-50k, 37.3% for AGIs $50k-75k, 45.7% for AGIs $75k-100k, 62.3% for AGIs over 100k)
Likely homosexual households (counted as self-reported same-sex unmarried-partner households)
Lesbian couples: 0.2% of all households
Gay men: 0.3% of all households
Household received Food Stamps/SNAP in the past 12 months: 1,084 Household did not receive Food Stamps/SNAP in the past 12 months: 7,221
Women who had a birth in the past 12 months: 23 (7 now married, 16 unmarried) Women who did not have a birth in the past 12 months: 11,943 (931 now married, 11,170 unmarried)
Housing units in zip code 94704 with a mortgage: 635 (137 second mortgage, 142 both second mortgage and home equity loan) Median monthly owner costs for units with a mortgage: $3,876 Median monthly owner costs for units without a mortgage: $929
Residents with income below the poverty level in 2022:
This zip code:
48.9%
Whole state:
12.2%
Residents with income below 50% of the poverty level in 2022:
This zip code:
8.7%
Whole state:
6.2%
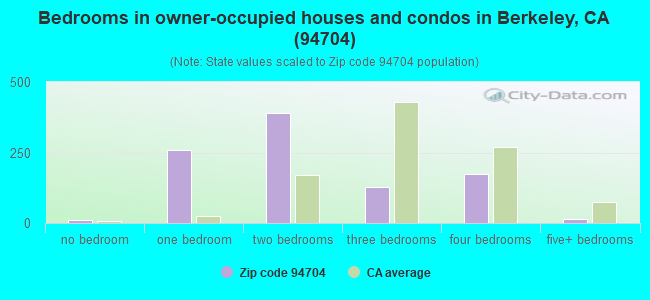
Median number of rooms in houses and condos:
Here:
5.1
State:
6.0
Median number of rooms in apartments:
Here:
3.0
State:
3.9
Notable locations in this zip code not listed on our city pages
Notable locations in zip code 94704: Berkeley Bay Area Rapid Transit Station (A), Berkeley Fire Department Station 2 (B), Berkeley Public Library (C), Berkeley City Club (D), University Hall (E), University Art Museum (F), Tang Center (G), Spens-Black Hall (H), Putnam Hall (I), Priestley Hall (J), Norton Hall (K), Jones Child Study Center (L), Ida Sproul Hall (M), Griffiths Hall (N), Freeborn Hall (O), Ehrman Hall (P), Deutsch Hall (Q), Davidson Hall (R), Cunningham Hall (S), Cheney Hall (T). Display/hide their locations on the map
Churches in zip code 94704 include: Vedanta Society Church (A), University Lutheran Chapel (B), Russian Orthodox Memorial Church (C), Free Church (D), First Baptist Church (E), Durant Avenue United Presbyterian Church (F), Deliverance Temple Church (G), Newman Center (H), First Church of Christ Scientist (I). Display/hide their locations on the map
535 married couples with children.
407 single-parent households (105 men, 302 women).
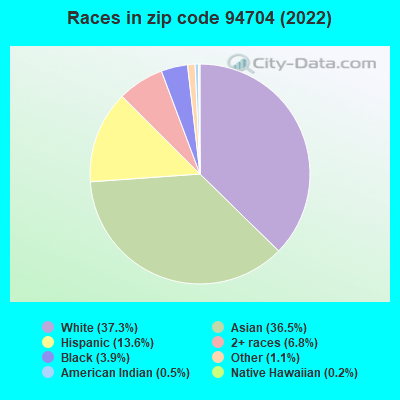
57.0% of residents of 94704 zip code speak English at home.
8.8% of residents speak Spanish at home (92% very well, 4% well, 3% not well, 1% not at all).
10.2% of residents speak other Indo-European language at home (93% very well, 5% well, 1% not well).
22.0% of residents speak Asian or Pacific Island language at home (77% very well, 20% well, 2% not well).
1.4% of residents speak other language at home (86% very well, 12% well, 2% not well).
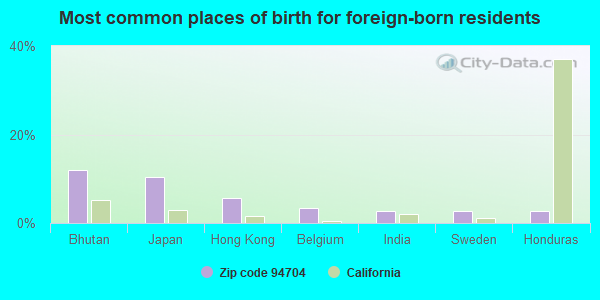
Foreign born population: 6,895 (27.0%) (31.5% of them are naturalized citizens)
Facilities with environmental interests located in this zip code:
JIM DOTEN FIDELITY MOTORS (2600 SHATTUCK AVE in BERKELEY, CA)
STATE MASTER (California - Hazardous Waste Tracking) - HAZARDOU WASTE PROGRAM Small Quantity Generators, between 100 kg and 1000 kg of hazardous waste/month (Resource Conservation and Recovery Act (tracking hazardous waste)) - notification STATE MASTER (California - Used Oil Recycling System ) - USED OIL RECYCLING Organizations: BERKELEY HONDA TIM BEINKE (CONTACT/OPERATOR)
, BERKELEY AUTO GROUP LLC (CONTACT/OWNER)
Alternative names: FIDELITY MOTORS INC DBA J DOTEN'S HONDA, JIM DOTEN S HONDA
FLAMINGO CLEANERS (1935 MARTIN LUTHER KING JUNIOR in BERKELEY, CA)
STATE MASTER (California - Hazardous Waste Tracking) - HAZARDOU WASTE PROGRAM CRITERIA AND HAZARDOUS AIR POLLUTANT INVENTORY (Inventory of air pollution sources) Small Quantity Generators, between 100 kg and 1000 kg of hazardous waste/month (Resource Conservation and Recovery Act (tracking hazardous waste)) - notification Business SIC classification: DRYCLEANING PLANTS, EXCEPT RUG CLEANING Organizations: BHUK HAN MANGNDRN (CONTACT/OWNER)
HUSTEADS COLLISION CENTER (2037 DUANT AVENUE in BERKELEY, CA)
STATE MASTER (California - Hazardous Waste Tracking) - HAZARDOU WASTE PROGRAM CRITERIA AND HAZARDOUS AIR POLLUTANT INVENTORY (Inventory of air pollution sources) Small Quantity Generators, between 100 kg and 1000 kg of hazardous waste/month (Resource Conservation and Recovery Act (tracking hazardous waste)) - notification Business SIC classification: TOP, BODY, AND UPHOLSTERY REPAIR SHOPS AND PAINT SHOPS Organizations: JONG KU YI (CONTACT/OWNER)
Alternative names: HUSTEADS INC
ALTA BATES MEDICAL CENTER (2001 DWIGHT WY in BERKELEY, CA) . Federal Facility
STATE MASTER (California - Hazardous Waste Tracking) - HAZARDOU WASTE PROGRAM Small Quantity Generators, between 100 kg and 1000 kg of hazardous waste/month (Resource Conservation and Recovery Act (tracking hazardous waste)) - notification Business NAICS classification: OFFICES OF PHYSICIANS, MENTAL HEALTH SPECIALISTS. Organizations: HOSPITAL NON PROFIT (CONTACT/OWNER)
Alternative names: HERRICK HOSPITAL & HEALTH CENTER
HIGHWAY DIESEL SUPPLIES CORP (2491 ELLSWORTH ST in BERKELEY, CA)
MODEL GARAGE INC THE (2170 DWIGHT WAY in BERKELEY, CA)
Small Quantity Generators, between 100 kg and 1000 kg of hazardous waste/month (Resource Conservation and Recovery Act (tracking hazardous waste)) Organizations: WORTH DONALD & EDINOFF PETER (CONTACT/OWNER)
CA DOHS (2151 BERKELEY WAY in BERKELEY, CA)
CRITERIA AND HAZARDOUS AIR POLLUTANT INVENTORY (Inventory of air pollution sources) Small Quantity Generators, between 100 kg and 1000 kg of hazardous waste/month (Resource Conservation and Recovery Act (tracking hazardous waste)) Business SIC classification: ADMINISTRATION OF PUBLIC HEALTH PROGRAMS Alternative names: CALIFORNIA STATE, DOHS, SITE ID 060010001, STATE OF CALIFORNIA DEPT OF HE
MAGGINI CHEVROLET (2140 DURANT AVE in BERKELEY, CA)
Small Quantity Generators, between 100 kg and 1000 kg of hazardous waste/month (Resource Conservation and Recovery Act (tracking hazardous waste))
AMERICAN BAPTIST SEMINARY/OF THE WEST (2606 DWIGHT WAY in BERKELEY, CA)
COMPLIANCE ACTIVITY (Tracking inspections of insecticide, fungicide, and rodenticide, and toxic substances)
BANCROFT NURSERY SCHOOL (2398 BANCROFT WAY in BERKELEY, CA)
COMPLIANCE ACTIVITY (Tracking inspections of insecticide, fungicide, and rodenticide, and toxic substances)
MOUNTAIN MIDDLE SCHOOL (2330 DURANT AVE in BERKELEY, CA)
COMPLIANCE ACTIVITY (Tracking inspections of insecticide, fungicide, and rodenticide, and toxic substances)
CAL CLEANERS & LAUNDRY (2531 TELEGRAPH AVE in BERKELEY, CA)
CRITERIA AND HAZARDOUS AIR POLLUTANT INVENTORY (Inventory of air pollution sources) Business SIC classification: DRYCLEANING PLANTS, EXCEPT RUG CLEANING
Housing units lacking complete plumbing facilities: 2.9% Housing units lacking complete kitchen facilities: 4.2%
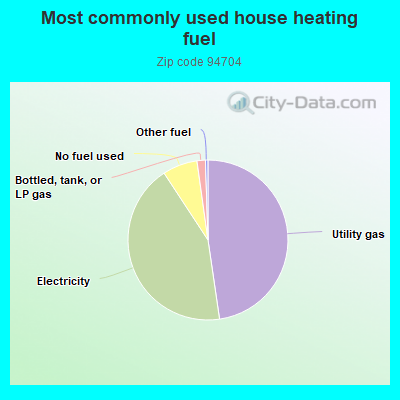
47.5%Utility gas
42.9%Electricity
7.0%No fuel used
1.7%Bottled, tank, or LP gas
0.5%Other fuel
Population in 1990: 23,551.
Place of birth for U.S.-born residents:
This state: 12,964
Northeast: 1,408
Midwest: 1,171
South: 1,449
West: 1,097
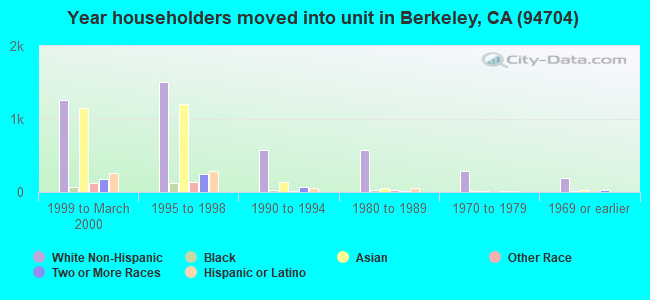
23% of the 94704 zip code residents lived in the same house 5 years ago. Out of people who lived in different houses, 19% lived in this county. Out of people who lived in different counties, 50% lived in California.
72% of the 94704 zip code residents lived in the same house 1 year ago. Out of people who lived in different houses, 28% moved from this county. Out of people who lived in different houses, 29% moved from different county within same state. Out of people who lived in different houses, 21% moved from different state. Out of people who lived in different houses, 24% moved from abroad.
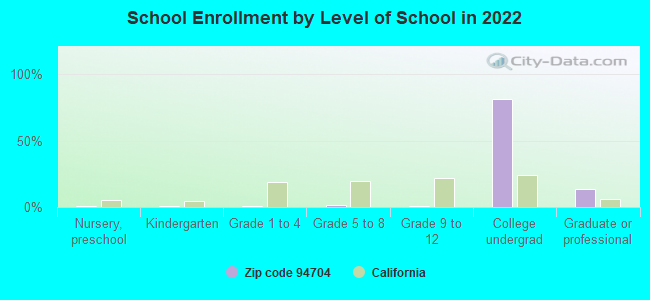
Private vs. public school enrollment:
Students in private schools in grades 1 to 8 (elementary and middle school): 111
Here:
28.3%
California:
10.5%
Students in private schools in grades 9 to 12 (high school):
Here:
0.0%
California:
8.5%
Students in private undergraduate colleges: 410
Here:
3.1%
California:
15.9%
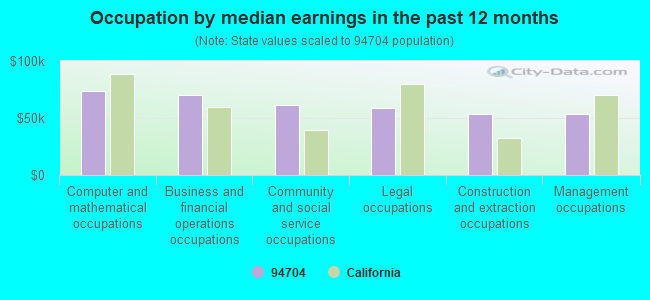
Occupation by median earnings in the past 12 months ($)
74,003Computer and mathematical occupations
69,738Business and financial operations occupations
61,569Community and social service occupations
58,583Legal occupations
53,645Construction and extraction occupations
53,509Management occupations
Companies with federal contracts located in this zip code (BERKELEY, CA):
PACIFIC INSTITUTE FOR RESEARCH (1995 UNIVERSITY AVENUE SUI)
$3,302,086 with Navy for Other Social Services. Signed on 2003-10-01. Completion date: 2004-09-30.
EARTH TECH INC (2030 ADDISON ST STE 500) : $1,187,303 in 3 contractsin 2001
$528,315 with Army for Industrial Investigations, Surveys and Technical Support for Multiple Pollutants. Signed on 2001-04-19. Completion date: 2002-04-13.
$419,286, same as above.Signed on 2001-04-23. Completion date: 2002-04-22.
$239,702, same as above.Signed on 2001-04-19. Completion date: 2002-04-13.
INTEGRATED MICRO INSTRUMENTS I (2140 SHATTUCK AVE; small business) : $946,760 in 3 contractsfrom 2000 to 2002
$526,000 with Army for Other Defense -- Applied Research and Exploratory Development (R&D). Signed on 2000-01-06. Completion date: 2002-10-30.
$278,704, same as above.Signed on 2000-10-31. Completion date: 2002-10-30.
$142,056, same as above.Signed on 2002-04-26. Completion date: 2002-10-30.
SYSTEMS MICRO TECHNOLOGIES (2614 WARRINGS ST SUITE #3; small business) : $749,907 in 3 contractsfrom 2003 to 2006
$350,000 with Navy for Defense Electronics and Communication Equipment -- Applied Research and Exploratory Development (R&D). Signed on 2003-09-03. Completion date: 2005-09-30.
$252,982, same as above.Signed on 2005-08-10. Completion date: 2006-09-30.
$146,925, same as above.Signed on 2006-01-13. Completion date: 2006-09-30.
IRIS AO INC (2680 BANCROFT WAY; small business) : $691,191 in 5 contractsfrom 2004 to 2006
Contracts for Other Research and Development -- Management and Support (R&D), Other Defense -- Basic Research (R&D), Aeronautics and Space Technology -- Basic Research (R&D), Semiconductor Devices and Associated Hardware by Air Force, NASA Signed by year:2000: $0; 2001: $0; 2002: $0; 2003: $0; 2004: $99,967; 2005: $410,125; 2006: $181,099.
Biggest contracts:
$375,000 with Air Force for Other Research and Development -- Management and Support (R&D). Signed on 2005-07-11. Completion date: 2007-06-30.
$111,101, same as above.Signed on 2006-02-13. Completion date: 2007-06-30.
$99,967 with Air Force for Other Defense -- Basic Research (R&D). Signed on 2004-05-26. Completion date: 2005-02-28.
$69,998 with NASA for Aeronautics and Space Technology -- Basic Research (R&D). Signed on 2006-01-25. Effective on 2006-01-23. Completion date: 2006-07-24.
LYRIS TECHNOLOGIES, INC (2070 ALLSTON WAY STE 200; small business) : $146,185 in 21 contractsfrom 2003 to 2006
Contracts for ADP Software, Communications Services, Automated News Services, Data Services, or Other Information Services. Buying data, the electronic equivalent of books, periodicals, newspapers, etc., Other ADP and Telecommunications Services (includes data storage on tapes, compact disks, etc.), and moreby Office of the Comptroller of the Currency, Bureau of Land Management, EXECUTIVE OFFICE OF THE PRESIDENT, Consumer Product Safety Commission, and others Signed by year:2000: $0; 2001: $0; 2002: $0; 2003: $18,000; 2004: $25,850; 2005: $50,103; 2006: $52,232.
Biggest contracts:
$24,600 with Office of the Comptroller of the Currency for ADP Software. Taking place in DC. Signed on 2006-02-27. Completion date: 2007-02-26.
$18,000 with Bureau of Land Management for Communications Services. Signed on 2005-10-01. Completion date: 2006-09-30.
$18,000, same as above.Signed on 2004-10-01. Completion date: 2005-09-30.
$18,000, same as above.Signed on 2003-10-01. Completion date: 2004-09-30.
WESTERN CONSORTIUM FOR PUBLIC (2001 ADDISON STREE, 2ND FLOOR) : $102,241 in 2 contractsfrom 2001 to 2003
$140,000 with National Institutes of Health for Biomedical -- Basic Research (R&D). Signed on 2001-04-15. Completion date: 2001-09-15.
-$37,759, same as above.Signed on 2003-09-30. Completion date: 2003-09-30.
H2VOLT, INC (1995 UNIVERSITY AVE REAR; small business)
$69,380 with Navy for Other Defense -- Basic Research (R&D). Signed on 2005-11-03. Completion date: 2006-05-20.
COOLSYSTEMS, INC (2201 DWIGHT WAY; small business) : $44,953 in 4 contractsfrom 2005 to 2006
$15,531 with Department of Defense for Hospital Furniture, Equipment, Utensils, and Supplies. Signed on 2005-04-12. Completion date: 2005-06-30.
$14,121 with Air Force for Medical and Surgical Instruments, Equipment, and Supplies. Signed on 2006-01-17. Completion date: 2006-02-03.
$10,746 with Air Force for Medical and Surgical Instruments, Equipment, and Supplies. Taking place in CO. Signed on 2006-06-12. Completion date: 2006-07-12.
$4,555 with U.S. Special Operations Command for Hospital Furniture, Equipment, Utensils, and Supplies. Signed on 2005-12-13. Completion date: 2005-12-22.
UC BERKELEY EXTENSION (1995 UNIVERSITY AVENUE)
$4,944 with Navy for Tuition, Registration, and Membership Fees. Signed on 2001-09-12. Completion date: 2001-09-12.
Top industries in this zip code by the number of employees in 2005:
Health Care and Social Assistance: Psychiatric and Substance Abuse Hospitals (500-999 employees: 1 establishment)
Health Care and Social Assistance: Other Individual and Family Services (250-499: 1, 20-49: 1, 10-19: 1, 5-9: 2, 1-4: 1)
Accommodation and Food Services: Snack and Nonalcoholic Beverage Bars (20-49: 5, 10-19: 9, 5-9: 1, 1-4: 10)
Other Services (except Public Administration): Religious Organizations (50-99: 1, 20-49: 2, 10-19: 3, 5-9: 7, 1-4: 11)
Professional, Scientific, and Technical Services: Research and Development in the Physical, Engineering, and Life Sciences (50-99: 2, 20-49: 2, 10-19: 1, 5-9: 3, 1-4: 3)
Professional, Scientific, and Technical Services: Administrative Management and General Management Consulting Services (100-249: 1, 10-19: 1, 5-9: 2, 1-4: 3)
People in group quarters in 2010:
6,192 people in college/university student housing
516 people in other noninstitutional facilities
110 people in emergency and transitional shelters (with sleeping facilities) for people experiencing homelessness
67 people in nursing facilities/skilled-nursing facilities
24 people in hospitals with patients who have no usual home elsewhere
15 people in local jails and other municipal confinement facilities
5 people in in-patient hospice facilities
3 people in workers' group living quarters and job corps centers
People in group quarters in 2000:
3,903 people in college dormitories (includes college quarters off campus)
348 people in other noninstitutional group quarters
52 people in wards in general hospitals for patients who have no usual home elsewhere
50 people in nursing homes
50 people in other nonhousehold living situations
25 people in other group homes
15 people in homes or halfway houses for drug/alcohol abuse
11 people in religious group quarters
Fatal accident statistics in 2014:
Fatal accident count: 1
Vehicles involved in fatal accidents: 2
Fatal accidents caused by drunken drivers: 0
Fatalities: 1
Persons involved in fatal accidents: 2
Pedestrians involved in fatal accidents: 0
Home Mortgage Disclosure Act Aggregated Statistics For Year 2009 (Based on 3 full and 14 partial tracts)
A) FHA, FSA/RHS & VA Home Purchase Loans
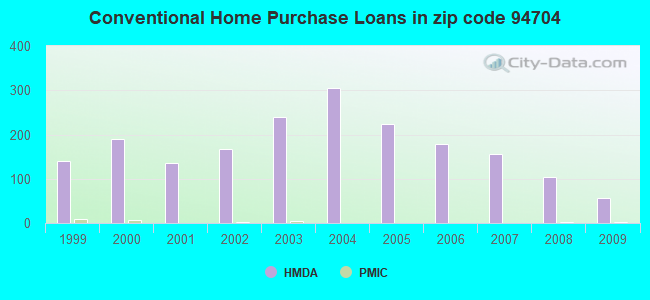
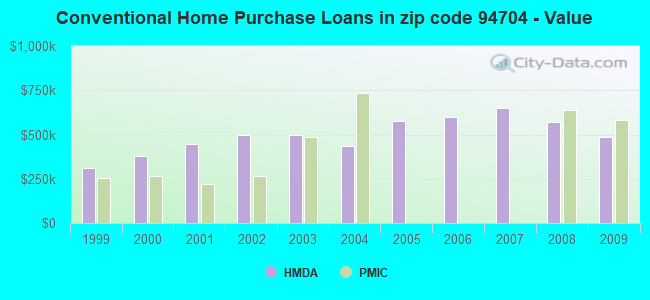
B) Conventional Home Purchase Loans
C) Refinancings
D) Home Improvement Loans
E) Loans on Dwellings For 5+ Families
F) Non-occupant Loans on < 5 Family Dwellings (A B C & D)
Number
Average Value
Number
Average Value
Number
Average Value
Number
Average Value
Number
Average Value
Number
Average Value
LOANS ORIGINATED
1
$848,010
56
$486,683
438
$438,706
11
$421,167
17
$3,255,154
37
$393,179
APPLICATIONS APPROVED, NOT ACCEPTED
2
$782,810
13
$528,898
48
$493,572
2
$178,905
0
$0
6
$355,535
APPLICATIONS DENIED
1
$507,830
18
$468,559
143
$479,494
9
$247,710
2
$1,395,000
27
$376,835
APPLICATIONS WITHDRAWN
0
$0
12
$551,205
77
$443,665
1
$189,980
0
$0
10
$390,123
FILES CLOSED FOR INCOMPLETENESS
0
$0
3
$687,537
18
$376,682
1
$213,340
0
$0
1
$507,210
Aggregated Statistics For Year 2008 (Based on 3 full and 14 partial tracts)
A) FHA, FSA/RHS & VA Home Purchase Loans
B) Conventional Home Purchase Loans
C) Refinancings
D) Home Improvement Loans
E) Loans on Dwellings For 5+ Families
F) Non-occupant Loans on < 5 Family Dwellings (A B C & D)
Number
Average Value
Number
Average Value
Number
Average Value
Number
Average Value
Number
Average Value
Number
Average Value
LOANS ORIGINATED
1
$412,510
104
$570,983
154
$477,172
9
$290,019
22
$1,527,492
41
$437,357
APPLICATIONS APPROVED, NOT ACCEPTED
0
$0
26
$576,587
35
$414,004
1
$33,360
0
$0
7
$523,553
APPLICATIONS DENIED
0
$0
36
$618,442
69
$613,632
11
$269,045
5
$1,205,412
10
$658,052
APPLICATIONS WITHDRAWN
1
$228,000
21
$550,497
42
$468,141
5
$210,720
2
$2,588,850
13
$495,870
FILES CLOSED FOR INCOMPLETENESS
0
$0
1
$853,790
12
$546,014
3
$399,357
1
$1,117,410
2
$363,435
Aggregated Statistics For Year 2007 (Based on 3 full and 14 partial tracts)
B) Conventional Home Purchase Loans
C) Refinancings
D) Home Improvement Loans
E) Loans on Dwellings For 5+ Families
F) Non-occupant Loans on < 5 Family Dwellings (A B C & D)
Number
Average Value
Number
Average Value
Number
Average Value
Number
Average Value
Number
Average Value
LOANS ORIGINATED
157
$648,021
217
$568,546
26
$277,485
45
$1,526,510
91
$481,452
APPLICATIONS APPROVED, NOT ACCEPTED
25
$668,972
70
$568,691
10
$398,772
0
$0
15
$478,839
APPLICATIONS DENIED
35
$956,846
100
$713,940
12
$319,198
3
$735,900
40
$523,277
APPLICATIONS WITHDRAWN
24
$659,020
37
$490,489
9
$378,572
2
$418,715
12
$413,715
FILES CLOSED FOR INCOMPLETENESS
7
$493,884
12
$817,498
1
$72,860
0
$0
3
$641,013
Aggregated Statistics For Year 2006 (Based on 3 full and 14 partial tracts)
B) Conventional Home Purchase Loans
C) Refinancings
D) Home Improvement Loans
E) Loans on Dwellings For 5+ Families
F) Non-occupant Loans on < 5 Family Dwellings (A B C & D)
Number
Average Value
Number
Average Value
Number
Average Value
Number
Average Value
Number
Average Value
LOANS ORIGINATED
178
$598,993
230
$551,034
21
$390,487
52
$1,830,103
60
$516,842
APPLICATIONS APPROVED, NOT ACCEPTED
44
$519,545
51
$544,347
6
$755,938
1
$15,850,000
23
$600,750
APPLICATIONS DENIED
44
$668,169
111
$564,161
18
$447,719
2
$627,940
29
$561,588
APPLICATIONS WITHDRAWN
25
$606,894
72
$509,249
8
$208,430
0
$0
10
$460,524
FILES CLOSED FOR INCOMPLETENESS
5
$514,524
23
$745,565
3
$1,058,020
0
$0
2
$487,650
Aggregated Statistics For Year 2005 (Based on 3 full and 14 partial tracts)
B) Conventional Home Purchase Loans
C) Refinancings
D) Home Improvement Loans
E) Loans on Dwellings For 5+ Families
F) Non-occupant Loans on < 5 Family Dwellings (A B C & D)
Number
Average Value
Number
Average Value
Number
Average Value
Number
Average Value
Number
Average Value
LOANS ORIGINATED
224
$575,328
340
$542,124
38
$463,419
37
$1,519,123
110
$460,011
APPLICATIONS APPROVED, NOT ACCEPTED
40
$678,986
60
$549,250
2
$279,240
2
$1,161,500
18
$483,396
APPLICATIONS DENIED
57
$527,716
101
$597,349
21
$392,981
1
$1,142,660
24
$437,238
APPLICATIONS WITHDRAWN
23
$442,459
88
$522,010
8
$392,464
1
$1,036,000
13
$503,310
FILES CLOSED FOR INCOMPLETENESS
11
$523,634
25
$519,082
1
$643,440
1
$300,000
3
$384,433
Aggregated Statistics For Year 2004 (Based on 3 full and 14 partial tracts)
B) Conventional Home Purchase Loans
C) Refinancings
D) Home Improvement Loans
E) Loans on Dwellings For 5+ Families
F) Non-occupant Loans on < 5 Family Dwellings (A B C & D)
G) Loans On Manufactured Home Dwelling (A B C & D)
Number
Average Value
Number
Average Value
Number
Average Value
Number
Average Value
Number
Average Value
Number
Average Value
LOANS ORIGINATED
305
$437,365
734
$423,365
31
$388,013
47
$2,436,574
106
$425,314
44
$88,090
APPLICATIONS APPROVED, NOT ACCEPTED
83
$270,340
105
$363,154
3
$592,403
5
$738,382
22
$365,940
73
$91,728
APPLICATIONS DENIED
97
$297,826
163
$423,396
12
$251,402
3
$1,179,553
31
$436,106
78
$89,522
APPLICATIONS WITHDRAWN
53
$458,447
138
$420,644
7
$481,751
5
$1,070,910
16
$417,289
0
$0
FILES CLOSED FOR INCOMPLETENESS
2
$542,920
26
$402,704
0
$0
0
$0
4
$407,870
0
$0
Aggregated Statistics For Year 2003 (Based on 3 full and 14 partial tracts)
B) Conventional Home Purchase Loans
C) Refinancings
D) Home Improvement Loans
E) Loans on Dwellings For 5+ Families
F) Non-occupant Loans on < 5 Family Dwellings (A B C & D)
Number
Average Value
Number
Average Value
Number
Average Value
Number
Average Value
Number
Average Value
LOANS ORIGINATED
239
$498,908
1,353
$358,295
16
$87,590
68
$1,350,894
165
$312,751
APPLICATIONS APPROVED, NOT ACCEPTED
34
$413,041
142
$367,810
1
$217,470
5
$655,832
17
$313,060
APPLICATIONS DENIED
27
$550,887
169
$374,404
4
$202,948
2
$1,704,000
27
$307,802
APPLICATIONS WITHDRAWN
39
$380,125
236
$327,064
1
$40,850
1
$122,780
24
$275,810
FILES CLOSED FOR INCOMPLETENESS
3
$451,787
48
$322,701
1
$36,430
1
$312,080
6
$325,452
Aggregated Statistics For Year 2002 (Based on 3 full and 12 partial tracts)
B) Conventional Home Purchase Loans
C) Refinancings
D) Home Improvement Loans
E) Loans on Dwellings For 5+ Families
F) Non-occupant Loans on < 5 Family Dwellings (A B C & D)
Number
Average Value
Number
Average Value
Number
Average Value
Number
Average Value
Number
Average Value
LOANS ORIGINATED
167
$495,349
784
$388,370
10
$68,648
19
$1,568,731
83
$325,406
APPLICATIONS APPROVED, NOT ACCEPTED
25
$533,116
109
$397,017
3
$99,483
1
$383,700
13
$450,245
APPLICATIONS DENIED
20
$596,246
115
$377,122
4
$53,668
5
$527,490
21
$327,556
APPLICATIONS WITHDRAWN
23
$386,557
106
$376,202
3
$23,277
1
$532,060
11
$466,905
FILES CLOSED FOR INCOMPLETENESS
4
$587,642
33
$478,445
0
$0
1
$2,250,000
2
$220,840
Aggregated Statistics For Year 2001 (Based on 3 full and 10 partial tracts)
B) Conventional Home Purchase Loans
C) Refinancings
D) Home Improvement Loans
E) Loans on Dwellings For 5+ Families
F) Non-occupant Loans on < 5 Family Dwellings (A B C & D)
Number
Average Value
Number
Average Value
Number
Average Value
Number
Average Value
Number
Average Value
LOANS ORIGINATED
136
$445,737
446
$391,972
27
$77,280
21
$1,258,862
41
$246,201
APPLICATIONS APPROVED, NOT ACCEPTED
20
$371,170
60
$389,926
8
$95,684
0
$0
7
$305,157
APPLICATIONS DENIED
24
$394,436
101
$398,284
11
$68,508
8
$921,555
18
$208,085
APPLICATIONS WITHDRAWN
18
$396,927
69
$347,125
3
$37,980
2
$374,590
2
$265,885
FILES CLOSED FOR INCOMPLETENESS
8
$631,368
27
$413,337
1
$91,080
4
$2,272,500
3
$487,080
Aggregated Statistics For Year 2000 (Based on 3 full and 12 partial tracts)
A) FHA, FSA/RHS & VA Home Purchase Loans
B) Conventional Home Purchase Loans
C) Refinancings
D) Home Improvement Loans
E) Loans on Dwellings For 5+ Families
F) Non-occupant Loans on < 5 Family Dwellings (A B C & D)
Number
Average Value
Number
Average Value
Number
Average Value
Number
Average Value
Number
Average Value
Number
Average Value
LOANS ORIGINATED
2
$207,500
190
$380,735
142
$327,761
30
$101,727
19
$1,032,085
28
$273,497
APPLICATIONS APPROVED, NOT ACCEPTED
4
$192,490
27
$272,549
38
$193,177
7
$64,906
1
$1,478,520
3
$329,497
APPLICATIONS DENIED
5
$149,490
68
$236,596
71
$317,510
13
$135,485
1
$648,710
13
$231,818
APPLICATIONS WITHDRAWN
0
$0
60
$296,950
42
$208,210
3
$124,467
4
$2,879,702
4
$210,298
FILES CLOSED FOR INCOMPLETENESS
0
$0
4
$314,270
16
$343,588
1
$189,970
3
$2,274,333
0
$0
Aggregated Statistics For Year 1999 (Based on 4 full and 8 partial tracts)
A) FHA, FSA/RHS & VA Home Purchase Loans
B) Conventional Home Purchase Loans
C) Refinancings
D) Home Improvement Loans
E) Loans on Dwellings For 5+ Families
F) Non-occupant Loans on < 5 Family Dwellings (A B C & D)
2005 - 2018 National Fire Incident Reporting System (NFIRS) incidents
Based on the data from the years 2005 - 2018 the average number of fire incidents per year is 95. The highest number of fire incidents - 168 took place in 2006, and the least - 0 in 2008. The data has a rising trend.
When looking into fire subcategories, the most reports belonged to: Outside Fires (43.6%), and Structure Fires (36.5%).
Fire incident types reported to NFIRS in Zip Code 94704


 Nearest zip codes: 94720, 94709, 94703, 94705, 94702, 94618.


 Based on the data from the years 2005 - 2018 the average number of fire incidents per year is 95. The highest number of fire incidents - 168 took place in 2006, and the least - 0 in 2008. The data has a rising trend.
 When looking into fire subcategories, the most reports belonged to: Outside Fires (43.6%), and Structure Fires (36.5%).