Estimated zip code population in 2022: 4,029 Zip code population in 2010: 4,046 Zip code population in 2000: 3,401
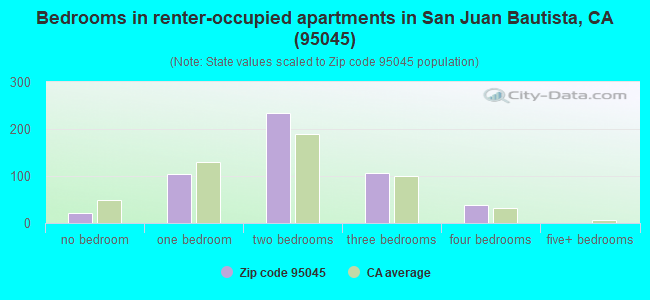
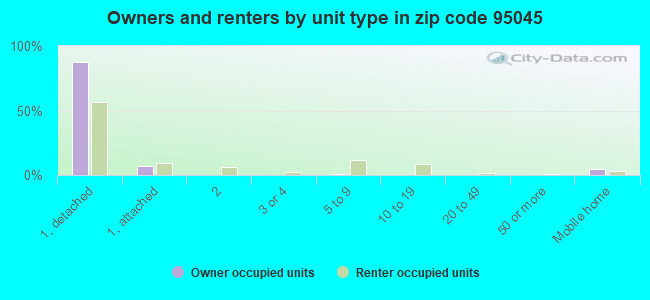
Houses and condos: 1,607 Renter-occupied apartments: 508
% of renters here:
33%
State:
44%
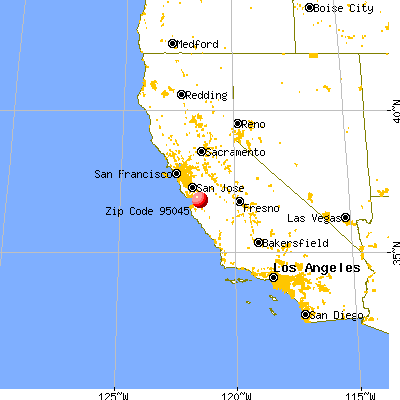
March 2022 cost of living index in zip code 95045: 101.4 (near average, U.S. average is 100)
Land area: 47.4 sq. mi. Water area: 0.0 sq. mi.
Population density: 85 people per square mile
(very low).
OSM Map
General Map
Google Map
MSN Map
OSM Map
General Map
Google Map
MSN Map
OSM Map
General Map
Google Map
MSN Map
OSM Map
General Map
Google Map
MSN Map
Please wait while loading the map...
Real estate property taxes paid for housing units in 2022:
This zip code:
0.7% ($6,003)
California:
0.7% ($4,831)
Median real estate property taxes paid for housing units with mortgages in 2022: $6,569 (0.7%) Median real estate property taxes paid for housing units with no mortgage in 2022: $4,439 (0.6%)
Business Search- 14 Million verified businesses
Males: 2,180
(54.1%)
Females: 1,848
(45.9%)
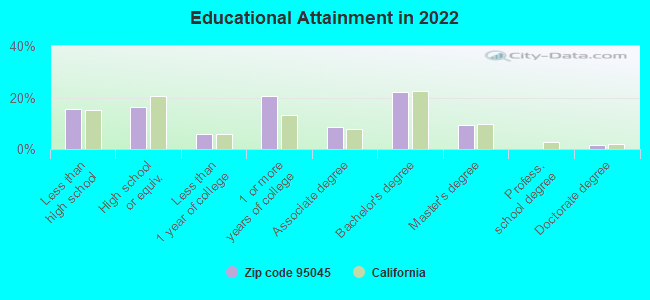
For population 25 years and over in 95045:
High school or higher: 83.3%
Bachelor's degree or higher: 32.7%
Graduate or professional degree: 10.9%
Unemployed: 4.4%
Mean travel time to work (commute): 37.6 minutes
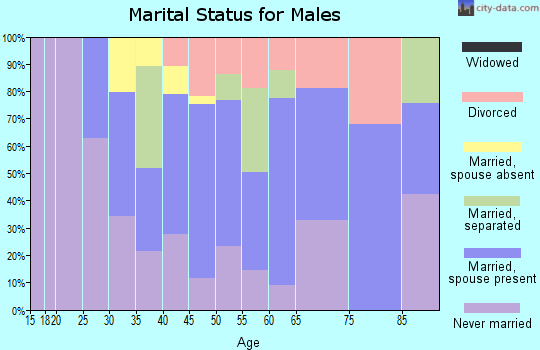
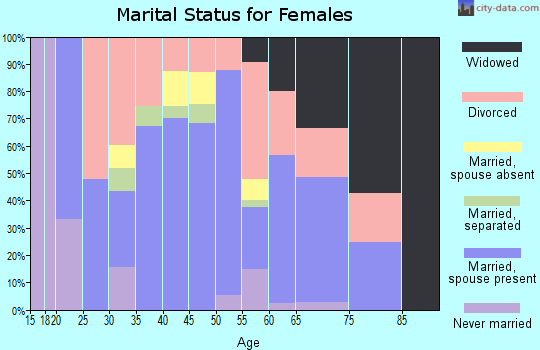
For population 15 years and over in 95045:
Never married: 25.8%
Now married: 63.3%
Separated: 0.2%
Widowed: 3.3%
Divorced: 7.4%
Zip code 95045 compared to state average:
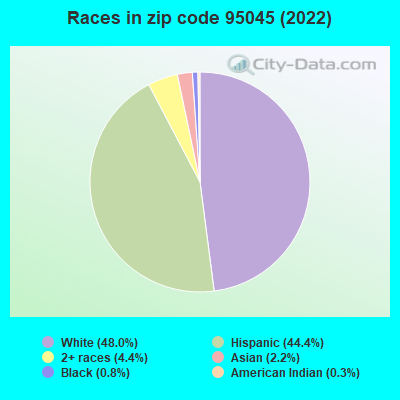
Black race population percentage significantly below state average.
Median age above state average.
Foreign-born population percentage below state average.
Averages for the 2020 tax year for zip code 95045, filed in 2021:
Average Adjusted Gross Income (AGI) in 2020: $88,845 (Individual Income Tax Returns)
Here:
$88,845
State:
$95,910
Salary/wage: $75,319 (reported on 82.9% of returns)
Here:
$75,319
State:
$77,331
(% of AGI for various income ranges: 1398.5% for AGIs below $25k, 4437.8% for AGIs $25k-50k, 7618.2% for AGIs $50k-75k, 11728.5% for AGIs $75k-100k, 19555.7% for AGIs $100k-200k, 83986.0% for AGIs over 200k)
Taxable interest for individuals: $947 (reported on 35.0% of returns)
This zip code:
$947
California:
$2,294
(% of AGI for various income ranges: 7.3% for AGIs below $25k, 23.0% for AGIs $25k-50k, 52.7% for AGIs $50k-75k, 22.3% for AGIs $75k-100k, 120.0% for AGIs $100k-200k, 426.0% for AGIs over 200k)
Ordinary dividends: $7,614 (reported on 16.1% of returns)
Here:
$7,614
State:
$10,949
(% of AGI for various income ranges: 25.5% for AGIs below $25k, 49.3% for AGIs $25k-50k, 49.5% for AGIs $50k-75k, 142.3% for AGIs $75k-100k, 270.9% for AGIs $100k-200k, 3062.0% for AGIs over 200k)
Net capital gain/loss in AGI: +$28,543 (reported on 17.1% of returns)
Here:
+$28,543
State:
+$49,306
(% of AGI for various income ranges: 1.8% for AGIs below $25k, 70.4% for AGIs $25k-50k, 14.5% for AGIs $50k-75k, 90.8% for AGIs $75k-100k, 393.0% for AGIs $100k-200k, 18622.0% for AGIs over 200k)
Profit/loss from business: +$18,243 (reported on 16.1% of returns)
Here:
+$18,243
State:
+$15,671
(% of AGI for various income ranges: 155.2% for AGIs below $25k, 130.7% for AGIs $25k-50k, 346.4% for AGIs $50k-75k, 608.5% for AGIs $75k-100k, 636.5% for AGIs $100k-200k, 5006.0% for AGIs over 200k)
Taxable individual retirement arrangement distribution: $20,967 (reported on 6.9% of returns)
95045:
$20,967
California:
$23,505
(% of AGI for various income ranges: 77.0% for AGIs below $25k, 73.2% for AGIs $50k-75k, 355.4% for AGIs $75k-100k, 701.7% for AGIs $100k-200k, 1308.0% for AGIs over 200k)
Total itemized deductions: $32,276 (reported on 22.6% of returns)
Here:
$32,276
State:
$39,517
(% of AGI for various income ranges: 154.2% for AGIs below $25k, 264.1% for AGIs $25k-50k, 761.8% for AGIs $50k-75k, 1626.9% for AGIs $75k-100k, 2505.7% for AGIs $100k-200k, 10078.0% for AGIs over 200k)
Charity contributions: $5,676 (reported on 17.1% of returns)
Here:
$5,676
State:
$12,598
(% of AGI for various income ranges: 37.6% for AGIs below $25k, 78.6% for AGIs $50k-75k, 133.8% for AGIs $75k-100k, 265.2% for AGIs $100k-200k, 2038.0% for AGIs over 200k)
Taxes paid: $8,882 (reported on 22.6% of returns)
95045:
$8,882
State:
$8,807
(% of AGI for various income ranges: 31.5% for AGIs below $25k, 62.6% for AGIs $25k-50k, 181.4% for AGIs $50k-75k, 497.7% for AGIs $75k-100k, 776.5% for AGIs $100k-200k, 2494.0% for AGIs over 200k)
Earned income credit: $1,733 (reported on 9.7% of returns)
Here:
$1,733
State:
$2,074
(% of AGI for various income ranges: 58.2% for AGIs below $25k, 63.7% for AGIs $25k-50k)
Percentage of individuals using paid preparers for their 2020 taxes: 92.6%
Here:
93%
State:
92%
(% for various income ranges: 90.4% for AGIs below $25k, 95.3% for AGIs $25k-50k, 91.4% for AGIs $50k-75k, 91.7% for AGIs $75k-100k, 93.2% for AGIs $100k-200k, 94.7% for AGIs over 200k)
Averages for the 2012 tax year for zip code 95045, filed in 2013:
Average Adjusted Gross Income (AGI) in 2012: $63,193 (Individual Income Tax Returns)
Here:
$63,193
State:
$72,726
Salary/wage: $54,748 (reported on 83.1% of returns)
Here:
$54,748
State:
$59,079
(% of AGI for various income ranges: 74.7% for AGIs below $25k, 79.4% for AGIs $25k-50k, 77.6% for AGIs $50k-75k, 71.4% for AGIs $75k-100k, 75.7% for AGIs $100k-200k, 58.1% for AGIs over 200k)
Taxable interest for individuals: $995 (reported on 35.0% of returns)
This zip code:
$995
California:
$2,146
(% of AGI for various income ranges: 0.9% for AGIs below $25k, 0.5% for AGIs $25k-50k, 1.1% for AGIs $50k-75k, 0.4% for AGIs $75k-100k, 0.4% for AGIs $100k-200k, 0.4% for AGIs over 200k)
Ordinary dividends: $4,113 (reported on 16.4% of returns)
Here:
$4,113
State:
$9,308
(% of AGI for various income ranges: 1.0% for AGIs below $25k, 0.8% for AGIs $25k-50k, 0.6% for AGIs $50k-75k, 0.7% for AGIs $75k-100k, 1.1% for AGIs $100k-200k, 1.7% for AGIs over 200k)
Net capital gain/loss in AGI: +$9,000 (reported on 15.3% of returns)
Here:
+$9,000
State:
+$30,460
(% of AGI for various income ranges: 0.3% for AGIs below $25k, 0.3% for AGIs $50k-75k, 0.3% for AGIs $75k-100k, 1.7% for AGIs $100k-200k, 7.0% for AGIs over 200k)
Profit/loss from business: +$14,133 (reported on 18.0% of returns)
Here:
+$14,133
State:
+$17,064
(% of AGI for various income ranges: 5.9% for AGIs below $25k, 1.7% for AGIs $25k-50k, 4.3% for AGIs $50k-75k, 3.1% for AGIs $75k-100k, 2.5% for AGIs $100k-200k, 7.4% for AGIs over 200k)
Taxable individual retirement arrangement distribution: $12,333 (reported on 8.2% of returns)
95045:
$12,333
California:
$19,557
(% of AGI for various income ranges: 1.5% for AGIs below $25k, 2.5% for AGIs $25k-50k, 2.8% for AGIs $75k-100k, 2.6% for AGIs $100k-200k)
Total itemized deductions: $30,221 (26% of AGI, reported on 36.6% of returns)
Here:
$30,221
State:
$34,004
Here:
25.8% of AGI
State:
22.7% of AGI
(% of AGI for various income ranges: 12.7% for AGIs below $25k, 10.9% for AGIs $25k-50k, 14.6% for AGIs $50k-75k, 16.8% for AGIs $75k-100k, 22.7% for AGIs $100k-200k, 17.7% for AGIs over 200k)
Charity contributions: $3,041 (reported on 29.5% of returns)
Here:
$3,041
State:
$4,659
(% of AGI for various income ranges: 0.6% for AGIs below $25k, 1.0% for AGIs $25k-50k, 1.1% for AGIs $50k-75k, 1.4% for AGIs $75k-100k, 1.8% for AGIs $100k-200k, 1.6% for AGIs over 200k)
Taxes paid: $11,127 (reported on 36.6% of returns)
95045:
$11,127
State:
$14,448
(% of AGI for various income ranges: 2.4% for AGIs below $25k, 2.3% for AGIs $25k-50k, 4.2% for AGIs $50k-75k, 5.6% for AGIs $75k-100k, 8.2% for AGIs $100k-200k, 9.4% for AGIs over 200k)
Earned income credit: $2,056 (reported on 17.5% of returns)
Here:
$2,056
State:
$2,286
(% of AGI for various income ranges: 5.7% for AGIs below $25k, 1.1% for AGIs $25k-50k)
Percentage of individuals using paid preparers for their 2012 taxes: 66.7%
Here:
67%
State:
64%
(% for various income ranges: 60.9% for AGIs below $25k, 70.5% for AGIs $25k-50k, 72.0% for AGIs $50k-75k, 66.7% for AGIs $75k-100k, 66.7% for AGIs $100k-200k, 75.0% for AGIs over 200k)
Averages for the 2004 tax year for zip code 95045, filed in 2005:
Average Adjusted Gross Income (AGI) in 2004: $58,636 (Individual Income Tax Returns)
Here:
$58,636
State:
$58,600
Salary/wage: $50,956 (reported on 82.8% of returns)
Here:
$50,956
State:
$49,455
(% of AGI for various income ranges: 108.4% for AGIs below $10k, 77.0% for AGIs $10k-25k, 82.2% for AGIs $25k-50k, 82.0% for AGIs $50k-75k, 84.8% for AGIs $75k-100k, 61.6% for AGIs over 100k)
Taxable interest for individuals: $1,406 (reported on 44.2% of returns)
This zip code:
$1,406
California:
$2,365
(% of AGI for various income ranges: 3.6% for AGIs below $10k, 1.9% for AGIs $10k-25k, 0.7% for AGIs $25k-50k, 1.5% for AGIs $50k-75k, 0.5% for AGIs $75k-100k, 1.0% for AGIs over 100k)
Taxable dividends: $2,474 (reported on 21.1% of returns)
Here:
$2,474
State:
$4,746
(% of AGI for various income ranges: 7.7% for AGIs below $10k, 1.5% for AGIs $10k-25k, 0.9% for AGIs $25k-50k, 0.7% for AGIs $50k-75k, 0.4% for AGIs $75k-100k, 0.9% for AGIs over 100k)
Net capital gain/loss: +$19,492 (reported on 17.9% of returns)
Here:
+$19,492
State:
+$23,418
(% of AGI for various income ranges: -0.8% for AGIs below $10k, -0.4% for AGIs $10k-25k, 0.3% for AGIs $25k-50k, 0.4% for AGIs $50k-75k, -0.1% for AGIs $75k-100k, 11.6% for AGIs over 100k)
Profit/loss from business: +$18,232 (reported on 18.1% of returns)
Here:
+$18,232
State:
+$16,826
(% of AGI for various income ranges: 25.7% for AGIs below $10k, 7.5% for AGIs $10k-25k, 3.6% for AGIs $25k-50k, 3.2% for AGIs $50k-75k, 5.1% for AGIs $75k-100k, 6.5% for AGIs over 100k)
IRA payment deduction: $3,255 (reported on 3.2% of returns)
95045:
$3,255
California:
$3,192
Self-employed pension: $16,643 (reported on 0.8% of returns)
Here:
$16,643
California:
$17,688
Total itemized deductions: $29,647 (29% of AGI, reported on 41.5% of returns)
Here:
$29,647
State:
$28,113
Here:
28.5% of AGI
State:
25.3% of AGI
(% of AGI for various income ranges: 51.1% for AGIs below $10k, 12.7% for AGIs $10k-25k, 15.0% for AGIs $25k-50k, 22.9% for AGIs $50k-75k, 29.0% for AGIs $75k-100k, 20.8% for AGIs over 100k)
Charity contributions deductions: $2,629 (2% of AGI, reported on 35.4% of returns)
Here:
$2,629
State:
$3,923
Here:
2.4% of AGI
State:
3.3% of AGI
(% of AGI for various income ranges: 1.2% for AGIs below $10k, 0.8% for AGIs $10k-25k, 1.3% for AGIs $25k-50k, 1.8% for AGIs $50k-75k, 1.6% for AGIs $75k-100k, 1.7% for AGIs over 100k)
Total tax: $9,683 (reported on 75.5% of returns)
95045:
$9,683
State:
$10,761
(% of AGI for various income ranges: 5.0% for AGIs below $10k, 4.2% for AGIs $10k-25k, 6.6% for AGIs $25k-50k, 8.8% for AGIs $50k-75k, 9.4% for AGIs $75k-100k, 17.2% for AGIs over 100k)
Earned income credit: $1,516 (reported on 12.6% of returns)
Here:
$1,516
State:
$1,763
Percentage of individuals using paid preparers for their 2004 taxes: 67.3%
Here:
67%
State:
66%
(% for various income ranges: 57.1% for AGIs below $10k, 65.7% for AGIs $10k-25k, 68.9% for AGIs $25k-50k, 69.2% for AGIs $50k-75k, 67.2% for AGIs $75k-100k, 76.0% for AGIs over 100k)
Likely homosexual households (counted as self-reported same-sex unmarried-partner households)
Lesbian couples: 1.0% of all households
Gay men: 0.0% of all households
Household received Food Stamps/SNAP in the past 12 months: 65 Household did not receive Food Stamps/SNAP in the past 12 months: 1,442
Women who had a birth in the past 12 months: 40 (40 now married, 0 unmarried) Women who did not have a birth in the past 12 months: 762 (414 now married, 342 unmarried)
Housing units in zip code 95045 with a mortgage: 647 (40 second mortgage, 29 home equity loan, 5 both second mortgage and home equity loan) Median monthly owner costs for units with a mortgage: $3,597 Median monthly owner costs for units without a mortgage: $1,038
Residents with income below the poverty level in 2022:
This zip code:
3.9%
Whole state:
12.2%
Residents with income below 50% of the poverty level in 2022:
This zip code:
2.6%
Whole state:
6.2%
Median number of rooms in houses and condos:
Here:
6.3
State:
6.0
Median number of rooms in apartments:
Here:
4.3
State:
3.9
Notable locations in this zip code not listed on our city pages
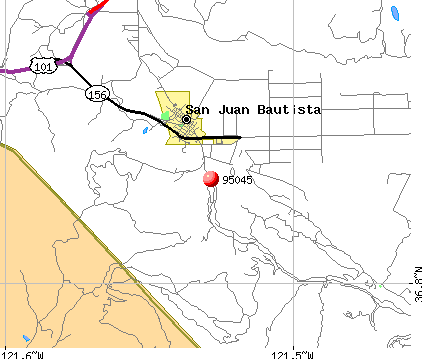
Notable locations in zip code 95045: Saint Francis Retreat (A), San Juan Bautista Volunteer Fire Department (B), Jose Castro House (C), Tuccoletta Hall (D), Theophile Vache Adobe (E), Taix Block (F), San Juan Bautista City Library (G), San Juan Bautista City Hall (H), Rozas House (I), Odd Fellows Hall (J), Lavagnino House (K), Kemp House (L), Juan de Anza Adobe (M), John Anderson House (N), Joe Zbrankik Blacksmith Shop (O), Jasper Twitchell House (P), Galacoma Building (Q), Felipe Gardella House (R), Crane House (S), Bluebird Hotel (T). Display/hide their locations on the map
Parks in zip code 95045 include: Fremont Peak State Park (1), Abbe Park (2), San Juan Bautista Historic District (3), San Juan Bautista State Historic Park (4). Display/hide their locations on the map
In group quarters: 36 (-1 institutionalized population)
Size of family households: 551 2-persons, 256 3-persons, 225 4-persons, 96 5-persons, 33 6-persons
Size of nonfamily households: 322 1-person, 43 2-persons, 4 3-persons
585 married couples with children.
16 single-parent households (8 men, 8 women).
71.2% of residents of 95045 zip code speak English at home.
28.5% of residents speak Spanish at home (72% very well, 6% well, 15% not well, 8% not at all).
0.1% of residents speak Asian or Pacific Island language at home (100% very well).
0.4% of residents speak other language at home (100% very well).
Foreign born population: 618 (15.3%) (56.5% of them are naturalized citizens)
This zip code:
15.3%
Whole state:
26.7%
74%Honduras
10%Sweden
6%United Kingdom, excluding England and Scotland
5%England
3%Taiwan
3%Greece
2%Romania
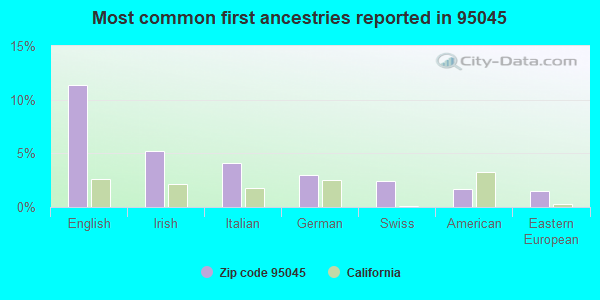
11%English
5%Irish
4%Italian
3%German
2%Swiss
2%American
1%Eastern European
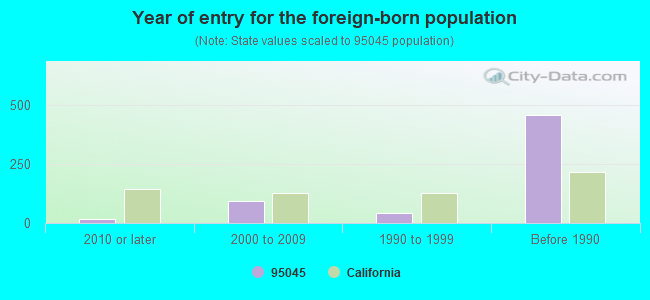
Year of entry for the foreign-born population
192010 or later
932000 to 2009
441990 to 1999
457Before 1990
Facilities with environmental interests located in this zip code:
ANZAR HIGH (2000 SAN JUAN HWY. in SAN JUAN BAUTISTA, CA)
(National Center for Education Statistics) - STATE ID-3530060 Organizations: AROMAS/SAN JUAN UNIFIED (SCHOOL DISTRICT)
HARRIS MORAN SEED COMP (100 BREEN RD in SAN JUAN BAUTISTA, CA)
Small Quantity Generators, between 100 kg and 1000 kg of hazardous waste/month (Resource Conservation and Recovery Act (tracking hazardous waste)) - notification
CAL TURF (780 FLINT RD in SAN JUAN BAUTISTA, CA)
TRANSPORTER (Resource Conservation and Recovery Act (tracking hazardous waste)) Organizations: TRI WEST (CONTACT/OWNER)
A ND D CHRISTOPHER RANCH (1690 FREITAS RD in SAN JUAN BAUTISTA, CA)
Small Quantity Generators, between 100 kg and 1000 kg of hazardous waste/month (Resource Conservation and Recovery Act (tracking hazardous waste)) - notification Organizations: DON C CHRISTOPHER (CONTACT/OWNER)
J&K AUTO REPAIR (63 MUCKELEMI in SAN JUAN BAUTISTA, CA)
CRITERIA AND HAZARDOUS AIR POLLUTANT INVENTORY (Inventory of air pollution sources) Business SIC classification: GASOLINE SERVICE STATIONS
JEFF & KAY BOYCE (63 MUCKELEMI STREET in SAN JUAN BAUTISTA, CA)
CRITERIA AND HAZARDOUS AIR POLLUTANT INVENTORY (Inventory of air pollution sources) Business SIC classification: GASOLINE SERVICE STATIONS
Housing units lacking complete plumbing facilities: 2.7% Housing units lacking complete kitchen facilities: 3.1%
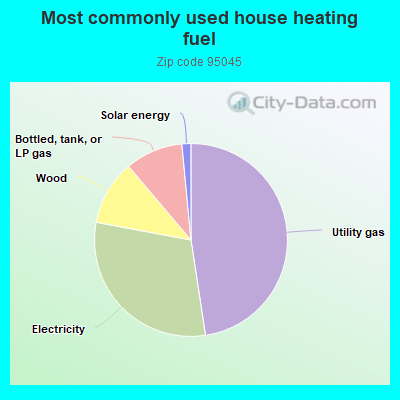
47.7%Utility gas
30.4%Electricity
10.9%Wood
9.7%Bottled, tank, or LP gas
1.5%Solar energy
Population in 1990: 3,657.
Place of birth for U.S.-born residents:
This state: 2,678
Northeast: 190
Midwest: 198
South: 224
West: 89
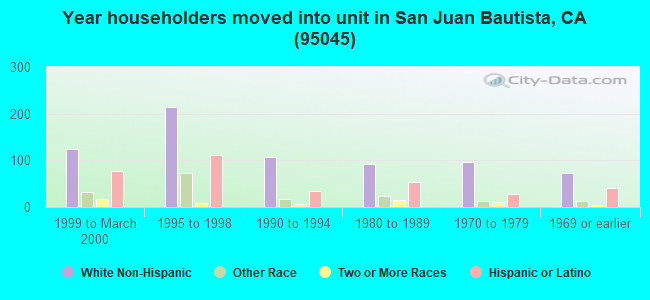
58% of the 95045 zip code residents lived in the same house 5 years ago. Out of people who lived in different houses, 34% lived in this county. Out of people who lived in different counties, 50% lived in California.
94% of the 95045 zip code residents lived in the same house 1 year ago. Out of people who lived in different houses, 14% moved from this county. Out of people who lived in different houses, 93% moved from different county within same state.
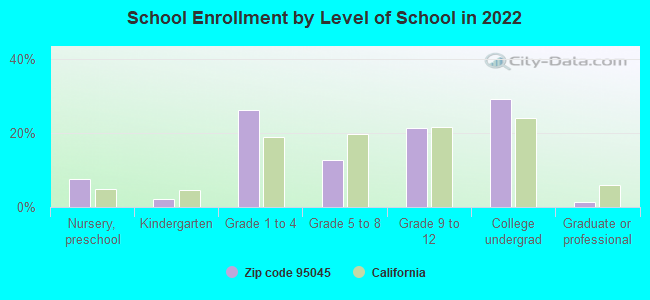
Private vs. public school enrollment:
Students in private schools in grades 1 to 8 (elementary and middle school): 34
Here:
13.0%
California:
10.5%
Students in private schools in grades 9 to 12 (high school): 20
Here:
14.0%
California:
8.5%
Students in private undergraduate colleges: 50
Here:
25.2%
California:
15.9%
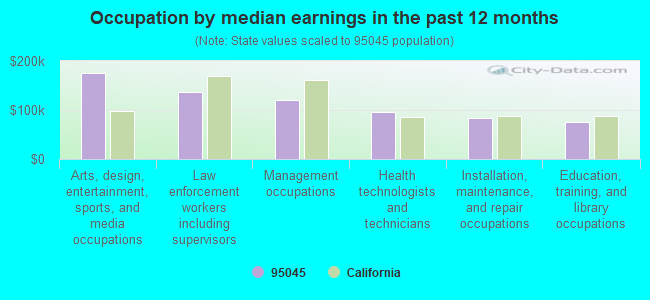
Occupation by median earnings in the past 12 months ($)
175,295Arts, design, entertainment, sports, and media occupations
136,894Law enforcement workers including supervisors
120,962Management occupations
96,600Health technologists and technicians
84,656Installation, maintenance, and repair occupations
74,530Education, training, and library occupations
Top industries in this zip code by the number of employees in 2005:
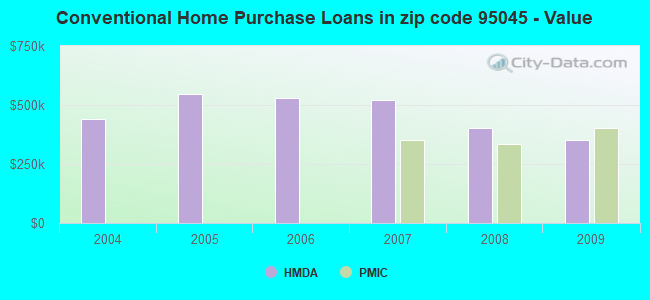
Detailed PMIC statistics for the following Tracts:0002.00
2005 - 2018 National Fire Incident Reporting System (NFIRS) incidents
According to the data from the years 2005 - 2018 the average number of fire incidents per year is 19. The highest number of fire incidents - 39 took place in 2008, and the least - 3 in 2014. The data has a dropping trend.
When looking into fire subcategories, the most incidents belonged to: Outside Fires (51.0%), and Mobile Property/Vehicle Fires (22.6%).
Fire incident types reported to NFIRS in Zip Code 95045


 Nearest zip codes: 95004, 93906, 93907, 93905, 95023, 93908.


 According to the data from the years 2005 - 2018 the average number of fire incidents per year is 19. The highest number of fire incidents - 39 took place in 2008, and the least - 3 in 2014. The data has a dropping trend.
 When looking into fire subcategories, the most incidents belonged to: Outside Fires (51.0%), and Mobile Property/Vehicle Fires (22.6%).