Estimated zip code population in 2022: 4,086 Zip code population in 2010: 3,883 Zip code population in 2000: 4,229
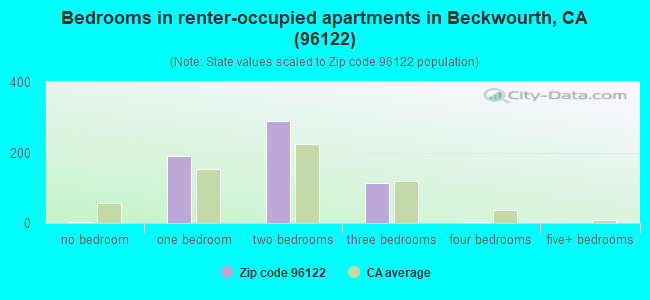
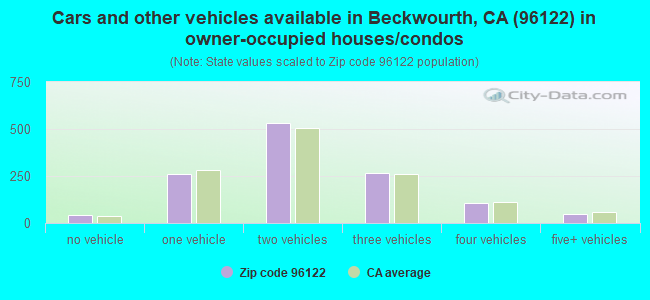
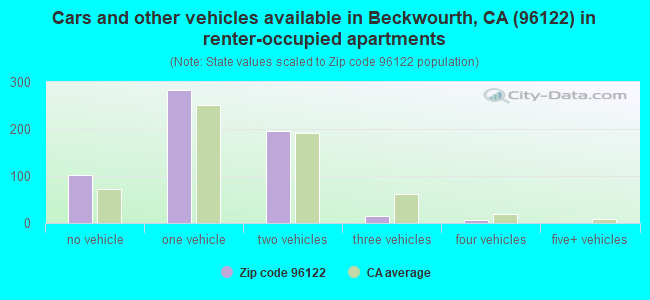
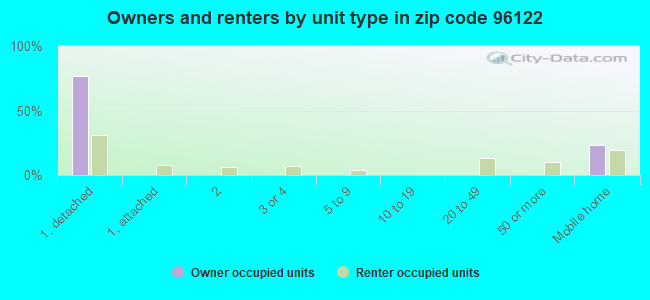
Houses and condos: 2,551 Renter-occupied apartments: 603
% of renters here:
33%
State:
44%
March 2022 cost of living index in zip code 96122: 88.4 (less than average, U.S. average is 100)
Land area: 61.3 sq. mi. Water area: 0.0 sq. mi.
Population density: 67 people per square mile
(very low).
OSM Map
General Map
Google Map
MSN Map
OSM Map
General Map
Google Map
MSN Map
OSM Map
General Map
Google Map
MSN Map
OSM Map
General Map
Google Map
MSN Map
Please wait while loading the map...
Real estate property taxes paid for housing units in 2022:
This zip code:
0.6% ($1,470)
California:
0.7% ($4,831)
Median real estate property taxes paid for housing units with mortgages in 2022: $2,305 (0.9%) Median real estate property taxes paid for housing units with no mortgage in 2022: $830 (0.4%)
Business Search- 14 Million verified businesses
Males: 2,042
(50.0%)
Females: 2,043
(50.0%)
For population 25 years and over in 96122:
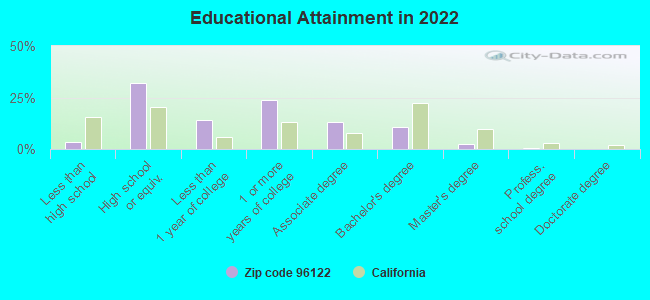
High school or higher: 94.9%
Bachelor's degree or higher: 13.4%
Graduate or professional degree: 3.0%
Unemployed: 8.4%
Mean travel time to work (commute): 24.1 minutes
For population 15 years and over in 96122:
Never married: 24.6%
Now married: 49.8%
Separated: 0.8%
Widowed: 5.9%
Divorced: 18.9%
Zip code 96122 compared to state average:
Median household income below state average.
Median house value significantly below state average.
Black race population percentage significantly below state average.
Hispanic race population percentage below state average.
Median age significantly above state average.
Foreign-born population percentage significantly below state average.
Length of stay since moving in significantly above state average.
Number of college students below state average.
Percentage of population with a bachelor's degree or higher significantly below state average.
Averages for the 2020 tax year for zip code 96122, filed in 2021:
Average Adjusted Gross Income (AGI) in 2020: $57,023 (Individual Income Tax Returns)
Here:
$57,023
State:
$95,910
Salary/wage: $48,533 (reported on 74.6% of returns)
Here:
$48,533
State:
$77,331
(% of AGI for various income ranges: 1210.8% for AGIs below $25k, 3495.8% for AGIs $25k-50k, 6412.9% for AGIs $50k-75k, 9505.5% for AGIs $75k-100k, 15315.0% for AGIs $100k-200k)
Taxable interest for individuals: $588 (reported on 33.1% of returns)
This zip code:
$588
California:
$2,294
(% of AGI for various income ranges: 8.5% for AGIs below $25k, 7.1% for AGIs $25k-50k, 51.8% for AGIs $50k-75k, 51.8% for AGIs $75k-100k, 90.0% for AGIs $100k-200k)
Ordinary dividends: $3,332 (reported on 13.8% of returns)
Here:
$3,332
State:
$10,949
(% of AGI for various income ranges: 33.8% for AGIs below $25k, 27.4% for AGIs $25k-50k, 48.2% for AGIs $50k-75k, 35.5% for AGIs $75k-100k, 240.0% for AGIs $100k-200k)
Net capital gain/loss in AGI: +$9,748 (reported on 12.7% of returns)
Here:
+$9,748
State:
+$49,306
(% of AGI for various income ranges: 3.2% for AGIs below $25k, 41.6% for AGIs $25k-50k, 24.7% for AGIs $50k-75k, 100.0% for AGIs $75k-100k, 594.2% for AGIs $100k-200k)
Profit/loss from business: +$15,456 (reported on 14.9% of returns)
Here:
+$15,456
State:
+$15,671
(% of AGI for various income ranges: 120.5% for AGIs below $25k, 280.6% for AGIs $25k-50k, 318.2% for AGIs $50k-75k, 476.4% for AGIs $75k-100k, 1463.3% for AGIs $100k-200k)
Taxable individual retirement arrangement distribution: $23,736 (reported on 7.7% of returns)
96122:
$23,736
California:
$23,505
(% of AGI for various income ranges: 62.0% for AGIs below $25k, 158.1% for AGIs $25k-50k, 402.7% for AGIs $75k-100k, 1785.0% for AGIs $100k-200k)
Total itemized deductions: $30,192 (reported on 6.6% of returns)
Here:
$30,192
State:
$39,517
(% of AGI for various income ranges: 114.5% for AGIs below $25k, 568.8% for AGIs $50k-75k, 1062.5% for AGIs $100k-200k)
Charity contributions: $4,356 (reported on 5.0% of returns)
Here:
$4,356
State:
$12,598
(% of AGI for various income ranges: 47.6% for AGIs $50k-75k, 259.2% for AGIs $100k-200k)
Taxes paid: $7,625 (reported on 6.6% of returns)
96122:
$7,625
State:
$8,807
(% of AGI for various income ranges: 16.5% for AGIs below $25k, 141.2% for AGIs $50k-75k, 314.2% for AGIs $100k-200k)
Earned income credit: $2,159 (reported on 17.7% of returns)
Here:
$2,159
State:
$2,074
(% of AGI for various income ranges: 109.5% for AGIs below $25k, 81.6% for AGIs $25k-50k)
Percentage of individuals using paid preparers for their 2020 taxes: 91.7%
Here:
92%
State:
92%
(% for various income ranges: 90.6% for AGIs below $25k, 93.5% for AGIs $25k-50k, 92.6% for AGIs $50k-75k, 88.9% for AGIs $75k-100k, 90.5% for AGIs $100k-200k, 100.0% for AGIs over 200k)
Averages for the 2012 tax year for zip code 96122, filed in 2013:
Average Adjusted Gross Income (AGI) in 2012: $45,241 (Individual Income Tax Returns)
Here:
$45,241
State:
$72,726
Salary/wage: $35,754 (reported on 77.8% of returns)
Here:
$35,754
State:
$59,079
(% of AGI for various income ranges: 68.1% for AGIs below $25k, 65.7% for AGIs $25k-50k, 66.8% for AGIs $50k-75k, 66.5% for AGIs $75k-100k, 78.5% for AGIs $100k-200k)
Taxable interest for individuals: $913 (reported on 35.3% of returns)
This zip code:
$913
California:
$2,146
(% of AGI for various income ranges: 1.4% for AGIs below $25k, 0.9% for AGIs $25k-50k, 0.3% for AGIs $50k-75k, 0.5% for AGIs $75k-100k, 1.1% for AGIs $100k-200k)
Ordinary dividends: $2,865 (reported on 15.0% of returns)
Here:
$2,865
State:
$9,308
(% of AGI for various income ranges: 1.7% for AGIs below $25k, 0.3% for AGIs $25k-50k, 0.5% for AGIs $50k-75k, 0.4% for AGIs $75k-100k, 2.3% for AGIs $100k-200k)
Net capital gain/loss in AGI: +$4,006 (reported on 11.1% of returns)
Here:
+$4,006
State:
+$30,460
(% of AGI for various income ranges: 0.5% for AGIs $75k-100k, 4.2% for AGIs $100k-200k)
Profit/loss from business: +$9,896 (reported on 17.6% of returns)
Here:
+$9,896
State:
+$17,064
(% of AGI for various income ranges: 7.0% for AGIs below $25k, 5.7% for AGIs $25k-50k, 1.5% for AGIs $50k-75k, 4.7% for AGIs $75k-100k, 4.0% for AGIs $100k-200k)
Taxable individual retirement arrangement distribution: $13,200 (reported on 9.2% of returns)
96122:
$13,200
California:
$19,557
(% of AGI for various income ranges: 2.3% for AGIs below $25k, 2.4% for AGIs $25k-50k, 5.0% for AGIs $50k-75k, 4.4% for AGIs $100k-200k)
Total itemized deductions: $22,483 (25% of AGI, reported on 26.8% of returns)
Here:
$22,483
State:
$34,004
Here:
25.0% of AGI
State:
22.7% of AGI
(% of AGI for various income ranges: 8.7% for AGIs below $25k, 9.4% for AGIs $25k-50k, 12.6% for AGIs $50k-75k, 15.2% for AGIs $75k-100k, 17.1% for AGIs $100k-200k, 15.8% for AGIs over 200k)
Charity contributions: $2,455 (reported on 20.3% of returns)
Here:
$2,455
State:
$4,659
(% of AGI for various income ranges: 0.5% for AGIs below $25k, 0.8% for AGIs $25k-50k, 1.1% for AGIs $50k-75k, 1.5% for AGIs $75k-100k, 1.9% for AGIs $100k-200k)
Taxes paid: $6,439 (reported on 26.8% of returns)
96122:
$6,439
State:
$14,448
(% of AGI for various income ranges: 1.7% for AGIs below $25k, 1.8% for AGIs $25k-50k, 2.9% for AGIs $50k-75k, 3.9% for AGIs $75k-100k, 6.0% for AGIs $100k-200k, 6.1% for AGIs over 200k)
Earned income credit: $2,045 (reported on 20.3% of returns)
Here:
$2,045
State:
$2,286
(% of AGI for various income ranges: 5.7% for AGIs below $25k, 1.2% for AGIs $25k-50k)
Percentage of individuals using paid preparers for their 2012 taxes: 58.2%
Here:
58%
State:
64%
(% for various income ranges: 51.5% for AGIs below $25k, 55.3% for AGIs $25k-50k, 66.7% for AGIs $50k-75k, 75.0% for AGIs $75k-100k, 83.3% for AGIs $100k-200k)
Averages for the 2004 tax year for zip code 96122, filed in 2005:
Average Adjusted Gross Income (AGI) in 2004: $38,291 (Individual Income Tax Returns)
Here:
$38,291
State:
$58,600
Salary/wage: $33,021 (reported on 79.1% of returns)
Here:
$33,021
State:
$49,455
(% of AGI for various income ranges: 285.8% for AGIs below $10k, 66.1% for AGIs $10k-25k, 70.6% for AGIs $25k-50k, 70.8% for AGIs $50k-75k, 74.3% for AGIs $75k-100k, 51.0% for AGIs over 100k)
Taxable interest for individuals: $1,539 (reported on 42.9% of returns)
This zip code:
$1,539
California:
$2,365
(% of AGI for various income ranges: 10.1% for AGIs below $10k, 3.0% for AGIs $10k-25k, 0.9% for AGIs $25k-50k, 1.7% for AGIs $50k-75k, 1.3% for AGIs $75k-100k, 1.8% for AGIs over 100k)
Taxable dividends: $2,052 (reported on 16.1% of returns)
Here:
$2,052
State:
$4,746
(% of AGI for various income ranges: 7.2% for AGIs below $10k, 0.9% for AGIs $10k-25k, 0.9% for AGIs $25k-50k, 0.5% for AGIs $50k-75k, 0.7% for AGIs $75k-100k, 0.9% for AGIs over 100k)
Net capital gain/loss: +$13,969 (reported on 16.6% of returns)
Here:
+$13,969
State:
+$23,418
(% of AGI for various income ranges: -0.1% for AGIs below $10k, 0.5% for AGIs $10k-25k, 1.0% for AGIs $25k-50k, 2.7% for AGIs $50k-75k, 4.1% for AGIs $75k-100k, 18.3% for AGIs over 100k)
Profit/loss from business: +$14,997 (reported on 21.8% of returns)
Here:
+$14,997
State:
+$16,826
(% of AGI for various income ranges: -4.9% for AGIs below $10k, 9.3% for AGIs $10k-25k, 7.4% for AGIs $25k-50k, 6.5% for AGIs $50k-75k, 8.7% for AGIs $75k-100k, 11.5% for AGIs over 100k)
IRA payment deduction: $3,320 (reported on 2.8% of returns)
96122:
$3,320
California:
$3,192
Self-employed pension: $10,700 (reported on 1.1% of returns)
Here:
$10,700
California:
$17,688
Total itemized deductions: $17,612 (25% of AGI, reported on 30.3% of returns)
Here:
$17,612
State:
$28,113
Here:
24.8% of AGI
State:
25.3% of AGI
(% of AGI for various income ranges: 26.6% for AGIs below $10k, 7.6% for AGIs $10k-25k, 12.4% for AGIs $25k-50k, 15.6% for AGIs $50k-75k, 16.7% for AGIs $75k-100k, 14.7% for AGIs over 100k)
Charity contributions deductions: $2,187 (3% of AGI, reported on 24.4% of returns)
Here:
$2,187
State:
$3,923
Here:
2.9% of AGI
State:
3.3% of AGI
(% of AGI for various income ranges: 0.8% for AGIs $10k-25k, 1.2% for AGIs $25k-50k, 1.5% for AGIs $50k-75k, 1.4% for AGIs $75k-100k, 1.8% for AGIs over 100k)
Total tax: $5,064 (reported on 75.3% of returns)
96122:
$5,064
State:
$10,761
(% of AGI for various income ranges: 7.4% for AGIs below $10k, 4.4% for AGIs $10k-25k, 6.7% for AGIs $25k-50k, 8.7% for AGIs $50k-75k, 11.0% for AGIs $75k-100k, 16.4% for AGIs over 100k)
Earned income credit: $1,641 (reported on 15.8% of returns)
Here:
$1,641
State:
$1,763
Percentage of individuals using paid preparers for their 2004 taxes: 63.8%
Here:
64%
State:
66%
(% for various income ranges: 56.5% for AGIs below $10k, 59.1% for AGIs $10k-25k, 70.0% for AGIs $25k-50k, 67.1% for AGIs $50k-75k, 67.7% for AGIs $75k-100k, 73.6% for AGIs over 100k)
Household received Food Stamps/SNAP in the past 12 months: 378 Household did not receive Food Stamps/SNAP in the past 12 months: 1,505
Women who had a birth in the past 12 months: 107 (32 now married, 76 unmarried) Women who did not have a birth in the past 12 months: 734 (311 now married, 421 unmarried)
Housing units in zip code 96122 with a mortgage: 778 (35 second mortgage, 32 both second mortgage and home equity loan) Median monthly owner costs for units with a mortgage: $1,297 Median monthly owner costs for units without a mortgage: $396
Residents with income below the poverty level in 2022:
This zip code:
13.9%
Whole state:
12.2%
Residents with income below 50% of the poverty level in 2022:
This zip code:
5.1%
Whole state:
6.2%
Median number of rooms in houses and condos:
Here:
5.2
State:
6.0
Median number of rooms in apartments:
Here:
3.9
State:
3.9
Notable locations in this zip code not listed on our city pages
Notable locations in zip code 96122: Ramelli Ranch (A), Davis Roadside Rest (B), Ramelli Ranch (C), Portola Railroad Museum (D), Portola Memorial Hall (E), Portola Fire Department North Side Station (F), Eastern Plumas Rural Fire Protection District Station 2 (G), Eastern Plumas Rural Fire Protection District Station 1 (H), Eastern Plumas Rural Fire Protection District Station 3 (I), Portola Fire Department South Side Station (J). Display/hide their locations on the map
Churches in zip code 96122 include: Portola Station Baptist Church (A), Portola Church of the Nazarene (B), Assembly of God Church (C). Display/hide their locations on the map
In group quarters: 85 (-1 institutionalized population)
Size of family households: 493 2-persons, 396 3-persons, 95 4-persons, 80 5-persons, 13 6-persons, 20 7-or-more-persons
Size of nonfamily households: 583 1-person, 186 2-persons
451 married couples with children.
169 single-parent households (169 women).
86.7% of residents of 96122 zip code speak English at home.
9.0% of residents speak Spanish at home (65% very well, 26% well, 9% not well).
3.6% of residents speak other Indo-European language at home (55% very well, 45% well).
0.3% of residents speak other language at home (100% very well).
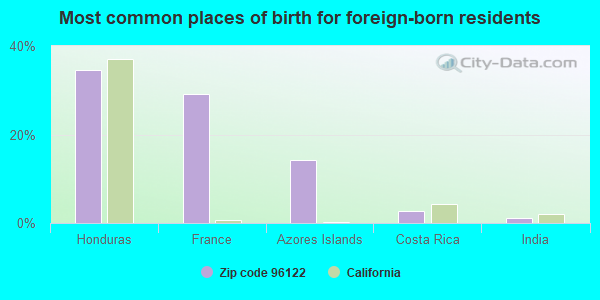
Foreign born population: 345 (8.5%) (67.9% of them are naturalized citizens)
This zip code:
8.5%
Whole state:
26.7%
35%Honduras
29%France
14%Azores Islands
3%Costa Rica
1%India
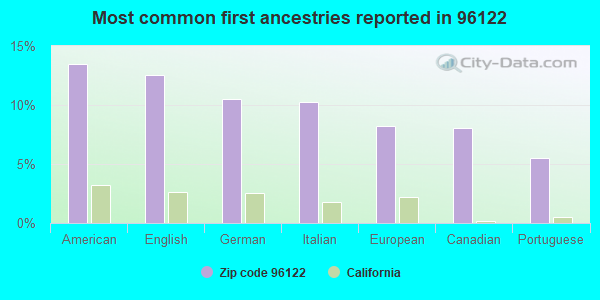
13%American
13%English
11%German
10%Italian
8%European
8%Canadian
6%Portuguese
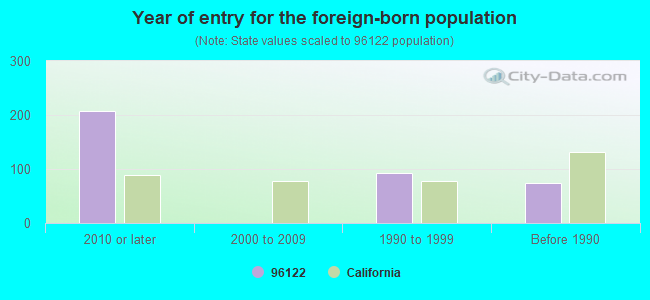
Year of entry for the foreign-born population
2082010 or later
02000 to 2009
931990 to 1999
75Before 1990
Facilities with environmental interests located in this zip code:
FEATHER RIVER MIDDLE (505 NEVADA ST. in PORTOLA, CA)
(National Center for Education Statistics) - STATE ID-6109896 Organizations: PLUMAS UNIFIED (SCHOOL DISTRICT)
GREENVILLE OPPORTUNITY (425 NEVADA ST. in PORTOLA, CA)
(National Center for Education Statistics) - STATE ID-6117360 Organizations: PLUMAS CO. OFFICE OF EDUCATION (SCHOOL DISTRICT)
CARMICHAEL (C.ROY) ELEMENTARY (895 WEST ST. in PORTOLA, CA)
(National Center for Education Statistics) - STATE ID-6110308 Organizations: PLUMAS UNIFIED (SCHOOL DISTRICT)
GRIZZLY RANCH COMMUNITY SERVICE (4375 GRIZZLY ROAD in PORTOLA, CA)
National Pollutant Discharge Elimination System NON-MAJOR (Tracking pollutant discharge elimination systems) - permit Business SIC classification: SEWERAGE SYSTEMS
CA DEPT OF FISH & GAME (LAKE DAVIS RD in DELLEKER, CA)
National Pollutant Discharge Elimination System NON-MAJOR (Tracking pollutant discharge elimination systems) - permit
Housing units lacking complete plumbing facilities: 2.3% Housing units lacking complete kitchen facilities: 2.7%
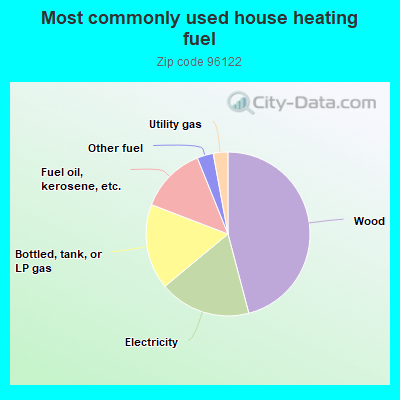
46.0%Wood
18.1%Electricity
16.9%Bottled, tank, or LP gas
13.1%Fuel oil, kerosene, etc.
3.2%Other fuel
2.9%Utility gas
Population in 1990: 3,685. Population change in the 1990s: +544 (+14.8%).
Place of birth for U.S.-born residents:
This state: 2,635
Northeast: 122
Midwest: 326
South: 62
West: 555
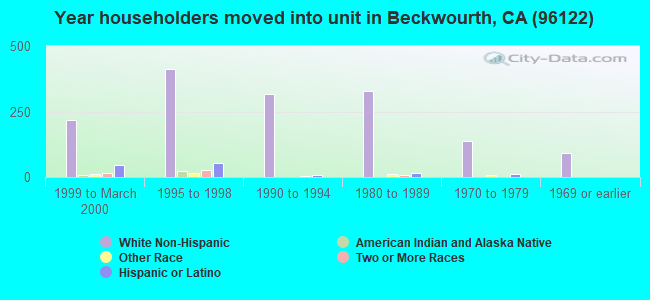
59% of the 96122 zip code residents lived in the same house 5 years ago. Out of people who lived in different houses, 39% lived in this county. Out of people who lived in different counties, 50% lived in California.
91% of the 96122 zip code residents lived in the same house 1 year ago. Out of people who lived in different houses, 25% moved from this county. Out of people who lived in different houses, 30% moved from different county within same state. Out of people who lived in different houses, 49% moved from different state.
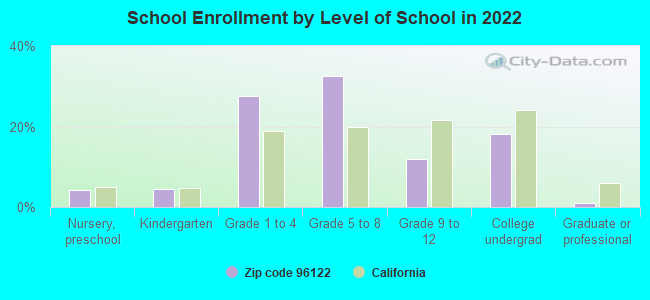
Private vs. public school enrollment:
Students in private schools in grades 1 to 8 (elementary and middle school): 100
Here:
23.1%
California:
10.5%
Students in private schools in grades 9 to 12 (high school): 6
Here:
7.0%
California:
8.5%
Students in private undergraduate colleges:
Here:
0.0%
California:
15.9%
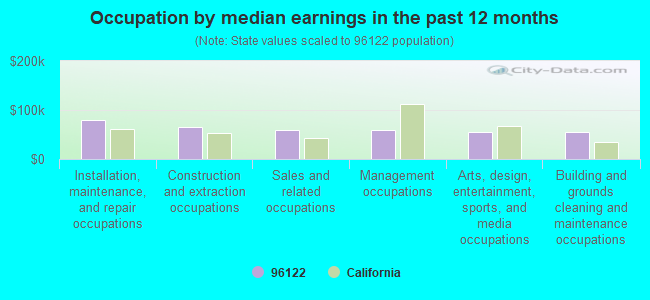
Occupation by median earnings in the past 12 months ($)
79,587Installation, maintenance, and repair occupations
65,477Construction and extraction occupations
58,851Sales and related occupations
58,409Management occupations
54,511Arts, design, entertainment, sports, and media occupations
54,140Building and grounds cleaning and maintenance occupations
Companies with federal contracts located in this zip code:
PLUMAS-SIERRA RURAL ELECTRIC C (73233 STATE RTE 70 STE A in PORTOLA, CA; small business) : $7,493,361 in 10 contractsfrom 2001 to 2006
Contracts for Electric Services by Army, Bureau of Prisoners/Federal Prison System Signed by year:2000: $0; 2001: $1,464,000; 2002: $0; 2003: $134,361; 2004: $2,175,000; 2005: $2,220,000; 2006: $1,500,000.
Biggest contracts:
$1,500,000 with Army for Electric Services. Signed on 2006-03-02. Completion date: 2004-03-01.
$1,500,000, same as above.Signed on 2004-02-26. Completion date: 2004-03-01.
$1,464,000 with Bureau of Prisoners/Federal Prison System for Electric Services. Signed on 2001-09-15. Completion date: 2008-12-15.
$1,200,000 with Army for Electric Services. Signed on 2005-03-01. Completion date: 2004-03-01.
RODNEY JONES TREE SERVICE (79525 WENDRILL COURT in PORTOLA, CA; small business) : $99,540 in 7 contractsfrom 2002 to 2004
Contracts for Landscaping/Groundskeeping Services, Other Housekeeping Services, Tree Thinning Services by Army Signed by year:2000: $0; 2001: $0; 2002: $28,500; 2003: $56,150; 2004: $14,890; 2005: $0; 2006: $0.
Biggest contracts:
$27,000 with Army for Landscaping/Groundskeeping Services. Signed on 2003-04-25. Completion date: 2003-12-31.
$24,350, same as above.Signed on 2003-12-17. Completion date: 2003-12-31.
$14,250, same as above.Signed on 2002-11-19. Completion date: 2003-01-31.
$14,250 with Army for Other Housekeeping Services. Signed on 2002-03-11. Completion date: 2002-03-31.
MIKE WIRTA LOGGING (970 CANDY LN in PORTOLA, CA; small business) 5 employees, $1000000 revenue.
$82,500 with Forest Service for Other Natural Resources and Conservation Services. Signed on 2002-11-15. Completion date: 2003-10-15.
Top industries in this zip code by the number of employees in 2005:
Health Care and Social Assistance: General Medical and Surgical Hospitals (250-499 employees: 1 establishment)
Construction: New Single-Family Housing Construction (except Operative Builders) (10-19: 1, 5-9: 1, 1-4: 12)
Finance and Insurance: Commercial Banking (10-19: 2, 5-9: 1)
Utilities: Electric Power Distribution (20-49: 1, 1-4: 1)
Construction: Commercial and Institutional Building Construction (20-49: 1)
Administrative and Support and Waste Management and Remediation Services: Landscaping Services (10-19: 1, 5-9: 1, 1-4: 1)
Accommodation and Food Services: Full-Service Restaurants (5-9: 2, 1-4: 3)
Health Care and Social Assistance: Offices of Physical, Occupational and Speech Therapists, and Audiologists (10-19: 1, 1-4: 1)
People in group quarters in 2010:
24 people in nursing facilities/skilled-nursing facilities
People in group quarters in 2000:
21 people in nursing homes
2006 - 2018 National Fire Incident Reporting System (NFIRS) incidents
According to the data from the years 2006 - 2018 the average number of fires per year is 15. The highest number of reported fire incidents - 47 took place in 2018, and the least - 0 in 2008. The data has a growing trend.
When looking into fire subcategories, the most reports belonged to: Outside Fires (53.8%), and Structure Fires (33.5%).
Fire incident types reported to NFIRS in Zip Code 96122


 Nearest zip codes: 96106, 96129, 96124, 96103, 96135, 96125.


 According to the data from the years 2006 - 2018 the average number of fires per year is 15. The highest number of reported fire incidents - 47 took place in 2018, and the least - 0 in 2008. The data has a growing trend.
 When looking into fire subcategories, the most reports belonged to: Outside Fires (53.8%), and Structure Fires (33.5%).