Estimated zip code population in 2022: 287 Zip code population in 2010: 554 Zip code population in 2000: 403
Houses and condos: 236 Renter-occupied apartments: 83
% of renters here:
52%
State:
36%
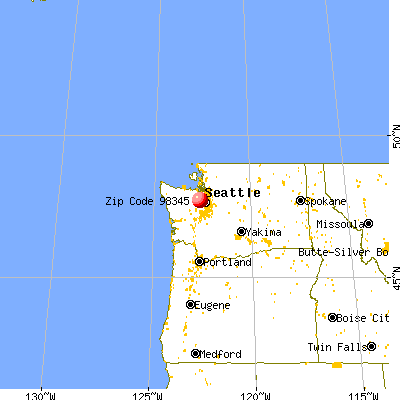
March 2022 cost of living index in zip code 98345: 104.5 (near average, U.S. average is 100)
Land area: 0.5 sq. mi. Water area: 0.2 sq. mi.
Population density: 584 people per square mile
(low).
OSM Map
General Map
Google Map
MSN Map
OSM Map
General Map
Google Map
MSN Map
OSM Map
General Map
Google Map
MSN Map
OSM Map
General Map
Google Map
MSN Map
Please wait while loading the map...
Real estate property taxes paid for housing units in 2022:
This zip code:
0.6% ($4,242)
Washington:
0.8% ($4,283)
Median real estate property taxes paid for housing units with mortgages in 2022: $3,899 (0.5%) Median real estate property taxes paid for housing units with no mortgage in 2022: $4,641 (0.6%)
Business Search- 14 Million verified businesses
Males: 161
(56.0%)
Females: 126
(44.0%)
For population 25 years and over in 98345:
High school or higher: 92.7%
Bachelor's degree or higher: 53.5%
Graduate or professional degree: 16.0%
Mean travel time to work (commute): 23.5 minutes
For population 15 years and over in 98345:
Never married: 25.1%
Now married: 58.2%
Separated: 0.0%
Widowed: 9.3%
Divorced: 7.4%
Zip code 98345 compared to state average:
Unemployed percentage significantly below state average.
Black race population percentage significantly below state average.
Hispanic race population percentage below state average.
Median age significantly above state average.
Foreign-born population percentage significantly below state average.
Length of stay since moving in significantly above state average.
Number of rooms per house below state average.
Number of college students significantly below state average.
Estimated median house/condo value in 2022: $722,401
98345:
$722,401
Washington:
$569,500
Median resident age:
This zip code:
57.6 years
Washington median age:
38.4 years
Average household size:
This zip code:
1.6 people
Washington:
2.5 people
Averages for the 2004 tax year for zip code 98345, filed in 2005:
Average Adjusted Gross Income (AGI) in 2004: $57,612 (Individual Income Tax Returns)
Here:
$57,612
State:
$54,331
Salary/wage: $49,650 (reported on 85.1% of returns)
Here:
$49,650
State:
$45,761
(% of AGI for various income ranges: 100.8% for AGIs below $10k, 71.0% for AGIs $10k-25k, 78.2% for AGIs $25k-50k, 78.8% for AGIs $50k-75k, 83.5% for AGIs $75k-100k, 60.4% for AGIs over 100k)
Taxable interest for individuals: $988 (reported on 58.8% of returns)
This zip code:
$988
Washington:
$2,110
(% of AGI for various income ranges: 8.2% for AGIs below $10k, 1.9% for AGIs $10k-25k, 0.7% for AGIs $25k-50k, 0.9% for AGIs $50k-75k, 0.8% for AGIs $75k-100k, 1.1% for AGIs over 100k)
Taxable dividends: $1,898 (reported on 30.7% of returns)
Here:
$1,898
State:
$5,879
(% of AGI for various income ranges: 5.3% for AGIs below $10k, 0.9% for AGIs $10k-25k, 2.1% for AGIs $25k-50k, 0.5% for AGIs $50k-75k, 0.4% for AGIs $75k-100k, 1.2% for AGIs over 100k)
Net capital gain/loss: +$8,172 (reported on 22.4% of returns)
Here:
+$8,172
State:
+$15,835
(% of AGI for various income ranges: 0.0% for AGIs below $10k, 1.2% for AGIs $25k-50k, 0.3% for AGIs $50k-75k, 0.4% for AGIs $75k-100k, 8.4% for AGIs over 100k)
Profit/loss from business: +$3,517 (reported on 11.0% of returns)
Here:
+$3,517
State:
+$13,994
(% of AGI for various income ranges: -24.3% for AGIs below $10k, -0.3% for AGIs $25k-50k, 0.2% for AGIs $50k-75k, 4.0% for AGIs $75k-100k)
Total itemized deductions: $17,665 (21% of AGI, reported on 42.8% of returns)
Here:
$17,665
State:
$19,669
Here:
21.0% of AGI
State:
20.7% of AGI
(% of AGI for various income ranges: 116.9% for AGIs below $10k, 15.0% for AGIs $25k-50k, 12.7% for AGIs $50k-75k, 15.5% for AGIs $75k-100k, 10.2% for AGIs over 100k)
Charity contributions deductions: $2,392 (3% of AGI, reported on 35.7% of returns)
Here:
$2,392
State:
$3,569
Here:
2.6% of AGI
State:
3.5% of AGI
(% of AGI for various income ranges: 1.3% for AGIs $25k-50k, 1.8% for AGIs $50k-75k, 2.3% for AGIs $75k-100k, 1.0% for AGIs over 100k)
Total tax: $8,155 (reported on 84.0% of returns)
98345:
$8,155
State:
$9,065
(% of AGI for various income ranges: 4.1% for AGIs below $10k, 3.9% for AGIs $10k-25k, 7.6% for AGIs $25k-50k, 10.9% for AGIs $50k-75k, 11.2% for AGIs $75k-100k, 16.1% for AGIs over 100k)
Earned income credit: $1,481 (reported on 9.9% of returns)
Here:
$1,481
State:
$1,607
Percentage of individuals using paid preparers for their 2004 taxes: 38.8%
Here:
39%
State:
49%
(% for various income ranges: 31.4% for AGIs below $10k, 42.5% for AGIs $10k-25k, 41.0% for AGIs $25k-50k, 41.6% for AGIs $50k-75k, 32.1% for AGIs $75k-100k, 40.6% for AGIs over 100k)
Household received Food Stamps/SNAP in the past 12 months: 0 Household did not receive Food Stamps/SNAP in the past 12 months: 159
Women who did not have a birth in the past 12 months: 58 (29 now married, 29 unmarried)
Housing units in zip code 98345 with a mortgage: 43 (15 second mortgage, 8 both second mortgage and home equity loan) Median monthly owner costs for units with a mortgage: $2,544 Median monthly owner costs for units without a mortgage: $755
Residents with income below the poverty level in 2022:
This zip code:
8.5%
Whole state:
10.0%
Median number of rooms in houses and condos:
Here:
7.5
State:
6.5
Median number of rooms in apartments:
Here:
3.4
State:
3.9
Notable locations in this zip code not listed on our city pages
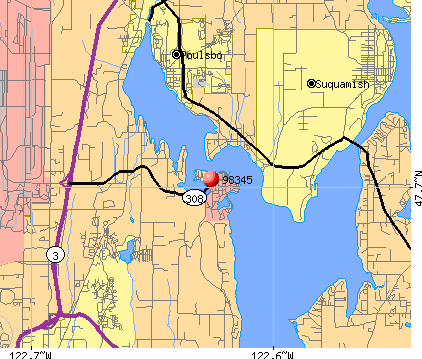
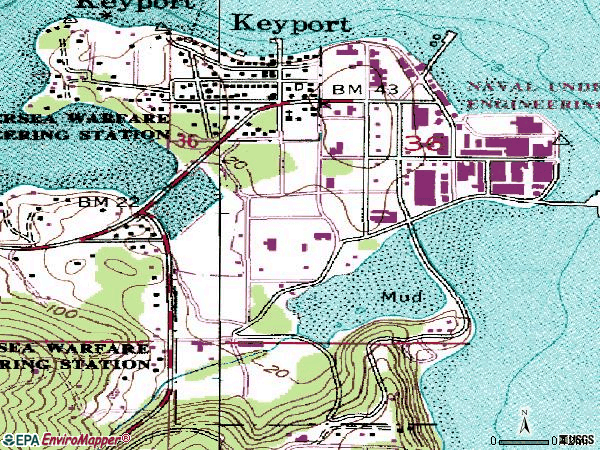
Notable locations in zip code 98345: Naval Region Northwest Fire and Emergency Services (A), Kitsap Fire District 18 Poulsbo Fire Department Station 73 Keyport (B), Naval Undersea Museum (C). Display/hide their locations on the map
In group quarters: 24 (-1 institutionalized population)
Size of family households: 66 2-persons, 16 3-persons
Size of nonfamily households: 79 1-person
88.2% of residents of 98345 zip code speak English at home.
11.5% of residents speak Spanish at home (100% very well).
Foreign born population: 0 (0.0%)
:
0.0%
Whole state:
15.3%
29%German
13%Scottish
13%English
11%European
7%Irish
6%Norwegian
5%British
55.6%Electricity
37.3%Utility gas
8.5%Fuel oil, kerosene, etc.
Place of birth for U.S.-born residents:
This state: 86
Northeast: 10
Midwest: 87
South: 14
West: 86
26% of the 98345 zip code residents lived in the same house 5 years ago. Out of people who lived in different houses, 40% lived in this county. Out of people who lived in different counties, 50% lived in Washington.
101% of the 98345 zip code residents lived in the same house 1 year ago.
Companies with federal contracts located in this zip code (KEYPORT, WA):
UNITED STATES DEPARTMENT OF TH (610 DOWELL ST) : $1,117,853 in 27 contractsfrom 2001 to 2006
Contracts for Electrical and Electronic Properties Measuring and Testing Instruments, Electrical and Electronic assemblies, Boards, Cards, and Associated Hardware, Miscellaneous Communication Equipment, Screws, and moreby Defense Logistics Agency Signed by year:2000: $0; 2001: $356,400; 2002: $83,649; 2003: $185,354; 2004: $295,744; 2005: $193,420; 2006: $3,286.
Biggest contracts:
$231,400 with Defense Logistics Agency for Electrical and Electronic Properties Measuring and Testing Instruments. Signed on 2001-12-03. Completion date: 2002-07-02.
$141,354 with Defense Logistics Agency for Electrical and Electronic assemblies, Boards, Cards, and Associated Hardware. Signed on 2003-12-19. Completion date: 2005-05-13.
$100,000 with Defense Logistics Agency for Electrical and Electronic Properties Measuring and Testing Instruments. Signed on 2001-12-03. Completion date: 2002-07-11.
$85,624 with Defense Logistics Agency for Miscellaneous Communication Equipment. Signed on 2004-01-13. Completion date: 2004-12-11.
NAVAL UNDERSEA MUSEUM FOUNDATI (GARNETT WAY)
$500,000 with Navy for Education Services. Signed on 2005-06-30. Completion date: 2005-09-30.
NAVY, UNITED STATES DEPARTMENT (610 DOWELL ST C13121) : $152,187 in 3 contractsfrom 1999 to 2000
$72,623 with Defense Logistics Agency for Switches. Signed on 1999-12-14. Completion date: 2000-07-21.
$51,045 with Defense Logistics Agency for Connectors, Electrical. Signed on 2000-12-08. Completion date: 2001-06-30.
$28,519 with Defense Logistics Agency for Electrical and Electronic assemblies, Boards, Cards, and Associated Hardware. Signed on 2000-03-23. Completion date: 2000-10-31.
TEAM ONE USA INC (1844 POULSBO AVE; small business)
$58,000 with Navy for Marine Charter for Things. Signed on 2001-03-09. Completion date: 2001-04-20.
Top industries in this zip code by the number of employees in 2005:
Real Estate and Rental and Leasing: Residential Property Managers (20-49 employees: 1 establishment, 1-4 employees: 1 establishment)
Accommodation and Food Services: Full-Service Restaurants (20-49: 1)
Accommodation and Food Services: Food Service Contractors (5-9: 1)
Construction: New Single-Family Housing Construction (except Operative Builders) (5-9: 1)
Information: Data Processing, Hosting, and Related Services (5-9: 1)
Other Services (except Public Administration): General Automotive Repair (5-9: 1)
Finance and Insurance: Credit Unions (1-4: 1)
Real Estate and Rental and Leasing: Lessors of Residential Buildings and Dwellings (1-4: 1)
Other Services (except Public Administration): Beauty Salons (1-4: 1)
Arts, Entertainment, and Recreation: Museums (1-4: 1)
People in group quarters in 2000:
33 people in military barracks, etc.
Home Mortgage Disclosure Act Aggregated Statistics For Year 2009 (Based on 2 partial tracts)
A) FHA, FSA/RHS & VA Home Purchase Loans
B) Conventional Home Purchase Loans
C) Refinancings
D) Home Improvement Loans
F) Non-occupant Loans on < 5 Family Dwellings (A B C & D)
G) Loans On Manufactured Home Dwelling (A B C & D)
Number
Average Value
Number
Average Value
Number
Average Value
Number
Average Value
Number
Average Value
Number
Average Value
LOANS ORIGINATED
1
$378,800
2
$285,530
17
$269,029
1
$144,440
1
$169,170
1
$140,790
APPLICATIONS APPROVED, NOT ACCEPTED
0
$0
0
$0
1
$324,630
0
$0
0
$0
0
$0
APPLICATIONS DENIED
0
$0
0
$0
4
$306,078
1
$86,020
0
$0
0
$0
APPLICATIONS WITHDRAWN
0
$0
0
$0
3
$219,720
0
$0
0
$0
0
$0
FILES CLOSED FOR INCOMPLETENESS
0
$0
0
$0
1
$205,460
0
$0
0
$0
0
$0
Aggregated Statistics For Year 2008 (Based on 2 partial tracts)
A) FHA, FSA/RHS & VA Home Purchase Loans
B) Conventional Home Purchase Loans
C) Refinancings
D) Home Improvement Loans
F) Non-occupant Loans on < 5 Family Dwellings (A B C & D)
G) Loans On Manufactured Home Dwelling (A B C & D)
Number
Average Value
Number
Average Value
Number
Average Value
Number
Average Value
Number
Average Value
Number
Average Value
LOANS ORIGINATED
1
$318,040
3
$272,493
10
$243,465
2
$115,010
2
$165,530
1
$199,210
APPLICATIONS APPROVED, NOT ACCEPTED
0
$0
1
$125,080
1
$338,260
0
$0
0
$0
0
$0
APPLICATIONS DENIED
1
$139,750
0
$0
5
$243,526
2
$171,085
1
$172,300
0
$0
APPLICATIONS WITHDRAWN
0
$0
0
$0
2
$289,085
0
$0
0
$0
0
$0
FILES CLOSED FOR INCOMPLETENESS
0
$0
0
$0
0
$0
0
$0
0
$0
0
$0
Aggregated Statistics For Year 2007 (Based on 2 partial tracts)
A) FHA, FSA/RHS & VA Home Purchase Loans
B) Conventional Home Purchase Loans
C) Refinancings
D) Home Improvement Loans
F) Non-occupant Loans on < 5 Family Dwellings (A B C & D)
G) Loans On Manufactured Home Dwelling (A B C & D)
Number
Average Value
Number
Average Value
Number
Average Value
Number
Average Value
Number
Average Value
Number
Average Value
LOANS ORIGINATED
1
$188,180
5
$271,546
13
$252,301
2
$132,240
1
$313,870
2
$137,665
APPLICATIONS APPROVED, NOT ACCEPTED
0
$0
0
$0
2
$330,970
0
$0
0
$0
0
$0
APPLICATIONS DENIED
0
$0
1
$287,050
4
$276,718
1
$210,400
0
$0
1
$82,200
APPLICATIONS WITHDRAWN
0
$0
1
$160,840
2
$308,965
1
$154,760
0
$0
0
$0
FILES CLOSED FOR INCOMPLETENESS
0
$0
0
$0
0
$0
0
$0
0
$0
0
$0
Aggregated Statistics For Year 2006 (Based on 2 partial tracts)
A) FHA, FSA/RHS & VA Home Purchase Loans
B) Conventional Home Purchase Loans
C) Refinancings
D) Home Improvement Loans
F) Non-occupant Loans on < 5 Family Dwellings (A B C & D)
G) Loans On Manufactured Home Dwelling (A B C & D)
Number
Average Value
Number
Average Value
Number
Average Value
Number
Average Value
Number
Average Value
Number
Average Value
LOANS ORIGINATED
1
$143,220
9
$236,646
11
$212,313
3
$97,967
1
$258,140
1
$91,920
APPLICATIONS APPROVED, NOT ACCEPTED
0
$0
1
$125,340
2
$196,600
1
$18,750
0
$0
0
$0
APPLICATIONS DENIED
0
$0
1
$269,690
4
$185,970
1
$126,900
0
$0
1
$105,900
APPLICATIONS WITHDRAWN
0
$0
1
$159,190
2
$231,800
0
$0
0
$0
0
$0
FILES CLOSED FOR INCOMPLETENESS
0
$0
0
$0
1
$161,190
0
$0
0
$0
0
$0
Aggregated Statistics For Year 2005 (Based on 2 partial tracts)
A) FHA, FSA/RHS & VA Home Purchase Loans
B) Conventional Home Purchase Loans
C) Refinancings
D) Home Improvement Loans
F) Non-occupant Loans on < 5 Family Dwellings (A B C & D)
G) Loans On Manufactured Home Dwelling (A B C & D)
Number
Average Value
Number
Average Value
Number
Average Value
Number
Average Value
Number
Average Value
Number
Average Value
LOANS ORIGINATED
1
$221,340
9
$231,737
15
$205,363
2
$105,160
1
$196,250
1
$189,480
APPLICATIONS APPROVED, NOT ACCEPTED
0
$0
1
$190,790
2
$192,090
0
$0
0
$0
0
$0
APPLICATIONS DENIED
0
$0
2
$229,410
5
$195,960
1
$103,990
0
$0
1
$267,000
APPLICATIONS WITHDRAWN
0
$0
1
$130,460
6
$228,168
1
$93,740
0
$0
0
$0
FILES CLOSED FOR INCOMPLETENESS
0
$0
0
$0
2
$183,020
0
$0
0
$0
0
$0
Aggregated Statistics For Year 2004 (Based on 2 partial tracts)
A) FHA, FSA/RHS & VA Home Purchase Loans
B) Conventional Home Purchase Loans
C) Refinancings
D) Home Improvement Loans
F) Non-occupant Loans on < 5 Family Dwellings (A B C & D)
G) Loans On Manufactured Home Dwelling (A B C & D)
Number
Average Value
Number
Average Value
Number
Average Value
Number
Average Value
Number
Average Value
Number
Average Value
LOANS ORIGINATED
1
$94,090
9
$197,306
15
$167,947
1
$49,820
1
$148,250
2
$114,360
APPLICATIONS APPROVED, NOT ACCEPTED
0
$0
1
$224,380
3
$129,043
1
$26,820
0
$0
0
$0
APPLICATIONS DENIED
0
$0
2
$167,785
4
$171,538
1
$50,520
0
$0
0
$0
APPLICATIONS WITHDRAWN
0
$0
1
$218,910
3
$160,263
1
$38,800
0
$0
0
$0
FILES CLOSED FOR INCOMPLETENESS
0
$0
0
$0
1
$171,260
0
$0
0
$0
0
$0
Aggregated Statistics For Year 2003 (Based on 2 partial tracts)
A) FHA, FSA/RHS & VA Home Purchase Loans
B) Conventional Home Purchase Loans
C) Refinancings
D) Home Improvement Loans
F) Non-occupant Loans on < 5 Family Dwellings (A B C & D)
Number
Average Value
Number
Average Value
Number
Average Value
Number
Average Value
Number
Average Value
LOANS ORIGINATED
2
$136,405
7
$176,687
36
$161,414
2
$46,525
2
$166,265
APPLICATIONS APPROVED, NOT ACCEPTED
0
$0
1
$132,020
2
$140,575
0
$0
0
$0
APPLICATIONS DENIED
0
$0
0
$0
5
$155,458
1
$31,510
1
$86,630
APPLICATIONS WITHDRAWN
0
$0
0
$0
5
$145,042
0
$0
0
$0
FILES CLOSED FOR INCOMPLETENESS
0
$0
0
$0
1
$103,730
0
$0
0
$0
Aggregated Statistics For Year 2002 (Based on 2 partial tracts)
A) FHA, FSA/RHS & VA Home Purchase Loans
B) Conventional Home Purchase Loans
C) Refinancings
D) Home Improvement Loans
F) Non-occupant Loans on < 5 Family Dwellings (A B C & D)
Number
Average Value
Number
Average Value
Number
Average Value
Number
Average Value
Number
Average Value
LOANS ORIGINATED
1
$177,420
6
$193,303
23
$163,093
1
$20,140
1
$89,840
APPLICATIONS APPROVED, NOT ACCEPTED
0
$0
1
$84,110
2
$167,090
0
$0
0
$0
APPLICATIONS DENIED
0
$0
1
$106,590
4
$123,712
0
$0
0
$0
APPLICATIONS WITHDRAWN
0
$0
0
$0
3
$158,440
0
$0
0
$0
FILES CLOSED FOR INCOMPLETENESS
0
$0
0
$0
1
$209,620
0
$0
0
$0
Aggregated Statistics For Year 2001 (Based on 2 partial tracts)
A) FHA, FSA/RHS & VA Home Purchase Loans
B) Conventional Home Purchase Loans
C) Refinancings
D) Home Improvement Loans
F) Non-occupant Loans on < 5 Family Dwellings (A B C & D)
Number
Average Value
Number
Average Value
Number
Average Value
Number
Average Value
Number
Average Value
LOANS ORIGINATED
2
$119,435
5
$182,090
15
$147,977
2
$18,790
1
$168,830
APPLICATIONS APPROVED, NOT ACCEPTED
0
$0
1
$132,370
1
$159,890
0
$0
0
$0
APPLICATIONS DENIED
0
$0
1
$94,090
3
$137,290
0
$0
0
$0
APPLICATIONS WITHDRAWN
0
$0
1
$66,230
3
$126,177
1
$21,350
0
$0
FILES CLOSED FOR INCOMPLETENESS
0
$0
0
$0
1
$89,920
0
$0
0
$0
Aggregated Statistics For Year 2000 (Based on 2 partial tracts)
A) FHA, FSA/RHS & VA Home Purchase Loans
B) Conventional Home Purchase Loans
C) Refinancings
D) Home Improvement Loans
Number
Average Value
Number
Average Value
Number
Average Value
Number
Average Value
LOANS ORIGINATED
1
$208,060
5
$151,328
3
$112,347
3
$17,390
APPLICATIONS APPROVED, NOT ACCEPTED
0
$0
0
$0
1
$164,400
0
$0
APPLICATIONS DENIED
0
$0
0
$0
2
$127,335
1
$16,230
APPLICATIONS WITHDRAWN
0
$0
1
$70,480
2
$79,075
0
$0
FILES CLOSED FOR INCOMPLETENESS
0
$0
0
$0
1
$274,460
0
$0
Aggregated Statistics For Year 1999 (Based on 1 partial tract)


 Nearest zip codes: 98370, 98311, 98392, 98315, 98383, 98110.


 : $1,117,853 in 27 contracts from 2001 to 2006


