Estimated zip code population in 2022: 31,173 Zip code population in 2010: 28,130 Zip code population in 2000: 24,173
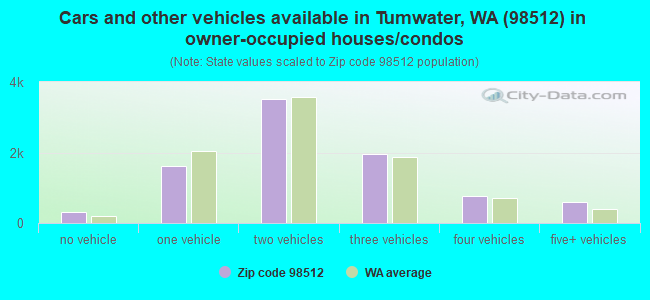
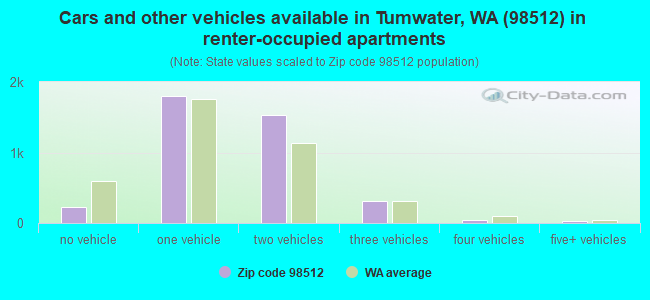
Houses and condos: 13,268 Renter-occupied apartments: 3,942
% of renters here:
31%
State:
36%
March 2022 cost of living index in zip code 98512: 107.5 (more than average, U.S. average is 100)
Land area: 150.3 sq. mi. Water area: 1.9 sq. mi.
Population density: 207 people per square mile
(very low).
OSM Map
General Map
Google Map
MSN Map
OSM Map
General Map
Google Map
MSN Map
OSM Map
General Map
Google Map
MSN Map
OSM Map
General Map
Google Map
MSN Map
Please wait while loading the map...
Real estate property taxes paid for housing units in 2022:
This zip code:
0.9% ($4,310)
Washington:
0.8% ($4,283)
Median real estate property taxes paid for housing units with mortgages in 2022: $4,546 (0.9%) Median real estate property taxes paid for housing units with no mortgage in 2022: $3,584 (0.9%)
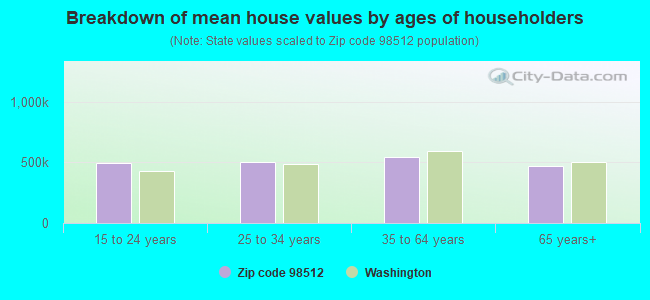
Estimated median house/condo value in 2022: $487,576
98512:
$487,576
Washington:
$569,500
According to our research of Washington and other state lists, there were 16 registered sex offenders living in 98512 zip code as of June 16, 2024. The ratio of all residents to sex offenders in zip code 98512 is 1,881 to 1. The ratio of registered sex offenders to all residents in this zip code is lower than the state average.
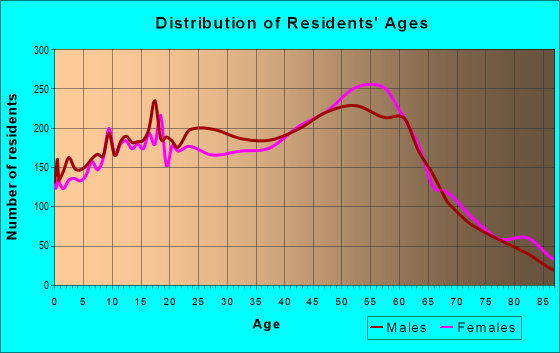
Median resident age:
This zip code:
41.3 years
Washington median age:
38.4 years
Average household size:
This zip code:
2.4 people
Washington:
2.5 people
Averages for the 2020 tax year for zip code 98512, filed in 2021:
Average Adjusted Gross Income (AGI) in 2020: $76,081 (Individual Income Tax Returns)
Here:
$76,081
State:
$99,264
Salary/wage: $63,866 (reported on 79.7% of returns)
Here:
$63,866
State:
$80,347
(% of AGI for various income ranges: 1130.5% for AGIs below $25k, 3285.0% for AGIs $25k-50k, 6006.2% for AGIs $50k-75k, 8760.2% for AGIs $75k-100k, 16629.8% for AGIs $100k-200k, 57357.3% for AGIs over 200k)
Taxable interest for individuals: $1,125 (reported on 38.2% of returns)
This zip code:
$1,125
Washington:
$2,077
(% of AGI for various income ranges: 16.9% for AGIs below $25k, 25.1% for AGIs $25k-50k, 53.7% for AGIs $50k-75k, 62.1% for AGIs $75k-100k, 91.0% for AGIs $100k-200k, 859.5% for AGIs over 200k)
Ordinary dividends: $4,955 (reported on 19.0% of returns)
Here:
$4,955
State:
$10,013
(% of AGI for various income ranges: 23.4% for AGIs below $25k, 29.7% for AGIs $25k-50k, 81.8% for AGIs $50k-75k, 109.4% for AGIs $75k-100k, 259.1% for AGIs $100k-200k, 2388.6% for AGIs over 200k)
Net capital gain/loss in AGI: +$19,611 (reported on 17.9% of returns)
Here:
+$19,611
State:
+$40,092
(% of AGI for various income ranges: 13.4% for AGIs below $25k, 30.5% for AGIs $25k-50k, 84.9% for AGIs $50k-75k, 142.3% for AGIs $75k-100k, 591.5% for AGIs $100k-200k, 17146.8% for AGIs over 200k)
Profit/loss from business: +$15,957 (reported on 12.1% of returns)
Here:
+$15,957
State:
+$18,312
(% of AGI for various income ranges: 65.3% for AGIs below $25k, 90.0% for AGIs $25k-50k, 131.6% for AGIs $50k-75k, 280.2% for AGIs $75k-100k, 494.5% for AGIs $100k-200k, 4551.8% for AGIs over 200k)
Taxable individual retirement arrangement distribution: $21,175 (reported on 8.5% of returns)
98512:
$21,175
Washington:
$24,221
(% of AGI for various income ranges: 43.7% for AGIs below $25k, 77.3% for AGIs $25k-50k, 149.4% for AGIs $50k-75k, 288.4% for AGIs $75k-100k, 642.8% for AGIs $100k-200k, 2705.0% for AGIs over 200k)
Self-employed (Keogh) retirement plans: $20,517 (reported on 0.4% of returns)
98512:
$20,517
Washington:
$24,166
(% of AGI for various income ranges: 19.8% for AGIs $100k-200k, 404.5% for AGIs over 200k)
Total itemized deductions: $30,315 (reported on 9.5% of returns)
Here:
$30,315
State:
$39,068
(% of AGI for various income ranges: 66.3% for AGIs below $25k, 121.5% for AGIs $25k-50k, 303.8% for AGIs $50k-75k, 471.6% for AGIs $75k-100k, 845.6% for AGIs $100k-200k, 5355.5% for AGIs over 200k)
Charity contributions: $8,599 (reported on 6.9% of returns)
Here:
$8,599
State:
$15,331
(% of AGI for various income ranges: 3.7% for AGIs below $25k, 9.5% for AGIs $25k-50k, 33.8% for AGIs $50k-75k, 60.8% for AGIs $75k-100k, 166.6% for AGIs $100k-200k, 1910.0% for AGIs over 200k)
Taxes paid: $6,997 (reported on 9.3% of returns)
98512:
$6,997
State:
$7,774
(% of AGI for various income ranges: 9.6% for AGIs below $25k, 22.8% for AGIs $25k-50k, 71.6% for AGIs $50k-75k, 113.6% for AGIs $75k-100k, 218.7% for AGIs $100k-200k, 1051.8% for AGIs over 200k)
Earned income credit: $1,869 (reported on 9.5% of returns)
Here:
$1,869
State:
$2,020
(% of AGI for various income ranges: 57.3% for AGIs below $25k, 41.3% for AGIs $25k-50k, 0.7% for AGIs $50k-75k)
Percentage of individuals using paid preparers for their 2020 taxes: 93.1%
Here:
93%
State:
93%
(% for various income ranges: 91.7% for AGIs below $25k, 93.6% for AGIs $25k-50k, 94.5% for AGIs $50k-75k, 92.9% for AGIs $75k-100k, 92.6% for AGIs $100k-200k, 94.2% for AGIs over 200k)
Averages for the 2012 tax year for zip code 98512, filed in 2013:
Average Adjusted Gross Income (AGI) in 2012: $59,398 (Individual Income Tax Returns)
Here:
$59,398
State:
$69,533
Salary/wage: $50,614 (reported on 83.6% of returns)
Here:
$50,614
State:
$57,267
(% of AGI for various income ranges: 73.7% for AGIs below $25k, 78.7% for AGIs $25k-50k, 77.5% for AGIs $50k-75k, 74.6% for AGIs $75k-100k, 75.9% for AGIs $100k-200k, 40.5% for AGIs over 200k)
Taxable interest for individuals: $1,163 (reported on 40.1% of returns)
This zip code:
$1,163
Washington:
$1,816
(% of AGI for various income ranges: 1.3% for AGIs below $25k, 0.7% for AGIs $25k-50k, 0.6% for AGIs $50k-75k, 0.7% for AGIs $75k-100k, 0.7% for AGIs $100k-200k, 1.2% for AGIs over 200k)
Ordinary dividends: $4,108 (reported on 19.3% of returns)
Here:
$4,108
State:
$8,163
(% of AGI for various income ranges: 1.6% for AGIs below $25k, 1.0% for AGIs $25k-50k, 1.0% for AGIs $50k-75k, 1.0% for AGIs $75k-100k, 1.3% for AGIs $100k-200k, 2.5% for AGIs over 200k)
Net capital gain/loss in AGI: +$7,434 (reported on 15.0% of returns)
Here:
+$7,434
State:
+$21,568
(% of AGI for various income ranges: 0.1% for AGIs $25k-50k, 0.2% for AGIs $50k-75k, 0.6% for AGIs $75k-100k, 1.2% for AGIs $100k-200k, 9.6% for AGIs over 200k)
Profit/loss from business: +$14,701 (reported on 12.6% of returns)
Here:
+$14,701
State:
+$16,521
(% of AGI for various income ranges: 5.3% for AGIs below $25k, 2.9% for AGIs $25k-50k, 2.9% for AGIs $50k-75k, 2.7% for AGIs $75k-100k, 2.5% for AGIs $100k-200k, 4.5% for AGIs over 200k)
Taxable individual retirement arrangement distribution: $14,258 (reported on 9.1% of returns)
98512:
$14,258
Washington:
$18,648
(% of AGI for various income ranges: 2.4% for AGIs below $25k, 1.9% for AGIs $25k-50k, 1.5% for AGIs $50k-75k, 2.6% for AGIs $75k-100k, 2.4% for AGIs $100k-200k, 2.2% for AGIs over 200k)
Self-employment retirement plans: $15,512 (reported on 0.6% of returns)
98512:
$15,512
Washington:
$20,087
(% of AGI for various income ranges: 0.2% for AGIs $25k-50k, 0.1% for AGIs $100k-200k, 0.7% for AGIs over 200k)
Total itemized deductions: $20,845 (21% of AGI, reported on 35.4% of returns)
Here:
$20,845
State:
$23,872
Here:
21.0% of AGI
State:
18.2% of AGI
(% of AGI for various income ranges: 10.6% for AGIs below $25k, 10.9% for AGIs $25k-50k, 13.2% for AGIs $50k-75k, 14.3% for AGIs $75k-100k, 13.5% for AGIs $100k-200k, 9.7% for AGIs over 200k)
Charity contributions: $3,152 (reported on 27.6% of returns)
Here:
$3,152
State:
$4,465
(% of AGI for various income ranges: 0.7% for AGIs below $25k, 0.9% for AGIs $25k-50k, 1.2% for AGIs $50k-75k, 1.7% for AGIs $75k-100k, 1.8% for AGIs $100k-200k, 1.8% for AGIs over 200k)
Taxes paid: $5,528 (reported on 35.1% of returns)
98512:
$5,528
State:
$6,400
(% of AGI for various income ranges: 2.1% for AGIs below $25k, 2.5% for AGIs $25k-50k, 3.3% for AGIs $50k-75k, 3.8% for AGIs $75k-100k, 3.8% for AGIs $100k-200k, 2.8% for AGIs over 200k)
Earned income credit: $1,857 (reported on 13.3% of returns)
Here:
$1,857
State:
$2,073
(% of AGI for various income ranges: 4.4% for AGIs below $25k, 0.8% for AGIs $25k-50k)
Percentage of individuals using paid preparers for their 2012 taxes: 36.2%
Here:
36%
State:
43%
(% for various income ranges: 29.7% for AGIs below $25k, 34.4% for AGIs $25k-50k, 38.9% for AGIs $50k-75k, 39.9% for AGIs $75k-100k, 42.4% for AGIs $100k-200k, 76.9% for AGIs over 200k)
Averages for the 2004 tax year for zip code 98512, filed in 2005:
Average Adjusted Gross Income (AGI) in 2004: $49,239 (Individual Income Tax Returns)
Here:
$49,239
State:
$54,331
Salary/wage: $43,875 (reported on 84.9% of returns)
Here:
$43,875
State:
$45,761
(% of AGI for various income ranges: 121.2% for AGIs below $10k, 72.2% for AGIs $10k-25k, 80.9% for AGIs $25k-50k, 80.8% for AGIs $50k-75k, 82.5% for AGIs $75k-100k, 63.9% for AGIs over 100k)
Taxable interest for individuals: $1,330 (reported on 50.4% of returns)
This zip code:
$1,330
Washington:
$2,110
(% of AGI for various income ranges: 5.4% for AGIs below $10k, 2.4% for AGIs $10k-25k, 1.2% for AGIs $25k-50k, 1.0% for AGIs $50k-75k, 0.9% for AGIs $75k-100k, 1.6% for AGIs over 100k)
Taxable dividends: $2,447 (reported on 24.5% of returns)
Here:
$2,447
State:
$5,879
(% of AGI for various income ranges: 3.8% for AGIs below $10k, 1.6% for AGIs $10k-25k, 1.1% for AGIs $25k-50k, 0.8% for AGIs $50k-75k, 0.7% for AGIs $75k-100k, 1.6% for AGIs over 100k)
Net capital gain/loss: +$9,773 (reported on 19.7% of returns)
Here:
+$9,773
State:
+$15,835
(% of AGI for various income ranges: 0.6% for AGIs below $10k, 0.2% for AGIs $10k-25k, 0.5% for AGIs $25k-50k, 0.7% for AGIs $50k-75k, 1.2% for AGIs $75k-100k, 10.8% for AGIs over 100k)
Profit/loss from business: +$13,931 (reported on 13.5% of returns)
Here:
+$13,931
State:
+$13,994
(% of AGI for various income ranges: -2.4% for AGIs below $10k, 4.9% for AGIs $10k-25k, 2.0% for AGIs $25k-50k, 2.9% for AGIs $50k-75k, 2.7% for AGIs $75k-100k, 6.2% for AGIs over 100k)
IRA payment deduction: $2,984 (reported on 2.7% of returns)
98512:
$2,984
Washington:
$3,001
(% of AGI for various income ranges: 0.2% for AGIs $10k-25k, 0.3% for AGIs $25k-50k, 0.2% for AGIs $50k-75k, 0.1% for AGIs $75k-100k, 0.1% for AGIs over 100k)
Self-employed pension: $10,865 (reported on 0.8% of returns)
Here:
$10,865
Washington:
$14,244
(% of AGI for various income ranges: 0.1% for AGIs $25k-50k, 0.1% for AGIs $50k-75k, 0.1% for AGIs $75k-100k, 0.4% for AGIs over 100k)
Total itemized deductions: $17,279 (22% of AGI, reported on 38.8% of returns)
Here:
$17,279
State:
$19,669
Here:
22.0% of AGI
State:
20.7% of AGI
(% of AGI for various income ranges: 13.0% for AGIs below $10k, 10.9% for AGIs $10k-25k, 12.5% for AGIs $25k-50k, 15.7% for AGIs $50k-75k, 16.0% for AGIs $75k-100k, 12.1% for AGIs over 100k)
Charity contributions deductions: $2,587 (3% of AGI, reported on 33.1% of returns)
Here:
$2,587
State:
$3,569
Here:
3.1% of AGI
State:
3.5% of AGI
(% of AGI for various income ranges: 0.6% for AGIs below $10k, 0.9% for AGIs $10k-25k, 1.1% for AGIs $25k-50k, 1.7% for AGIs $50k-75k, 2.0% for AGIs $75k-100k, 2.2% for AGIs over 100k)
Total tax: $6,756 (reported on 81.1% of returns)
98512:
$6,756
State:
$9,065
(% of AGI for various income ranges: 3.1% for AGIs below $10k, 4.6% for AGIs $10k-25k, 7.2% for AGIs $25k-50k, 9.0% for AGIs $50k-75k, 10.2% for AGIs $75k-100k, 17.2% for AGIs over 100k)
Earned income credit: $1,488 (reported on 10.1% of returns)
Here:
$1,488
State:
$1,607
Percentage of individuals using paid preparers for their 2004 taxes: 43.7%
Here:
44%
State:
49%
(% for various income ranges: 35.7% for AGIs below $10k, 44.0% for AGIs $10k-25k, 43.8% for AGIs $25k-50k, 45.7% for AGIs $50k-75k, 43.2% for AGIs $75k-100k, 52.7% for AGIs over 100k)
Likely homosexual households (counted as self-reported same-sex unmarried-partner households)
Lesbian couples: 0.5% of all households
Gay men: 0.6% of all households
Household received Food Stamps/SNAP in the past 12 months: 1,331 Household did not receive Food Stamps/SNAP in the past 12 months: 11,420
Women who had a birth in the past 12 months: 289 (178 now married, 104 unmarried) Women who did not have a birth in the past 12 months: 7,156 (3,176 now married, 3,980 unmarried)
Housing units in zip code 98512 with a mortgage: 5,847 (715 second mortgage, 68 home equity loan, 630 both second mortgage and home equity loan) Houses without a mortgage: 149
Median monthly owner costs for units with a mortgage: $2,050 Median monthly owner costs for units without a mortgage: $705
Residents with income below the poverty level in 2022:
This zip code:
7.8%
Whole state:
10.0%
Residents with income below 50% of the poverty level in 2022:
This zip code:
3.0%
Whole state:
4.6%
Median number of rooms in houses and condos:
Here:
6.3
State:
6.5
Median number of rooms in apartments:
Here:
4.4
State:
3.9
Notable locations in this zip code not listed on our city pages
Notable locations in zip code 98512: Rutledge Farm (A), Olympia Substation (B), Capitol Peak Lookout (C), Fall Creek Campground (D), Sherman Valley Campground (E), Bordeaux Campground (F), Mount Molly Campground (G), Margaret McKenny Campground (H), Yew Tree Campground (I), Middle Waddel Campground (J), Mina Falls Trailhead Campground (K), Cedar Creek State Correction Center (L), Thurston County Fire Protection District 11 (M), Thurston Co Fire District 11 station 5 (N), Thurston Co Fire District 11 station 4 (O), Thurston County District 5 Black Lake Station 51 (P), Thurston County Fire District 5 Station 52 (Q), Thurston County Fire District 6 Station 63 (R), Tumwater Fire Department Station 2 (S), Thurston County Fire Protection District 5 Black Lake Fire Station (T). Display/hide their locations on the map
Creeks: Fall Creek (A), Monroe Creek (B), Perry Creek (C), Swift Creek (D), Camp Seven Creek (E), Phantom Creek (F), Beatty Creek (G), Beaver Creek (H), Dempsey Creek (I). Display/hide their locations on the map
Parks in zip code 98512 include: Black River Habitat Management Area (1), Millersylvania State Park (2), Mima Mounds Natural Area (3). Display/hide their locations on the map
3,646 married couples with children.
1,388 single-parent households (459 men, 929 women).
90.9% of residents of 98512 zip code speak English at home.
3.4% of residents speak Spanish at home (81% very well, 14% well, 5% not well).
1.9% of residents speak other Indo-European language at home (86% very well, 12% well, 2% not well).
2.8% of residents speak Asian or Pacific Island language at home (37% very well, 28% well, 31% not well, 4% not at all).
0.5% of residents speak other language at home (71% very well, 29% well).
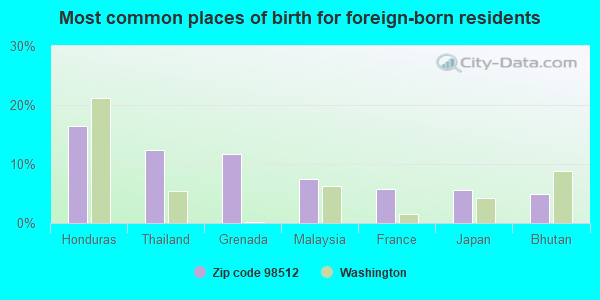
Foreign born population: 1,940 (6.2%) (69.9% of them are naturalized citizens)
This zip code:
6.2%
Whole state:
15.3%
16%Honduras
12%Thailand
12%Grenada
7%Malaysia
6%France
6%Japan
5%Bhutan
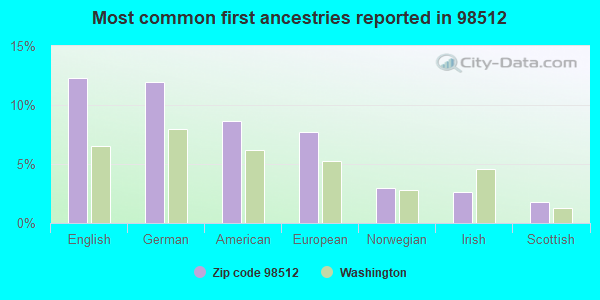
12%English
12%German
9%American
8%European
3%Norwegian
3%Irish
2%Scottish
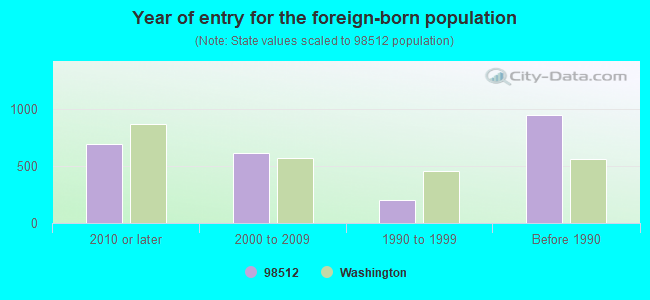
Year of entry for the foreign-born population
6892010 or later
6152000 to 2009
2031990 to 1999
944Before 1990
Major facilities with environmental interests located in this zip code:
COLUMBIA BEVERAGE CO (3003 RW JOHNSON BLVD in TUMWATER, WA)
National Pollutant Discharge Elimination System NON-MAJOR (Tracking pollutant discharge elimination systems) - permit Conditionally Exempt Small Quantity Generators, less than 100 kg/month of hazardous waste (Resource Conservation and Recovery Act (tracking hazardous waste)) - notification TRI REPORTER (Tracking of toxic chemicals releasing facilities) STATE MASTER (Washington State Department of Ecology's Facility/Site identification system) - HAZWASTE-WAD988476891, HAZARDOUS WASTE PROGRAM, CESQG, EPCRA, TRI REPORTER Business SIC classification: BOTTLED AND CANNED SOFT DRINKS AND CARBONATED WATERS Business NAICS classification: SOFT DRINK MANUFACTURING.; SOFT DRINK MANUFACTURING.
AMERICAN FIBERGLASS (8904 KIMMIE RD in TUMWATER, WA)
(Resource Conservation and Recovery Act (tracking hazardous waste)) STATE MASTER (Washington State Department of Ecology's Facility/Site identification system) - TOXICS-, GROUND WATER PROGRAM Business SIC classification: BROADWOVEN FABRIC MILLS, MANMADE FIBER AND SILK; PIECE GOODS, NOTIONS, AND OTHER DRY GOODS; NONCLASSIFIABLE ESTABLISHMENTS Business NAICS classification: ALL OTHER PLASTICS PRODUCT MANUFACTURING. Organizations: JACK MCCOLLAM AMER FIBERGLASS (CONTACT/ HAZARDOUS WASTE)
AMERICAN PACIFIC SUPPLY INC (2780 29TH AVE SW in TUMWATER, WA)
(Resource Conservation and Recovery Act (tracking hazardous waste)) STATE MASTER (Washington State Department of Ecology's Facility/Site identification system) - TOXICS-, UNDERGROUND STORAGE TANK PROGRAM Business SIC classification: ROOFING, SIDING, AND INSULATION MATERIALS Alternative names: HARRISON BUILDING SUPPLY
BERSCHAUER PHILLIPS CONSTRUCTION (2806 29TH AVE SW STE A in TUMWATER, WA)
(Resource Conservation and Recovery Act (tracking hazardous waste)) STATE MASTER (Washington State Department of Ecology's Facility/Site identification system) - HAZWASTE-WAD988520474, HAZARDOUS WASTE PROGRAM Business SIC classification: GENERAL CONTRACTORS-NONRESIDENTIAL BUILDINGS, OTHER THAN INDUSTRIAL BUILDINGS AND WAREHOUSES
ANDY JOHNSON & CO INC (2450 MOTTMAN RD SW in TUMWATER, WA)
(Resource Conservation and Recovery Act (tracking hazardous waste)) STATE MASTER (Washington State Department of Ecology's Facility/Site identification system) - TOXICS-890, LEAKING STORAGE TANK, UNDERGROUND STORAGE TANK PROGRAM, HAZWASTE-WAR000000521, HAZARDOUS WASTE PROGRAM Business SIC classification: GENERAL CONTRACTORS-NONRESIDENTIAL BUILDINGS, OTHER THAN INDUSTRIAL BUILDINGS AND WAREHOUSES
BLACK LAKE AUTO INCORPORATED (5612 BLACK LAKE BLVD in OLYMPIA, WA)
(Resource Conservation and Recovery Act (tracking hazardous waste)) STATE MASTER (Washington State Department of Ecology's Facility/Site identification system) - HAZWASTE-WAD988503306, HAZARDOUS WASTE PROGRAM Business SIC classification: MOTOR VEHICLE PARTS, USED Business NAICS classification: GENERAL AUTOMOTIVE REPAIR. Organizations: JEREMY BOYD (CONTACT/OPERATOR)
, JEREMY F BOYD (CONTACT/OWNER)
CAPITAL CITY ENTERPRISES (6746 KIRSOP RD SW in OLYMPIA, WA)
(Resource Conservation and Recovery Act (tracking hazardous waste)) STATE MASTER (Washington State Department of Ecology's Facility/Site identification system) - TOXICS-, UNDERGROUND STORAGE TANK PROGRAM, HAZWASTE-WAD982658643, HAZARDOUS WASTE PROGRAM Business SIC classification: GENERAL AUTOMOTIVE REPAIR SHOPS Business NAICS classification: GENERAL AUTOMOTIVE REPAIR.; GENERAL AUTOMOTIVE REPAIR. Organizations: ROD ZIMMERMAN (CONTACT/OPERATOR)
, CAPITAL CITY ENTERPRISES LLC (CONTACT/OWNER)
CAPITOL CRUNCH AUTO DISMANTLING INC (1510 93RD RD SW in OLYMPIA, WA)
(Resource Conservation and Recovery Act (tracking hazardous waste)) STATE MASTER (Washington State Department of Ecology's Facility/Site identification system) - SWFAP-, REFUSE DISPOSAL Business SIC classification: REFUSE SYSTEMS; MOTOR VEHICLE PARTS, USED Organizations: WILLIAM ENGLUND (CONTACT/OPERATOR)
Alternative names: Captain Crunch Inc
CHARLES R WALKER RESIDENCE (9430 CASE RD SW LOT NO 12B in OLYMPIA, WA)
(Resource Conservation and Recovery Act (tracking hazardous waste)) STATE MASTER (Washington State Department of Ecology's Facility/Site identification system) - HAZWASTE-WAH000007922, CESQG Organizations: WA ECY SWRO (CONTACT/OPERATOR)
CHEVRON 90956 (670 TROSPER RD in TUMWATER, WA)
(Resource Conservation and Recovery Act (tracking hazardous waste)) STATE MASTER (Washington State Department of Ecology's Facility/Site identification system) - TOXICS-5067, LEAKING STORAGE TANK, UNDERGROUND STORAGE TANK PROGRAM, HAZWASTE-WAD988489753, EPCRA, SQG, HAZARDOUS WASTE PROGRAM Business SIC classification: GROCERY STORES; GASOLINE SERVICE STATIONS Organizations: CSI (CONTACT/OPERATOR)
, CHEVRON PRODUCTS CO (CONTACT/OWNER)
Alternative names: CHEVRON SS 90956
CITIFOR INCORPORATED (13120 TILLEY ROAD SOUTH in OLYMPIA, WA)
HAZARDOUS WASTE BIENNIAL REPORTER (Resource Conservation and Recovery Act (tracking hazardous waste)) Small Quantity Generators, between 100 kg and 1000 kg of hazardous waste/month (Resource Conservation and Recovery Act (tracking hazardous waste)) TRI REPORTER (Tracking of toxic chemicals releasing facilities) STATE MASTER (Washington State Department of Ecology's Facility/Site identification system) - HAZWASTE-WAD096246368, HAZARDOUS WASTE PROGRAM, EPCRA, TRI REPORTER, TOXICS-, GROUND WATER PROGRAM Business SIC classification: EXPLOSIVES; REFUSE SYSTEMS Alternative names: PACIFIC POWDER
ALBANY INTERNATIONAL CORPORATION (5700 LITTLE ROCK ROAD SOUTHWEST in TUMWATER, WA)
COMPLIANCE ACTIVITY (Tracking inspections of insecticide, fungicide, and rodenticide, and toxic substances) Conditionally Exempt Small Quantity Generators, less than 100 kg/month of hazardous waste (Resource Conservation and Recovery Act (tracking hazardous waste)) - notification STATE MASTER (Washington State Department of Ecology's Facility/Site identification system) - HAZWASTE-CRK000061510, EPCRA Business SIC classification: BROADWOVEN FABRIC MILLS, MANMADE FIBER AND SILK; CONVEYORS AND CONVEYING EQUIPMENT
COLUMBIA BEVERAGE CO 29TH AVE (3107 29TH AVE SW in TUMWATER, WA)
National Pollutant Discharge Elimination System NON-MAJOR (Tracking pollutant discharge elimination systems) - permit STATE MASTER (Washington State Department of Ecology's Facility/Site identification system) - WATQUAL-SO3003921, NPDES STORMWATER PERMIT Business SIC classification: BOTTLED AND CANNED SOFT DRINKS AND CARBONATED WATERS
Housing units lacking complete plumbing facilities: 2.3% Housing units lacking complete kitchen facilities: 3.0%
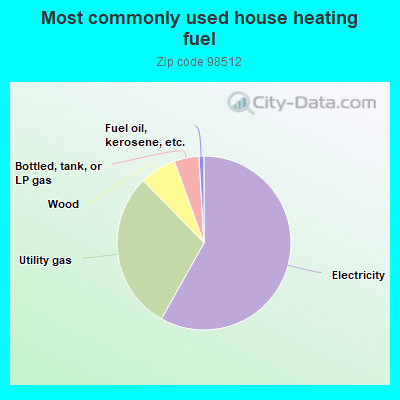
57.8%Electricity
29.4%Utility gas
6.7%Wood
4.6%Bottled, tank, or LP gas
0.9%Fuel oil, kerosene, etc.
Place of birth for U.S.-born residents:
This state: 16,322
Northeast: 1,190
Midwest: 2,867
South: 2,142
West: 6,053
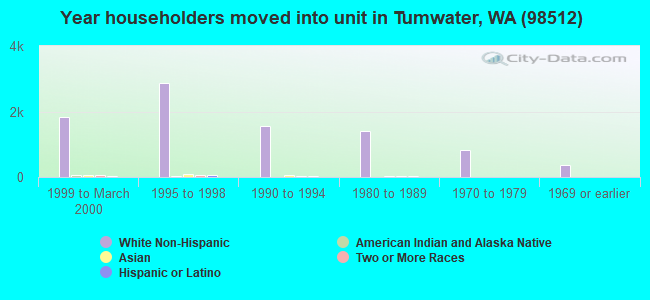
51% of the 98512 zip code residents lived in the same house 5 years ago. Out of people who lived in different houses, 55% lived in this county. Out of people who lived in different counties, 50% lived in Washington.
88% of the 98512 zip code residents lived in the same house 1 year ago. Out of people who lived in different houses, 53% moved from this county. Out of people who lived in different houses, 21% moved from different county within same state. Out of people who lived in different houses, 22% moved from different state. Out of people who lived in different houses, 5% moved from abroad.
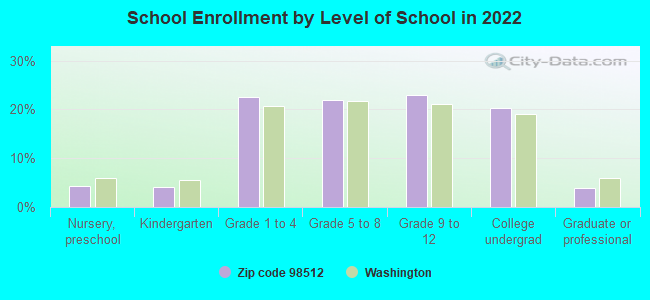
Private vs. public school enrollment:
Students in private schools in grades 1 to 8 (elementary and middle school): 275
Here:
10.1%
Washington:
12.4%
Students in private schools in grades 9 to 12 (high school): 106
Here:
7.5%
Washington:
9.2%
Students in private undergraduate colleges: 195
Here:
15.8%
Washington:
16.5%
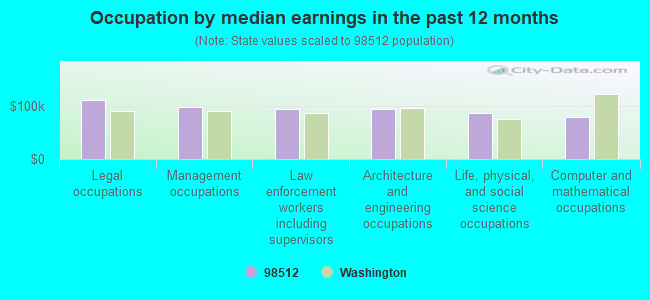
Occupation by median earnings in the past 12 months ($)
111,854Legal occupations
98,988Management occupations
95,919Law enforcement workers including supervisors
94,341Architecture and engineering occupations
87,323Life, physical, and social science occupations
80,882Computer and mathematical occupations
Companies with federal contracts located in this zip code:
JANNY, STEPHEN J (855 TROSPER RD in TUMWATER, WA; small business) : $527,670 in 5 contractsfrom 2004 to 2006
Contracts for Anesthesiology Services by Army Signed by year:2000: $0; 2001: $0; 2002: $0; 2003: $0; 2004: $411,510; 2005: $341,637; 2006: -$225,477.
Biggest contracts:
$286,197 with Army for Anesthesiology Services. Signed on 2005-10-18. Completion date: 2004-09-30.
$270,270, same as above.Signed on 2004-10-12. Completion date: 2004-09-30.
$141,240, same as above.Signed on 2004-04-01. Completion date: 2004-09-30.
$55,440, same as above.Signed on 2005-08-10. Completion date: 2004-09-30.
BODENHAMER, INC. (3711 49TH AVE. SW in OLYMPIA, WA; small business) : $428,196 in 42 contractsfrom 1999 to 2000
Contracts for Construction of Structures and Facilities -- Other Airfield Structures, Maintenance, Repair or Alteration of Real Property -- Other Airfield Structures, Maintenance, Repair or Alteration of Real Property -- Other Administrative Facilities and Service Buildings by Army, Navy Signed by year:2000: $397,001; 2001: $0; 2002: $0; 2003: $0; 2004: $0; 2005: $0; 2006: $0.
Biggest contracts:
$160,056 with Army for Construction of Structures and Facilities -- Other Airfield Structures. Signed on 2000-08-23. Completion date: 2001-09-30.
$47,167 with Army for Maintenance, Repair or Alteration of Real Property -- Other Airfield Structures. Signed on 2000-07-06. Completion date: 2000-09-29.
$25,418 with Army for Construction of Structures and Facilities -- Other Airfield Structures. Signed on 2000-06-21. Completion date: 2000-09-29.
$24,000 with Navy for Maintenance, Repair or Alteration of Real Property -- Other Administrative Facilities and Service Buildings. Signed on 2000-04-19. Completion date: 1999-03-05.
GRID HOOD CLEANING (10416 LITTLEROCK RD SW in OLYMPIA, WA; small business) : $424,819 in 27 contractsfrom 2000 to 2006
Contracts for Maintenance, Repair and Rebuilding of Equipment -- Food Preparation and Serving Equipment, Maintenance, Repair and Rebuilding of Equipment -- Weapons, Clean Work Stations, Controlled Environment and Related Equipment, Custodial Janitorial Services, and moreby Army, Air Force Signed by year:2000: $39,971; 2001: $60,445; 2002: $51,445; 2003: $70,820; 2004: $107,452; 2005: $102,550; 2006: -$7,864.
Biggest contracts:
$70,819 with Army for Maintenance, Repair and Rebuilding of Equipment -- Food Preparation and Serving Equipment. Signed on 2004-06-08. Completion date: 2005-07-31.
$67,390, same as above.Signed on 2005-12-01. Completion date: 2010-11-30.
$60,445, same as above.Signed on 2003-07-08. Completion date: 2005-07-31.
$60,445, same as above.Signed on 2002-06-07. Completion date: 2005-07-31.
CONCRETE RECYCLERS/JS & S TRUC (2935 BLACK LAKE BLVD SW in OLYMPIA, WA; small business) : $89,466 in 4 contractsfrom 2005 to 2006
$49,368 with Army for Maintenance, Repair or Alteration of Real Property -- Other Non-Building Facilities. Signed on 2005-09-10. Completion date: 2005-11-23.
$34,504, same as above.Signed on 2005-09-26. Completion date: 2005-11-23.
$3,078, same as above.Signed on 2006-03-21. Completion date: 2006-02-28.
$2,516, same as above.Signed on 2006-01-13. Completion date: 2005-12-23.
CHARLES F. HEEBNER (5503 110TH AVE SE in OLYMPIA, WA; small business) : $35,144 in 5 contractsfrom 2001 to 2002
Contracts for Forest/Range Fire Suppression/Presuppression Services by Forest Service (disused code: now 12C2), Forest Service Signed by year:2000: $0; 2001: $14,144; 2002: $21,000; 2003: $0; 2004: $0; 2005: $0; 2006: $0.
Biggest contracts:
$11,000 with Forest Service (disused code: now 12C2) for Forest/Range Fire Suppression/Presuppression Services. Signed on 2002-09-15. Completion date: 2003-09-15.
$10,000, same as above.Signed on 2002-05-15. Completion date: 2002-09-15.
$10,000, same as above.Signed on 2001-06-15. Completion date: 2001-09-15.
$2,144 with Forest Service for Forest/Range Fire Suppression/Presuppression Services. Signed on 2001-08-15. Completion date: 2002-09-15.
ELECTRONIC RESOURCING INC (2500 MOTTMAN RD SW STE B in TUMWATER, WA; small business)
$29,165 with Air Force for Miscellaneous Items. Signed on 2003-09-30. Completion date: 2003-11-13.
ALAN C HOUSE (1508 LAKEMOOR LOOP COURT S in OLYMPIA, WA; small business) : $18,200 in 2 contractsin 2002
$15,000 with U.S. Army Corps of Engineers - civil program financing only for Other Special Studies and Analyses. Signed on 2002-09-30. Completion date: 2003-01-15.
$3,200, same as above.Signed on 2002-10-18. Completion date: 2003-01-15.
AA TOOL CO (10807 CREEKWOOD DRIVE SW in OLYMPIA, WA; small business)
$9,080 with Army for Cutting Tools for Machine Tools. Taking place in CO. Signed on 2004-01-14. Completion date: 2004-03-05.
ALPINE MACHINE (7910 THORNBURG ST SW in OLYMPIA, WA; small business) : $6,480 in 3 contractsfrom 2003 to 2004
$2,940 with U.S. Army Corps of Engineers - civil program financing only for Miscellaneous Materials Handling Equipment. Signed on 2003-11-25. Completion date: 2003-12-23.
$2,940 with Army for Miscellaneous Materials Handling Equipment. Signed on 2003-11-25. Completion date: 2003-12-23.
$600, same as above.Signed on 2004-04-19. Completion date: 2003-12-23.
Top industries in this zip code by the number of employees in 2005:
Wholesale Trade: Other Grocery and Related Products Merchant Wholesalers (50-99 employees: 2 establishments)
Arts, Entertainment, and Recreation: All Other Amusement and Recreation Industries (50-99: 1, 20-49: 1)
Construction: Commercial and Institutional Building Construction (20-49: 2, 10-19: 2, 1-4: 3)
People in group quarters in 2010:
477 people in state prisons
79 people in nursing facilities/skilled-nursing facilities
53 people in group homes intended for adults
38 people in correctional facilities intended for juveniles
35 people in emergency and transitional shelters (with sleeping facilities) for people experiencing homelessness
8 people in other noninstitutional facilities
5 people in group homes for juveniles (non-correctional)
People in group quarters in 2000:
374 people in state prisons
64 people in short-term care, detention or diagnostic centers for delinquent children
60 people in other group homes
54 people in other noninstitutional group quarters
Fatal accident statistics in 2014:
Fatal accident count: 3
Vehicles involved in fatal accidents: 4
Fatal accidents caused by drunken drivers: 1
Fatalities: 3
Persons involved in fatal accidents: 9
Pedestrians involved in fatal accidents: 0
Fatal accident statistics in 2013:
Fatal accident count: 2
Vehicles involved in fatal accidents: 2
Fatal accidents caused by drunken drivers: 0
Fatalities: 3
Persons involved in fatal accidents: 3
Pedestrians involved in fatal accidents: 0
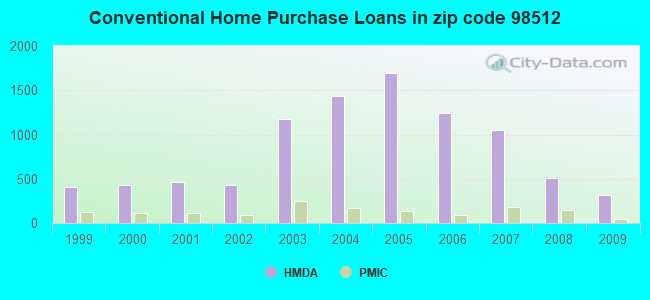
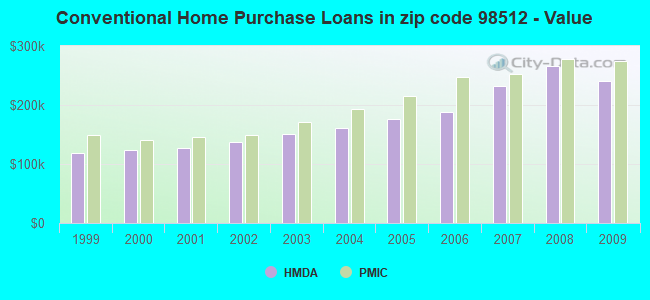
Home Mortgage Disclosure Act Aggregated Statistics For Year 2009 (Based on 6 full and 6 partial tracts)
A) FHA, FSA/RHS & VA Home Purchase Loans
B) Conventional Home Purchase Loans
C) Refinancings
D) Home Improvement Loans
E) Loans on Dwellings For 5+ Families
F) Non-occupant Loans on < 5 Family Dwellings (A B C & D)
G) Loans On Manufactured Home Dwelling (A B C & D)
Number
Average Value
Number
Average Value
Number
Average Value
Number
Average Value
Number
Average Value
Number
Average Value
Number
Average Value
LOANS ORIGINATED
318
$243,466
321
$240,528
2,270
$225,330
120
$127,163
0
$0
119
$194,658
152
$149,322
APPLICATIONS APPROVED, NOT ACCEPTED
30
$253,592
37
$264,280
222
$230,654
16
$32,899
0
$0
12
$160,428
25
$93,078
APPLICATIONS DENIED
61
$228,468
95
$231,996
584
$255,964
45
$105,594
0
$0
53
$213,753
96
$109,263
APPLICATIONS WITHDRAWN
31
$242,094
54
$295,964
498
$249,702
21
$167,149
2
$518,015
24
$207,972
20
$207,754
FILES CLOSED FOR INCOMPLETENESS
8
$281,949
16
$186,802
167
$247,531
8
$131,608
0
$0
6
$180,378
6
$158,695
Aggregated Statistics For Year 2008 (Based on 6 full and 6 partial tracts)
A) FHA, FSA/RHS & VA Home Purchase Loans
B) Conventional Home Purchase Loans
C) Refinancings
D) Home Improvement Loans
E) Loans on Dwellings For 5+ Families
F) Non-occupant Loans on < 5 Family Dwellings (A B C & D)
G) Loans On Manufactured Home Dwelling (A B C & D)
Number
Average Value
Number
Average Value
Number
Average Value
Number
Average Value
Number
Average Value
Number
Average Value
Number
Average Value
LOANS ORIGINATED
224
$244,604
512
$265,564
1,226
$221,107
174
$95,531
11
$1,294,479
134
$280,893
165
$155,706
APPLICATIONS APPROVED, NOT ACCEPTED
19
$220,825
87
$210,091
224
$209,690
33
$78,027
0
$0
31
$156,089
38
$95,158
APPLICATIONS DENIED
34
$216,381
111
$202,441
568
$237,471
152
$119,647
2
$192,635
57
$225,593
104
$113,351
APPLICATIONS WITHDRAWN
30
$247,789
78
$261,871
315
$250,784
37
$197,179
2
$498,650
42
$234,314
32
$173,049
FILES CLOSED FOR INCOMPLETENESS
2
$120,620
14
$220,451
74
$228,642
12
$85,960
0
$0
0
$0
10
$125,001
Aggregated Statistics For Year 2007 (Based on 6 full and 6 partial tracts)
A) FHA, FSA/RHS & VA Home Purchase Loans
B) Conventional Home Purchase Loans
C) Refinancings
D) Home Improvement Loans
E) Loans on Dwellings For 5+ Families
F) Non-occupant Loans on < 5 Family Dwellings (A B C & D)
G) Loans On Manufactured Home Dwelling (A B C & D)
Number
Average Value
Number
Average Value
Number
Average Value
Number
Average Value
Number
Average Value
Number
Average Value
Number
Average Value
LOANS ORIGINATED
83
$239,875
1,050
$231,614
1,625
$207,565
308
$84,897
4
$2,594,242
245
$199,444
192
$130,590
APPLICATIONS APPROVED, NOT ACCEPTED
3
$237,957
159
$209,681
210
$209,647
48
$93,958
0
$0
32
$213,108
37
$88,057
APPLICATIONS DENIED
11
$182,745
170
$245,007
705
$223,854
180
$107,021
0
$0
62
$199,932
129
$107,473
APPLICATIONS WITHDRAWN
16
$212,882
113
$216,172
385
$218,337
87
$142,233
0
$0
33
$230,613
54
$110,194
FILES CLOSED FOR INCOMPLETENESS
0
$0
26
$298,010
82
$229,956
11
$131,508
0
$0
12
$223,485
13
$148,671
Aggregated Statistics For Year 2006 (Based on 6 full and 6 partial tracts)
A) FHA, FSA/RHS & VA Home Purchase Loans
B) Conventional Home Purchase Loans
C) Refinancings
D) Home Improvement Loans
E) Loans on Dwellings For 5+ Families
F) Non-occupant Loans on < 5 Family Dwellings (A B C & D)
G) Loans On Manufactured Home Dwelling (A B C & D)
Number
Average Value
Number
Average Value
Number
Average Value
Number
Average Value
Number
Average Value
Number
Average Value
Number
Average Value
LOANS ORIGINATED
95
$228,504
1,240
$188,863
1,652
$191,766
300
$78,582
7
$809,463
242
$186,058
179
$130,268
APPLICATIONS APPROVED, NOT ACCEPTED
14
$172,116
129
$181,359
219
$188,498
39
$101,083
0
$0
23
$173,633
29
$124,107
APPLICATIONS DENIED
14
$191,729
294
$178,420
638
$210,389
182
$118,723
0
$0
59
$169,518
151
$105,821
APPLICATIONS WITHDRAWN
11
$210,022
137
$181,547
549
$191,666
80
$139,823
0
$0
32
$165,419
36
$120,514
FILES CLOSED FOR INCOMPLETENESS
0
$0
22
$140,837
92
$201,988
8
$138,268
0
$0
2
$184,310
2
$180,030
Aggregated Statistics For Year 2005 (Based on 6 full and 6 partial tracts)
A) FHA, FSA/RHS & VA Home Purchase Loans
B) Conventional Home Purchase Loans
C) Refinancings
D) Home Improvement Loans
E) Loans on Dwellings For 5+ Families
F) Non-occupant Loans on < 5 Family Dwellings (A B C & D)
G) Loans On Manufactured Home Dwelling (A B C & D)
Number
Average Value
Number
Average Value
Number
Average Value
Number
Average Value
Number
Average Value
Number
Average Value
Number
Average Value
LOANS ORIGINATED
91
$211,176
1,696
$175,820
1,820
$175,556
237
$83,056
8
$2,379,714
313
$153,203
178
$116,757
APPLICATIONS APPROVED, NOT ACCEPTED
13
$167,845
217
$184,292
279
$174,291
33
$94,610
0
$0
34
$139,498
52
$99,527
APPLICATIONS DENIED
23
$152,490
296
$135,692
755
$165,046
147
$83,112
0
$0
55
$135,664
196
$112,128
APPLICATIONS WITHDRAWN
15
$189,329
157
$176,895
554
$174,937
75
$128,259
2
$815,000
48
$144,469
69
$106,292
FILES CLOSED FOR INCOMPLETENESS
0
$0
44
$179,940
163
$173,671
17
$124,551
0
$0
10
$159,450
11
$123,956
Aggregated Statistics For Year 2004 (Based on 6 full and 6 partial tracts)
A) FHA, FSA/RHS & VA Home Purchase Loans
B) Conventional Home Purchase Loans
C) Refinancings
D) Home Improvement Loans
E) Loans on Dwellings For 5+ Families
F) Non-occupant Loans on < 5 Family Dwellings (A B C & D)
G) Loans On Manufactured Home Dwelling (A B C & D)
Number
Average Value
Number
Average Value
Number
Average Value
Number
Average Value
Number
Average Value
Number
Average Value
Number
Average Value
LOANS ORIGINATED
158
$174,173
1,430
$160,603
1,870
$153,514
254
$53,743
4
$1,841,378
244
$135,261
215
$109,509
APPLICATIONS APPROVED, NOT ACCEPTED
16
$147,022
186
$152,716
310
$153,828
30
$92,408
0
$0
35
$165,072
51
$90,051
APPLICATIONS DENIED
25
$122,591
214
$139,826
768
$149,535
132
$56,824
0
$0
52
$121,639
133
$93,340
APPLICATIONS WITHDRAWN
16
$126,244
116
$153,080
516
$155,101
33
$74,087
0
$0
24
$164,390
51
$115,769
FILES CLOSED FOR INCOMPLETENESS
2
$220,405
29
$218,819
172
$154,384
11
$63,315
0
$0
3
$130,933
10
$120,351
Aggregated Statistics For Year 2003 (Based on 6 full and 6 partial tracts)
A) FHA, FSA/RHS & VA Home Purchase Loans
B) Conventional Home Purchase Loans
C) Refinancings
D) Home Improvement Loans
E) Loans on Dwellings For 5+ Families
F) Non-occupant Loans on < 5 Family Dwellings (A B C & D)
Number
Average Value
Number
Average Value
Number
Average Value
Number
Average Value
Number
Average Value
Number
Average Value
LOANS ORIGINATED
182
$154,799
1,170
$151,080
3,968
$143,466
241
$34,829
9
$549,888
326
$123,262
APPLICATIONS APPROVED, NOT ACCEPTED
15
$176,880
146
$130,612
416
$148,280
33
$17,257
2
$299,190
23
$117,485
APPLICATIONS DENIED
14
$148,302
197
$118,498
719
$140,728
63
$25,562
0
$0
44
$112,582
APPLICATIONS WITHDRAWN
18
$168,142
97
$133,637
579
$150,373
30
$52,136
2
$3,271,145
35
$102,724
FILES CLOSED FOR INCOMPLETENESS
3
$109,043
11
$139,414
111
$156,967
11
$60,484
0
$0
3
$70,600
Aggregated Statistics For Year 2002 (Based on 4 full and 4 partial tracts)
A) FHA, FSA/RHS & VA Home Purchase Loans
B) Conventional Home Purchase Loans
C) Refinancings
D) Home Improvement Loans
E) Loans on Dwellings For 5+ Families
F) Non-occupant Loans on < 5 Family Dwellings (A B C & D)
Number
Average Value
Number
Average Value
Number
Average Value
Number
Average Value
Number
Average Value
Number
Average Value
LOANS ORIGINATED
94
$141,094
429
$137,833
1,303
$135,875
76
$18,841
3
$353,663
156
$121,986
APPLICATIONS APPROVED, NOT ACCEPTED
12
$124,876
72
$133,441
138
$140,816
11
$16,433
2
$1,371,895
15
$151,547
APPLICATIONS DENIED
13
$144,166
68
$96,436
277
$127,722
21
$12,637
0
$0
20
$109,051
APPLICATIONS WITHDRAWN
3
$161,260
43
$134,641
216
$135,634
8
$24,474
0
$0
11
$97,888
FILES CLOSED FOR INCOMPLETENESS
1
$120,290
6
$95,588
38
$137,071
0
$0
0
$0
2
$140,535
Aggregated Statistics For Year 2001 (Based on 4 full and 4 partial tracts)
A) FHA, FSA/RHS & VA Home Purchase Loans
B) Conventional Home Purchase Loans
C) Refinancings
D) Home Improvement Loans
E) Loans on Dwellings For 5+ Families
F) Non-occupant Loans on < 5 Family Dwellings (A B C & D)
Number
Average Value
Number
Average Value
Number
Average Value
Number
Average Value
Number
Average Value
Number
Average Value
LOANS ORIGINATED
97
$132,668
459
$127,649
934
$130,131
89
$26,962
6
$181,388
113
$123,287
APPLICATIONS APPROVED, NOT ACCEPTED
10
$113,746
70
$103,513
129
$118,335
9
$27,429
0
$0
11
$115,794
APPLICATIONS DENIED
9
$127,943
83
$98,604
258
$144,320
41
$23,735
0
$0
13
$174,802
APPLICATIONS WITHDRAWN
10
$136,567
54
$154,099
162
$127,073
9
$35,153
0
$0
8
$99,892
FILES CLOSED FOR INCOMPLETENESS
2
$145,605
7
$141,336
35
$117,825
2
$46,200
0
$0
3
$102,757
Aggregated Statistics For Year 2000 (Based on 4 full and 4 partial tracts)
A) FHA, FSA/RHS & VA Home Purchase Loans
B) Conventional Home Purchase Loans
C) Refinancings
D) Home Improvement Loans
E) Loans on Dwellings For 5+ Families
F) Non-occupant Loans on < 5 Family Dwellings (A B C & D)
Number
Average Value
Number
Average Value
Number
Average Value
Number
Average Value
Number
Average Value
Number
Average Value
LOANS ORIGINATED
117
$124,744
433
$123,512
217
$113,701
100
$20,556
2
$2,632,870
66
$111,920
APPLICATIONS APPROVED, NOT ACCEPTED
17
$99,664
40
$105,002
73
$127,419
23
$41,593
0
$0
21
$115,030
APPLICATIONS DENIED
11
$101,180
111
$88,648
129
$109,015
45
$21,791
2
$291,210
17
$104,209
APPLICATIONS WITHDRAWN
8
$102,961
56
$111,509
66
$122,071
6
$48,298
0
$0
12
$137,385
FILES CLOSED FOR INCOMPLETENESS
0
$0
7
$110,076
38
$126,656
0
$0
0
$0
2
$48,050
Aggregated Statistics For Year 1999 (Based on 2 full and 3 partial tracts)
A) FHA, FSA/RHS & VA Home Purchase Loans
B) Conventional Home Purchase Loans
C) Refinancings
D) Home Improvement Loans
E) Loans on Dwellings For 5+ Families
F) Non-occupant Loans on < 5 Family Dwellings (A B C & D)
2002 - 2018 National Fire Incident Reporting System (NFIRS) incidents
According to the data from the years 2002 - 2018 the average number of fires per year is 109. The highest number of reported fires - 216 took place in 2006, and the least - 12 in 2013. The data has an increasing trend.
When looking into fire subcategories, the most incidents belonged to: Structure Fires (42.6%), and Outside Fires (33.3%).
Fire incident types reported to NFIRS in Zip Code 98512


 Nearest zip codes: 98502, 98501, 98579, 98557, 98506, 98544.


 According to the data from the years 2002 - 2018 the average number of fires per year is 109. The highest number of reported fires - 216 took place in 2006, and the least - 12 in 2013. The data has an increasing trend.
 When looking into fire subcategories, the most incidents belonged to: Structure Fires (42.6%), and Outside Fires (33.3%).