Estimated zip code population in 2022: 3,862 Zip code population in 2010: 3,708 Zip code population in 2000: 3,178
Houses and condos: 2,347 Renter-occupied apartments: 554
% of renters here:
37%
State:
36%
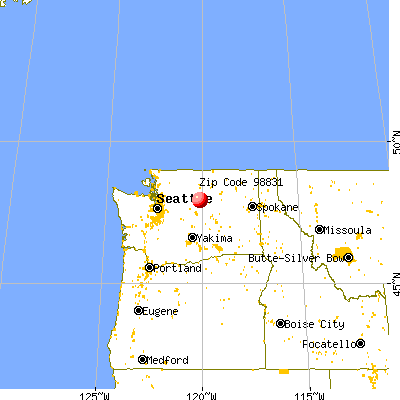
March 2022 cost of living index in zip code 98831: 99.3 (near average, U.S. average is 100)
Land area: 46.9 sq. mi. Water area: 7.4 sq. mi.
Population density: 82 people per square mile
(very low).
OSM Map
General Map
Google Map
MSN Map
OSM Map
General Map
Google Map
MSN Map
OSM Map
General Map
Google Map
MSN Map
OSM Map
General Map
Google Map
MSN Map
Please wait while loading the map...
Real estate property taxes paid for housing units in 2022:
This zip code:
0.6% ($3,354)
Washington:
0.8% ($4,283)
Median real estate property taxes paid for housing units with mortgages in 2022: $3,588 (0.5%) Median real estate property taxes paid for housing units with no mortgage in 2022: $2,998 (0.7%)
Estimated median house/condo value in 2022: $594,161
98831:
$594,161
Washington:
$569,500
According to our research of Washington and other state lists, there were 2 registered sex offenders living in 98831 zip code as of June 17, 2024. The ratio of all residents to sex offenders in zip code 98831 is 1,487 to 1. The ratio of registered sex offenders to all residents in this zip code is near the state average.
Median resident age:
This zip code:
48.1 years
Washington median age:
38.4 years
Average household size:
This zip code:
2.5 people
Washington:
2.5 people
Averages for the 2020 tax year for zip code 98831, filed in 2021:
Average Adjusted Gross Income (AGI) in 2020: $90,302 (Individual Income Tax Returns)
Here:
$90,302
State:
$99,264
Salary/wage: $54,504 (reported on 77.5% of returns)
Here:
$54,504
State:
$80,347
(% of AGI for various income ranges: 1644.9% for AGIs below $25k, 3527.6% for AGIs $25k-50k, 5634.7% for AGIs $50k-75k, 7661.1% for AGIs $75k-100k, 15855.0% for AGIs $100k-200k, 83890.0% for AGIs over 200k)
Taxable interest for individuals: $3,638 (reported on 33.7% of returns)
This zip code:
$3,638
Washington:
$2,077
(% of AGI for various income ranges: 26.5% for AGIs below $25k, 31.3% for AGIs $25k-50k, 110.0% for AGIs $50k-75k, 177.8% for AGIs $75k-100k, 338.3% for AGIs $100k-200k, 4480.0% for AGIs over 200k)
Ordinary dividends: $11,525 (reported on 23.5% of returns)
Here:
$11,525
State:
$10,013
(% of AGI for various income ranges: 59.2% for AGIs below $25k, 70.5% for AGIs $25k-50k, 301.3% for AGIs $50k-75k, 300.0% for AGIs $75k-100k, 1128.3% for AGIs $100k-200k, 8360.0% for AGIs over 200k)
Net capital gain/loss in AGI: +$50,298 (reported on 23.5% of returns)
Here:
+$50,298
State:
+$40,092
(% of AGI for various income ranges: 31.1% for AGIs below $25k, 81.3% for AGIs $25k-50k, 276.0% for AGIs $50k-75k, 437.8% for AGIs $75k-100k, 1708.3% for AGIs $100k-200k, 62830.0% for AGIs over 200k)
Profit/loss from business: +$14,842 (reported on 12.8% of returns)
Here:
+$14,842
State:
+$18,312
(% of AGI for various income ranges: 101.4% for AGIs below $25k, 186.1% for AGIs $25k-50k, 211.3% for AGIs $50k-75k, 512.2% for AGIs $75k-100k, 620.8% for AGIs $100k-200k, 3190.0% for AGIs over 200k)
Taxable individual retirement arrangement distribution: $27,972 (reported on 13.4% of returns)
98831:
$27,972
Washington:
$24,221
(% of AGI for various income ranges: 55.4% for AGIs below $25k, 105.5% for AGIs $25k-50k, 376.7% for AGIs $50k-75k, 917.8% for AGIs $75k-100k, 2656.7% for AGIs $100k-200k, 6026.7% for AGIs over 200k)
Total itemized deductions: $39,106 (reported on 9.6% of returns)
Here:
$39,106
State:
$39,068
(% of AGI for various income ranges: 158.9% for AGIs below $25k, 892.7% for AGIs $50k-75k, 1778.3% for AGIs $100k-200k, 9926.7% for AGIs over 200k)
Charity contributions: $8,850 (reported on 7.5% of returns)
Here:
$8,850
State:
$15,331
(% of AGI for various income ranges: 136.7% for AGIs $50k-75k, 273.3% for AGIs $100k-200k, 2353.3% for AGIs over 200k)
Taxes paid: $7,722 (reported on 9.6% of returns)
98831:
$7,722
State:
$7,774
(% of AGI for various income ranges: 30.8% for AGIs below $25k, 172.0% for AGIs $50k-75k, 402.5% for AGIs $100k-200k, 1783.3% for AGIs over 200k)
Earned income credit: $2,500 (reported on 16.0% of returns)
Here:
$2,500
State:
$2,020
(% of AGI for various income ranges: 123.2% for AGIs below $25k, 77.4% for AGIs $25k-50k)
Percentage of individuals using paid preparers for their 2020 taxes: 87.2%
Here:
87%
State:
93%
(% for various income ranges: 79.7% for AGIs below $25k, 86.3% for AGIs $25k-50k, 91.3% for AGIs $50k-75k, 93.3% for AGIs $75k-100k, 92.6% for AGIs $100k-200k, 100.0% for AGIs over 200k)
Averages for the 2012 tax year for zip code 98831, filed in 2013:
Average Adjusted Gross Income (AGI) in 2012: $51,016 (Individual Income Tax Returns)
Here:
$51,016
State:
$69,533
Salary/wage: $32,526 (reported on 82.4% of returns)
Here:
$32,526
State:
$57,267
(% of AGI for various income ranges: 82.6% for AGIs below $25k, 75.4% for AGIs $25k-50k, 56.2% for AGIs $50k-75k, 50.8% for AGIs $75k-100k, 48.5% for AGIs $100k-200k, 25.9% for AGIs over 200k)
Taxable interest for individuals: $2,179 (reported on 32.4% of returns)
This zip code:
$2,179
Washington:
$1,816
(% of AGI for various income ranges: 1.8% for AGIs below $25k, 1.7% for AGIs $25k-50k, 1.7% for AGIs $50k-75k, 1.0% for AGIs $75k-100k, 2.5% for AGIs $100k-200k, 0.3% for AGIs over 200k)
Ordinary dividends: $6,540 (reported on 20.3% of returns)
Here:
$6,540
State:
$8,163
(% of AGI for various income ranges: 2.2% for AGIs below $25k, 1.2% for AGIs $25k-50k, 2.4% for AGIs $50k-75k, 3.3% for AGIs $75k-100k, 2.7% for AGIs $100k-200k, 3.4% for AGIs over 200k)
Net capital gain/loss in AGI: +$14,036 (reported on 16.9% of returns)
Here:
+$14,036
State:
+$21,568
(% of AGI for various income ranges: 1.8% for AGIs $50k-75k, 2.3% for AGIs $75k-100k, 6.8% for AGIs $100k-200k, 11.0% for AGIs over 200k)
Profit/loss from business: +$9,776 (reported on 11.5% of returns)
Here:
+$9,776
State:
+$16,521
(% of AGI for various income ranges: 3.9% for AGIs below $25k, 3.5% for AGIs $25k-50k, 4.8% for AGIs $50k-75k, 2.8% for AGIs $100k-200k)
Taxable individual retirement arrangement distribution: $17,488 (reported on 11.5% of returns)
98831:
$17,488
Washington:
$18,648
(% of AGI for various income ranges: 1.6% for AGIs below $25k, 2.0% for AGIs $25k-50k, 3.9% for AGIs $50k-75k, 8.5% for AGIs $75k-100k, 10.3% for AGIs $100k-200k)
Total itemized deductions: $24,508 (22% of AGI, reported on 24.3% of returns)
Here:
$24,508
State:
$23,872
Here:
21.9% of AGI
State:
18.2% of AGI
(% of AGI for various income ranges: 8.7% for AGIs below $25k, 9.9% for AGIs $25k-50k, 13.5% for AGIs $50k-75k, 16.7% for AGIs $75k-100k, 15.2% for AGIs $100k-200k, 8.7% for AGIs over 200k)
Charity contributions: $4,559 (reported on 18.2% of returns)
Here:
$4,559
State:
$4,465
(% of AGI for various income ranges: 0.3% for AGIs below $25k, 0.6% for AGIs $25k-50k, 1.0% for AGIs $50k-75k, 2.1% for AGIs $75k-100k, 2.9% for AGIs $100k-200k, 2.2% for AGIs over 200k)
Taxes paid: $6,258 (reported on 24.3% of returns)
98831:
$6,258
State:
$6,400
(% of AGI for various income ranges: 1.5% for AGIs below $25k, 1.9% for AGIs $25k-50k, 3.2% for AGIs $50k-75k, 4.2% for AGIs $75k-100k, 3.9% for AGIs $100k-200k, 3.1% for AGIs over 200k)
Earned income credit: $2,284 (reported on 20.9% of returns)
Here:
$2,284
State:
$2,073
(% of AGI for various income ranges: 5.7% for AGIs below $25k, 1.4% for AGIs $25k-50k)
Percentage of individuals using paid preparers for their 2012 taxes: 51.4%
Here:
51%
State:
43%
(% for various income ranges: 45.7% for AGIs below $25k, 51.4% for AGIs $25k-50k, 56.2% for AGIs $50k-75k, 54.5% for AGIs $75k-100k, 60.0% for AGIs $100k-200k, 100.0% for AGIs over 200k)
Averages for the 2004 tax year for zip code 98831, filed in 2005:
Average Adjusted Gross Income (AGI) in 2004: $39,191 (Individual Income Tax Returns)
Here:
$39,191
State:
$54,331
Salary/wage: $26,710 (reported on 82.5% of returns)
Here:
$26,710
State:
$45,761
(% of AGI for various income ranges: 83.4% for AGIs $10k-25k, 72.9% for AGIs $25k-50k, 54.3% for AGIs $50k-75k, 55.8% for AGIs $75k-100k, 26.9% for AGIs over 100k)
Taxable interest for individuals: $4,028 (reported on 39.9% of returns)
This zip code:
$4,028
Washington:
$2,110
(% of AGI for various income ranges: 3.0% for AGIs $10k-25k, 2.2% for AGIs $25k-50k, 4.3% for AGIs $50k-75k, 1.4% for AGIs $75k-100k, 5.0% for AGIs over 100k)
Taxable dividends: $3,979 (reported on 24.6% of returns)
Here:
$3,979
State:
$5,879
(% of AGI for various income ranges: 2.1% for AGIs $10k-25k, 1.4% for AGIs $25k-50k, 3.3% for AGIs $50k-75k, 2.9% for AGIs $75k-100k, 2.2% for AGIs over 100k)
Net capital gain/loss: +$13,606 (reported on 22.4% of returns)
Here:
+$13,606
State:
+$15,835
(% of AGI for various income ranges: 0.4% for AGIs $10k-25k, 1.7% for AGIs $25k-50k, 2.7% for AGIs $50k-75k, 5.3% for AGIs $75k-100k, 15.0% for AGIs over 100k)
Profit/loss from business: +$11,664 (reported on 13.1% of returns)
Here:
+$11,664
State:
+$13,994
(% of AGI for various income ranges: 2.3% for AGIs $10k-25k, 3.1% for AGIs $25k-50k, 7.0% for AGIs $50k-75k, 4.2% for AGIs $75k-100k, 3.1% for AGIs over 100k)
IRA payment deduction: $3,294 (reported on 2.9% of returns)
98831:
$3,294
Washington:
$3,001
Total itemized deductions: $18,942 (21% of AGI, reported on 25.2% of returns)
Here:
$18,942
State:
$19,669
Here:
21.2% of AGI
State:
20.7% of AGI
(% of AGI for various income ranges: 11.2% for AGIs $10k-25k, 11.2% for AGIs $25k-50k, 16.9% for AGIs $50k-75k, 14.2% for AGIs $75k-100k, 8.4% for AGIs over 100k)
Charity contributions deductions: $2,758 (3% of AGI, reported on 21.5% of returns)
Here:
$2,758
State:
$3,569
Here:
2.8% of AGI
State:
3.5% of AGI
(% of AGI for various income ranges: 1.1% for AGIs $10k-25k, 1.4% for AGIs $25k-50k, 1.6% for AGIs $50k-75k, 1.6% for AGIs $75k-100k, 1.5% for AGIs over 100k)
Total tax: $7,640 (reported on 60.6% of returns)
98831:
$7,640
State:
$9,065
(% of AGI for various income ranges: 2.4% for AGIs $10k-25k, 5.1% for AGIs $25k-50k, 8.9% for AGIs $50k-75k, 10.6% for AGIs $75k-100k, 18.3% for AGIs over 100k)
Earned income credit: $1,844 (reported on 18.9% of returns)
Here:
$1,844
State:
$1,607
Percentage of individuals using paid preparers for their 2004 taxes: 46.7%
Here:
47%
State:
49%
(% for various income ranges: 37.3% for AGIs below $10k, 43.4% for AGIs $10k-25k, 46.9% for AGIs $25k-50k, 54.5% for AGIs $50k-75k, 53.6% for AGIs $75k-100k, 77.0% for AGIs over 100k)
Household received Food Stamps/SNAP in the past 12 months: 57 Household did not receive Food Stamps/SNAP in the past 12 months: 1,424
Women who had a birth in the past 12 months: 10 (11 now married, 0 unmarried) Women who did not have a birth in the past 12 months: 669 (240 now married, 431 unmarried)
Housing units in zip code 98831 with a mortgage: 463 Houses without a mortgage: 5
Median monthly owner costs for units with a mortgage: $1,803 Median monthly owner costs for units without a mortgage: $450
Residents with income below the poverty level in 2022:
This zip code:
5.0%
Whole state:
10.0%
Residents with income below 50% of the poverty level in 2022:
This zip code:
1.5%
Whole state:
4.6%
Median number of rooms in houses and condos:
Here:
6.9
State:
6.5
Median number of rooms in apartments:
Here:
4.0
State:
3.9
Notable locations in this zip code not listed on our city pages
Notable locations in zip code 98831: Antilon Lake Campground (A), Echo Valley Ski Area (B), Canyon Ranch (C), Manson Bay Park (D), Willow Point Park (E), Manson Ferry Landing (F), Lake Chelan Valley Emergency Medical Services (G), Chelan County Fire District 5 Station 1 (H), Chelan County Fire District 5 Station 2 (I). Display/hide their locations on the map
In group quarters: 96 (-1 institutionalized population)
Size of family households: 489 2-persons, 178 3-persons, 176 4-persons, 61 5-persons, 33 6-persons, 4 7-or-more-persons
Size of nonfamily households: 363 1-person, 179 2-persons
440 married couples with children.
246 single-parent households (15 men, 231 women).
55.3% of residents of 98831 zip code speak English at home.
46.8% of residents speak Spanish at home (51% very well, 11% well, 6% not well, 31% not at all).
0.5% of residents speak other Indo-European language at home (11% very well, 89% well).
Foreign born population: 1,151 (29.8%) (37.1% of them are naturalized citizens)
This zip code:
29.8%
Whole state:
15.3%
95%Honduras
1%Hong Kong
0%France
0%India
7%English
7%German
4%Norwegian
2%American
2%French
2%Scandinavian
1%Dutch
Year of entry for the foreign-born population
2432010 or later
2302000 to 2009
1721990 to 1999
513Before 1990
Housing units lacking complete plumbing facilities: 3.9% Housing units lacking complete kitchen facilities: 3.7%
92.4%Electricity
2.7%Solar energy
2.0%Other fuel
1.7%Utility gas
0.9%Wood
0.6%Bottled, tank, or LP gas
Population in 1990: 2,309. Population change in the 1990s: +869 (+37.6%).
Place of birth for U.S.-born residents:
This state: 1,763
Northeast: 72
Midwest: 341
South: 79
West: 428
59% of the 98831 zip code residents lived in the same house 5 years ago. Out of people who lived in different houses, 56% lived in this county. Out of people who lived in different counties, 50% lived in Washington.
95% of the 98831 zip code residents lived in the same house 1 year ago. Out of people who lived in different houses, 57% moved from this county. Out of people who lived in different houses, 27% moved from different county within same state. Out of people who lived in different houses, 25% moved from different state.
Private vs. public school enrollment:
Students in private schools in grades 1 to 8 (elementary and middle school):
Here:
0.0%
Washington:
12.4%
Students in private schools in grades 9 to 12 (high school):
Here:
0.0%
Washington:
9.2%
Students in private undergraduate colleges: 23
Here:
11.0%
Washington:
16.5%
Occupation by median earnings in the past 12 months ($)
70,893Management occupations
69,784Education, training, and library occupations
40,901Construction and extraction occupations
39,203Building and grounds cleaning and maintenance occupations
36,677Material moving occupations
34,821Healthcare support occupations
Companies with federal contracts located in this zip code:
ALLEN CONSTRUCTION, INC. (150 W WAPATO WAY in MANSON, WA; small business) 6 employees, $700000 revenue.
$18,975 with Forest Service for Forest/Range Fire Suppression/Presuppression Services. Signed on 2003-07-15. Completion date: 2003-07-15.
Top industries in this zip code by the number of employees in 2005:
Real Estate and Rental and Leasing: Nonresidential Property Managers (50-99 employees: 1 establishment)
Construction: New Single-Family Housing Construction (except Operative Builders) (10-19: 1, 5-9: 4, 1-4: 6)
Accommodation and Food Services: Limited-Service Restaurants (10-19: 1, 1-4: 2)
Accommodation and Food Services: Full-Service Restaurants (10-19: 1, 1-4: 1)
Construction: New Multifamily Housing Construction (except Operative Builders) (10-19: 1)
Administrative and Support and Waste Management and Remediation Services: Landscaping Services (5-9: 1, 1-4: 4)
People in group quarters in 2010:
29 people in workers' group living quarters and job corps centers
People in group quarters in 2000:
35 people in agriculture workers' dormitories on farms
Home Mortgage Disclosure Act Aggregated Statistics For Year 2009 (Based on 2 partial tracts)
A) FHA, FSA/RHS & VA Home Purchase Loans
B) Conventional Home Purchase Loans
C) Refinancings
D) Home Improvement Loans
F) Non-occupant Loans on < 5 Family Dwellings (A B C & D)
G) Loans On Manufactured Home Dwelling (A B C & D)
Number
Average Value
Number
Average Value
Number
Average Value
Number
Average Value
Number
Average Value
Number
Average Value
LOANS ORIGINATED
10
$230,636
38
$262,880
214
$259,770
17
$92,688
87
$314,887
35
$140,823
APPLICATIONS APPROVED, NOT ACCEPTED
0
$0
5
$99,434
32
$261,987
6
$196,432
13
$290,677
10
$133,267
APPLICATIONS DENIED
3
$199,610
24
$203,911
70
$252,419
8
$112,379
25
$321,429
22
$127,577
APPLICATIONS WITHDRAWN
0
$0
2
$331,180
32
$340,116
3
$135,013
2
$2,001,385
2
$199,345
FILES CLOSED FOR INCOMPLETENESS
0
$0
0
$0
14
$680,970
3
$198,550
3
$1,429,560
2
$178,695
Aggregated Statistics For Year 2008 (Based on 2 partial tracts)
A) FHA, FSA/RHS & VA Home Purchase Loans
B) Conventional Home Purchase Loans
C) Refinancings
D) Home Improvement Loans
F) Non-occupant Loans on < 5 Family Dwellings (A B C & D)
G) Loans On Manufactured Home Dwelling (A B C & D)
Number
Average Value
Number
Average Value
Number
Average Value
Number
Average Value
Number
Average Value
Number
Average Value
LOANS ORIGINATED
3
$142,957
33
$284,612
122
$296,054
11
$132,993
37
$303,470
27
$154,722
APPLICATIONS APPROVED, NOT ACCEPTED
0
$0
5
$239,214
25
$256,368
0
$0
8
$261,291
3
$81,537
APPLICATIONS DENIED
2
$196,960
22
$412,262
49
$305,232
11
$269,739
11
$448,795
16
$124,888
APPLICATIONS WITHDRAWN
0
$0
8
$241,239
27
$285,677
0
$0
16
$365,332
6
$109,865
FILES CLOSED FOR INCOMPLETENESS
2
$146,135
3
$327,740
10
$277,652
2
$119,130
3
$299,150
0
$0
Aggregated Statistics For Year 2007 (Based on 2 partial tracts)
A) FHA, FSA/RHS & VA Home Purchase Loans
B) Conventional Home Purchase Loans
C) Refinancings
D) Home Improvement Loans
F) Non-occupant Loans on < 5 Family Dwellings (A B C & D)
G) Loans On Manufactured Home Dwelling (A B C & D)
Number
Average Value
Number
Average Value
Number
Average Value
Number
Average Value
Number
Average Value
Number
Average Value
LOANS ORIGINATED
3
$167,840
65
$281,684
149
$316,507
14
$144,885
75
$356,416
27
$121,307
APPLICATIONS APPROVED, NOT ACCEPTED
2
$132,630
17
$251,902
10
$341,665
2
$15,885
11
$256,310
5
$164,558
APPLICATIONS DENIED
0
$0
22
$330,604
73
$263,435
14
$213,866
14
$579,312
11
$185,121
APPLICATIONS WITHDRAWN
2
$132,630
16
$236,771
37
$243,626
8
$251,166
16
$386,577
5
$124,212
FILES CLOSED FOR INCOMPLETENESS
0
$0
0
$0
10
$273,522
0
$0
0
$0
0
$0
Aggregated Statistics For Year 2006 (Based on 2 partial tracts)
A) FHA, FSA/RHS & VA Home Purchase Loans
B) Conventional Home Purchase Loans
C) Refinancings
D) Home Improvement Loans
F) Non-occupant Loans on < 5 Family Dwellings (A B C & D)
G) Loans On Manufactured Home Dwelling (A B C & D)
Number
Average Value
Number
Average Value
Number
Average Value
Number
Average Value
Number
Average Value
Number
Average Value
LOANS ORIGINATED
2
$137,395
114
$264,928
133
$253,105
19
$171,631
108
$273,690
33
$104,594
APPLICATIONS APPROVED, NOT ACCEPTED
0
$0
25
$190,100
22
$264,685
5
$324,986
16
$230,814
5
$131,520
APPLICATIONS DENIED
2
$138,190
44
$270,858
67
$245,230
24
$118,667
24
$315,298
25
$95,431
APPLICATIONS WITHDRAWN
0
$0
25
$175,423
38
$234,749
6
$64,330
17
$173,229
3
$137,133
FILES CLOSED FOR INCOMPLETENESS
0
$0
3
$502,993
10
$248,902
0
$0
5
$294,172
0
$0
Aggregated Statistics For Year 2005 (Based on 2 partial tracts)
A) FHA, FSA/RHS & VA Home Purchase Loans
B) Conventional Home Purchase Loans
C) Refinancings
D) Home Improvement Loans
F) Non-occupant Loans on < 5 Family Dwellings (A B C & D)
G) Loans On Manufactured Home Dwelling (A B C & D)
Number
Average Value
Number
Average Value
Number
Average Value
Number
Average Value
Number
Average Value
Number
Average Value
LOANS ORIGINATED
5
$138,190
135
$251,238
141
$298,811
19
$156,332
122
$348,641
24
$94,973
APPLICATIONS APPROVED, NOT ACCEPTED
0
$0
11
$413,128
22
$174,363
0
$0
10
$366,126
3
$82,067
APPLICATIONS DENIED
3
$131,837
33
$180,837
62
$288,013
14
$235,537
17
$183,694
17
$98,107
APPLICATIONS WITHDRAWN
2
$113,570
19
$259,244
33
$202,256
6
$111,717
19
$287,835
5
$110,552
FILES CLOSED FOR INCOMPLETENESS
0
$0
3
$78,890
19
$213,180
0
$0
3
$577,120
2
$112,775
Aggregated Statistics For Year 2004 (Based on 2 partial tracts)
A) FHA, FSA/RHS & VA Home Purchase Loans
B) Conventional Home Purchase Loans
C) Refinancings
D) Home Improvement Loans
E) Loans on Dwellings For 5+ Families
F) Non-occupant Loans on < 5 Family Dwellings (A B C & D)
G) Loans On Manufactured Home Dwelling (A B C & D)
Detailed PMIC statistics for the following Tracts:9604.00
2002 - 2018 National Fire Incident Reporting System (NFIRS) incidents
According to the data from the years 2002 - 2018 the average number of fires per year is 21. The highest number of fire incidents - 45 took place in 2002, and the least - 14 in 2006. The data has a decreasing trend.
When looking into fire subcategories, the most reports belonged to: Outside Fires (51.7%), and Structure Fires (36.1%).
Fire incident types reported to NFIRS in Zip Code 98831


 Nearest zip codes: 98846, 98834, 98817, 98843, 98816, 98814.


 According to the data from the years 2002 - 2018 the average number of fires per year is 21. The highest number of fire incidents - 45 took place in 2002, and the least - 14 in 2006. The data has a decreasing trend.
 When looking into fire subcategories, the most reports belonged to: Outside Fires (51.7%), and Structure Fires (36.1%).