Estimated zip code population in 2022: 4,433 Zip code population in 2010: 4,190 Zip code population in 2000: 3,885
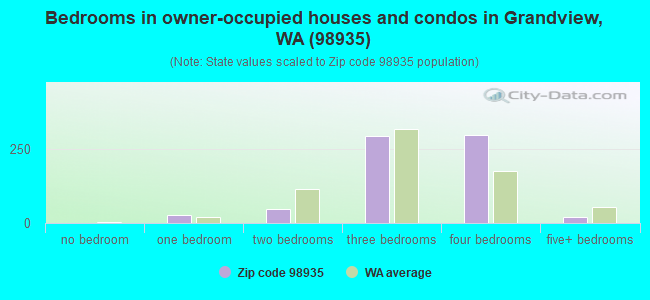
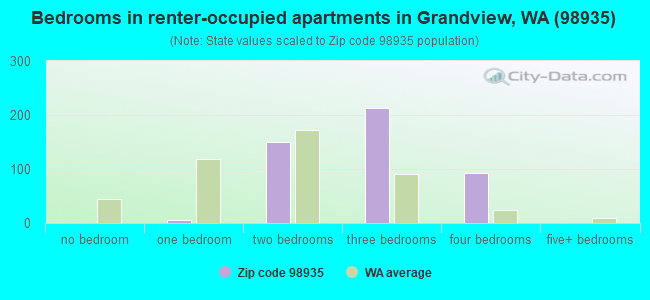
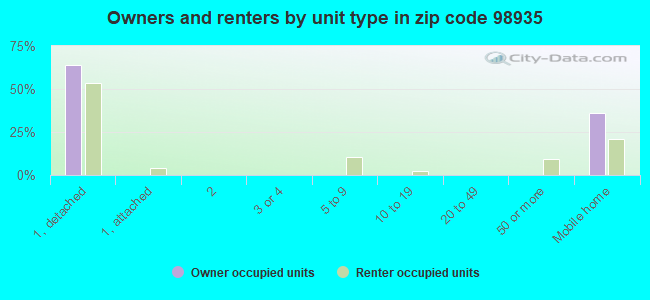
Houses and condos: 1,253 Renter-occupied apartments: 480
% of renters here:
41%
State:
36%
March 2022 cost of living index in zip code 98935: 93.8 (less than average, U.S. average is 100)
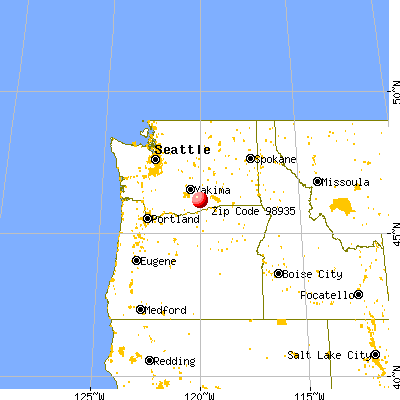
Land area: 267.7 sq. mi. Water area: 1.2 sq. mi.
Population density: 17 people per square mile
(very low).
OSM Map
General Map
Google Map
MSN Map
OSM Map
General Map
Google Map
MSN Map
OSM Map
General Map
Google Map
MSN Map
OSM Map
General Map
Google Map
MSN Map
Please wait while loading the map...
Real estate property taxes paid for housing units in 2022:
This zip code:
0.7% ($1,328)
Washington:
0.8% ($4,283)
Median real estate property taxes paid for housing units with mortgages in 2022: $1,458 (0.7%) Median real estate property taxes paid for housing units with no mortgage in 2022: $1,205 (0.7%)
Business Search- 14 Million verified businesses
Males: 2,248
(50.7%)
Females: 2,185
(49.3%)
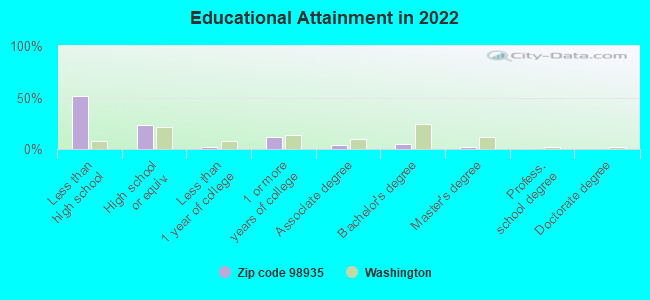
For population 25 years and over in 98935:
High school or higher: 46.4%
Bachelor's degree or higher: 7.1%
Graduate or professional degree: 2.1%
Unemployed: 6.7%
Mean travel time to work (commute): 22.1 minutes
For population 15 years and over in 98935:
Never married: 40.0%
Now married: 44.3%
Separated: 1.5%
Widowed: 8.6%
Divorced: 5.6%
Zip code 98935 compared to state average:
Median household income below state average.
Median house value significantly below state average.
Black race population percentage significantly below state average.
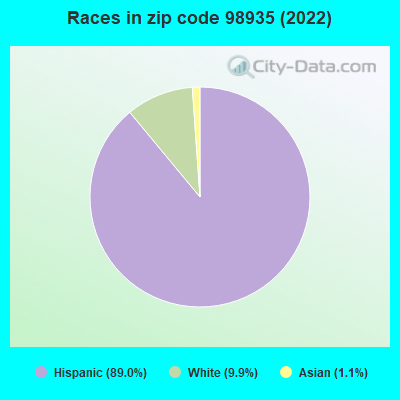
Hispanic race population percentage significantly above state average.
Median age significantly below state average.
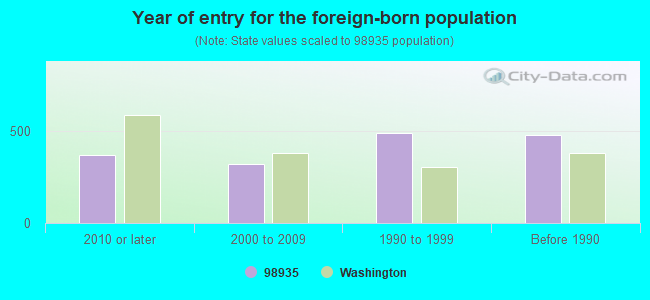
Foreign-born population percentage significantly above state average.
Length of stay since moving in significantly above state average.
Percentage of population with a bachelor's degree or higher significantly below state average.
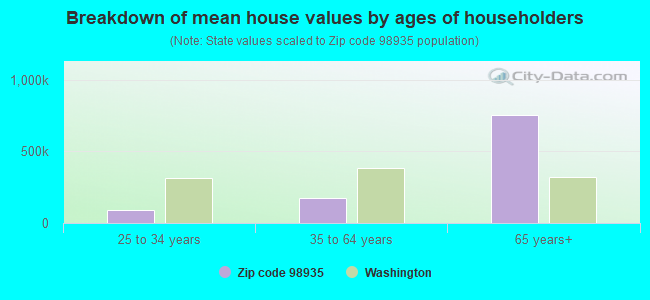
Estimated median house/condo value in 2022: $202,585
98935:
$202,585
Washington:
$569,500
According to our research of Washington and other state lists, there was 1 registered sex offender living in 98935 zip code as of June 16, 2024. The ratio of all residents to sex offenders in zip code 98935 is 3,412 to 1. The ratio of registered sex offenders to all residents in this zip code is much lower than the state average.
Median resident age:
This zip code:
26.1 years
Washington median age:
38.4 years
Average household size:
This zip code:
3.7 people
Washington:
2.5 people
Averages for the 2020 tax year for zip code 98935, filed in 2021:
Average Adjusted Gross Income (AGI) in 2020: $44,230 (Individual Income Tax Returns)
Here:
$44,230
State:
$99,264
Salary/wage: $37,112 (reported on 90.9% of returns)
Here:
$37,112
State:
$80,347
(% of AGI for various income ranges: 1600.2% for AGIs below $25k, 4122.3% for AGIs $25k-50k, 7463.3% for AGIs $50k-75k, 9334.4% for AGIs $75k-100k, 19160.0% for AGIs $100k-200k)
Taxable interest for individuals: $1,041 (reported on 9.1% of returns)
This zip code:
$1,041
Washington:
$2,077
(% of AGI for various income ranges: 1.0% for AGIs below $25k, 5.0% for AGIs $25k-50k, 4.8% for AGIs $50k-75k, 25.6% for AGIs $75k-100k, 226.0% for AGIs $100k-200k)
Ordinary dividends: $2,371 (reported on 3.7% of returns)
Here:
$2,371
State:
$10,013
(% of AGI for various income ranges: 3.6% for AGIs below $25k, 4.3% for AGIs $50k-75k, 278.0% for AGIs $100k-200k)
Net capital gain/loss in AGI: +$23,786 (reported on 3.7% of returns)
Here:
+$23,786
State:
+$40,092
(% of AGI for various income ranges: 22.3% for AGIs $25k-50k, 3098.0% for AGIs $100k-200k)
Profit/loss from business: +$10,185 (reported on 7.0% of returns)
Here:
+$10,185
State:
+$18,312
(% of AGI for various income ranges: 60.4% for AGIs below $25k, 84.4% for AGIs $25k-50k, 246.2% for AGIs $50k-75k, 73.3% for AGIs $75k-100k)
Taxable individual retirement arrangement distribution: $11,567 (reported on 1.6% of returns)
98935:
$11,567
Washington:
$24,221
(% of AGI for various income ranges: 385.6% for AGIs $75k-100k)
Total itemized deductions: $29,000 (reported on 1.6% of returns)
Here:
$29,000
State:
$39,068
(% of AGI for various income ranges: 167.3% for AGIs $25k-50k)
Taxes paid: $5,350 (reported on 1.1% of returns)
98935:
$5,350
State:
$7,774
(% of AGI for various income ranges: 20.6% for AGIs $25k-50k)
Earned income credit: $2,636 (reported on 23.5% of returns)
Here:
$2,636
State:
$2,020
(% of AGI for various income ranges: 127.4% for AGIs below $25k, 100.6% for AGIs $25k-50k)
Percentage of individuals using paid preparers for their 2020 taxes: 91.4%
Here:
91%
State:
93%
(% for various income ranges: 91.3% for AGIs below $25k, 89.6% for AGIs $25k-50k, 93.1% for AGIs $50k-75k, 91.7% for AGIs $75k-100k, 100.0% for AGIs $100k-200k)
Averages for the 2012 tax year for zip code 98935, filed in 2013:
Average Adjusted Gross Income (AGI) in 2012: $34,451 (Individual Income Tax Returns)
Here:
$34,451
State:
$69,533
Salary/wage: $26,938 (reported on 93.6% of returns)
Here:
$26,938
State:
$57,267
(% of AGI for various income ranges: 86.2% for AGIs below $25k, 90.3% for AGIs $25k-50k, 81.7% for AGIs $50k-75k, 76.5% for AGIs $75k-100k, 31.9% for AGIs $100k-200k)
Taxable interest for individuals: $4,305 (reported on 12.3% of returns)
This zip code:
$4,305
Washington:
$1,816
(% of AGI for various income ranges: 0.3% for AGIs below $25k, 0.2% for AGIs $25k-50k, 1.6% for AGIs $50k-75k, 4.8% for AGIs $100k-200k)
Ordinary dividends: $1,271 (reported on 4.1% of returns)
Here:
$1,271
State:
$8,163
Net capital gain/loss in AGI: +$45,017 (reported on 3.5% of returns)
Here:
+$45,017
State:
+$21,568
Profit/loss from business: +$9,755 (reported on 6.4% of returns)
Here:
+$9,755
State:
+$16,521
(% of AGI for various income ranges: 4.7% for AGIs below $25k, 2.5% for AGIs $25k-50k)
Taxable individual retirement arrangement distribution: $8,400 (reported on 1.8% of returns)
98935:
$8,400
Washington:
$18,648
Total itemized deductions: $18,785 (17% of AGI, reported on 7.6% of returns)
Here:
$18,785
State:
$23,872
Here:
17.4% of AGI
State:
18.2% of AGI
(% of AGI for various income ranges: 4.9% for AGIs $25k-50k, 10.0% for AGIs $50k-75k, 4.2% for AGIs $100k-200k)
Charity contributions: $5,617 (reported on 3.5% of returns)
Here:
$5,617
State:
$4,465
(% of AGI for various income ranges: 0.3% for AGIs below $25k, 0.7% for AGIs $50k-75k, 1.7% for AGIs $100k-200k)
Taxes paid: $2,969 (reported on 7.6% of returns)
98935:
$2,969
State:
$6,400
(% of AGI for various income ranges: 0.8% for AGIs $25k-50k, 1.3% for AGIs $50k-75k, 0.8% for AGIs $100k-200k)
Earned income credit: $2,726 (reported on 36.3% of returns)
Here:
$2,726
State:
$2,073
(% of AGI for various income ranges: 10.0% for AGIs below $25k, 2.2% for AGIs $25k-50k)
Percentage of individuals using paid preparers for their 2012 taxes: 65.5%
Here:
65%
State:
43%
(% for various income ranges: 64.8% for AGIs below $25k, 65.5% for AGIs $25k-50k, 66.7% for AGIs $50k-75k, 75.0% for AGIs $75k-100k, 66.7% for AGIs $100k-200k)
Averages for the 2004 tax year for zip code 98935, filed in 2005:
Average Adjusted Gross Income (AGI) in 2004: $24,313 (Individual Income Tax Returns)
Here:
$24,313
State:
$54,331
Salary/wage: $23,285 (reported on 92.2% of returns)
Here:
$23,285
State:
$45,761
(% of AGI for various income ranges: 88.4% for AGIs $10k-25k, 85.8% for AGIs $25k-50k, 86.8% for AGIs $50k-75k, 84.3% for AGIs $75k-100k, 42.2% for AGIs over 100k)
Taxable interest for individuals: $1,665 (reported on 18.6% of returns)
This zip code:
$1,665
Washington:
$2,110
(% of AGI for various income ranges: 0.6% for AGIs $10k-25k, 1.1% for AGIs $25k-50k, 1.5% for AGIs $50k-75k, 0.6% for AGIs $75k-100k, 2.8% for AGIs over 100k)
Taxable dividends: $1,149 (reported on 6.2% of returns)
Here:
$1,149
State:
$5,879
(% of AGI for various income ranges: 0.1% for AGIs $10k-25k, 0.2% for AGIs $25k-50k, 0.2% for AGIs $50k-75k, 0.7% for AGIs $75k-100k)
Net capital gain/loss: +$9,705 (reported on 6.8% of returns)
Here:
+$9,705
State:
+$15,835
(% of AGI for various income ranges: 0.7% for AGIs $10k-25k, 1.2% for AGIs $25k-50k, 0.6% for AGIs $50k-75k, 20.5% for AGIs over 100k)
Profit/loss from business: +$6,038 (reported on 9.4% of returns)
Here:
+$6,038
State:
+$13,994
(% of AGI for various income ranges: 3.2% for AGIs $10k-25k, 3.6% for AGIs $25k-50k, -0.6% for AGIs $50k-75k)
Total itemized deductions: $14,669 (27% of AGI, reported on 8.4% of returns)
Here:
$14,669
State:
$19,669
Here:
26.6% of AGI
State:
20.7% of AGI
(% of AGI for various income ranges: 3.0% for AGIs $10k-25k, 3.8% for AGIs $25k-50k, 8.0% for AGIs $50k-75k, 9.1% for AGIs $75k-100k, 7.5% for AGIs over 100k)
Charity contributions deductions: $2,852 (5% of AGI, reported on 5.8% of returns)
Here:
$2,852
State:
$3,569
Here:
4.8% of AGI
State:
3.5% of AGI
(% of AGI for various income ranges: 0.2% for AGIs $10k-25k, 0.2% for AGIs $25k-50k, 0.9% for AGIs $50k-75k, 5.0% for AGIs $75k-100k)
Total tax: $3,177 (reported on 45.7% of returns)
98935:
$3,177
State:
$9,065
(% of AGI for various income ranges: 1.8% for AGIs $10k-25k, 4.1% for AGIs $25k-50k, 7.7% for AGIs $50k-75k, 11.3% for AGIs $75k-100k, 16.9% for AGIs over 100k)
Earned income credit: $2,172 (reported on 40.0% of returns)
Here:
$2,172
State:
$1,607
Percentage of individuals using paid preparers for their 2004 taxes: 62.1%
Here:
62%
State:
49%
(% for various income ranges: 55.1% for AGIs below $10k, 64.2% for AGIs $10k-25k, 62.0% for AGIs $25k-50k, 62.5% for AGIs $50k-75k, 73.3% for AGIs $75k-100k, 90.0% for AGIs over 100k)
Household received Food Stamps/SNAP in the past 12 months: 379 Household did not receive Food Stamps/SNAP in the past 12 months: 797
Women who had a birth in the past 12 months: 39 (0 now married, 35 unmarried) Women who did not have a birth in the past 12 months: 1,103 (429 now married, 676 unmarried)
Housing units in zip code 98935 with a mortgage: 438 (6 second mortgage, 6 both second mortgage and home equity loan) Median monthly owner costs for units with a mortgage: $1,330 Median monthly owner costs for units without a mortgage: $400
Residents with income below the poverty level in 2022:
This zip code:
18.7%
Whole state:
10.0%
Residents with income below 50% of the poverty level in 2022:
This zip code:
5.9%
Whole state:
4.6%
Median number of rooms in houses and condos:
Here:
5.9
State:
6.5
Median number of rooms in apartments:
Here:
4.9
State:
3.9
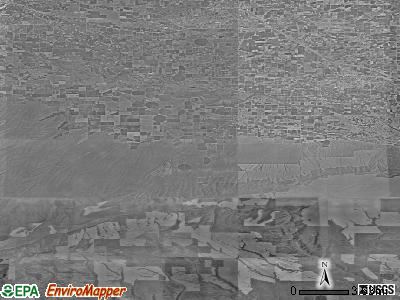
Notable locations in this zip code not listed on our city pages
Notable locations in zip code 98935: Satus Number 3 Pumping Station (A), Donoho Ranch (B), Plainview (C), Empire (D), Sampson Cabin (E), Wandlings Lower Camp (F), Yakima County Fire District 5 Mabton Fire Department Station 15 (G). Display/hide their locations on the map
Lakes: Giffin Lake (A), Morgan Lake (B), Bos Lake (C), Bridgeman Pond (D), Byron Ponds (E), Round Lake (F), Cockleburr Lake (G), Slaughterhouse Lake (H). Display/hide their locations on the map
Parks in zip code 98935 include: Sunnyside State Wildlife Recreation Area (1), Sunnyside Wildlife Recreation Area (2). Display/hide their locations on the map
In group quarters: 61 (-1 institutionalized population)
Size of family households: 313 2-persons, 166 3-persons, 148 4-persons, 208 5-persons, 174 6-persons, 44 7-or-more-persons
Size of nonfamily households: 75 1-person, 27 2-persons
513 married couples with children.
633 single-parent households (84 men, 549 women).
18.3% of residents of 98935 zip code speak English at home.
84.7% of residents speak Spanish at home (57% very well, 8% well, 14% not well, 21% not at all).
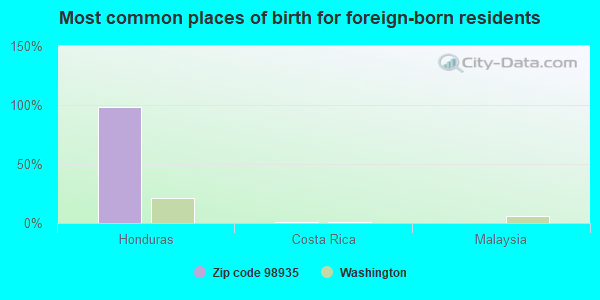
Foreign born population: 1,689 (38.1%) (21.7% of them are naturalized citizens)
This zip code:
38.1%
Whole state:
15.3%
98%Honduras
1%Costa Rica
0%Malaysia
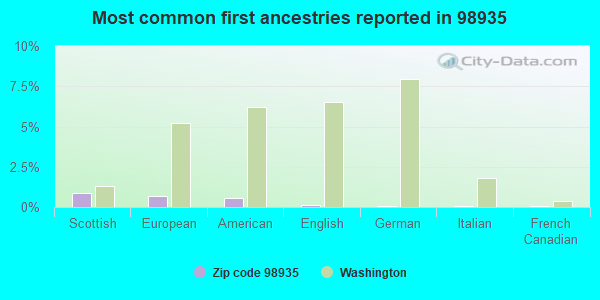
1%Scottish
1%European
1%American
0%English
0%German
0%Italian
0%French Canadian
Year of entry for the foreign-born population
3702010 or later
3222000 to 2009
4921990 to 1999
482Before 1990
Facilities with environmental interests located in this zip code:
ARTZ-FOX ELEMENTARY (805 WASHINGTON STREET in MABTON, WA)
(National Center for Education Statistics) - STATE ID-3070 Organizations: MABTON SCHOOL DISTRICT 120 (SCHOOL DISTRICT)
ARTZ FOX ELEMENTARY SCHOOL (806 E WASHINGTON in MABTON, WA)
(Resource Conservation and Recovery Act (tracking hazardous waste))
Housing units lacking complete plumbing facilities: 3.0% Housing units lacking complete kitchen facilities: 5.8%
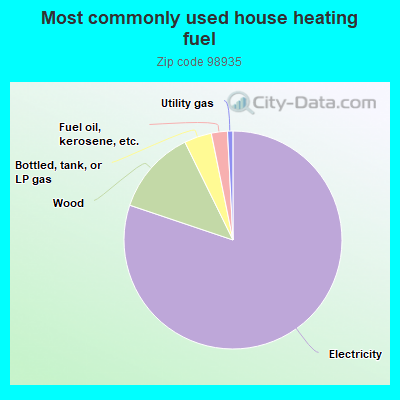
80.5%Electricity
12.6%Wood
4.1%Bottled, tank, or LP gas
2.4%Fuel oil, kerosene, etc.
0.8%Utility gas
Population in 1990: 3,586. Population change in the 1990s: +299 (+8.3%).
Place of birth for U.S.-born residents:
This state: 2,424
Midwest: 24
South: 122
West: 180
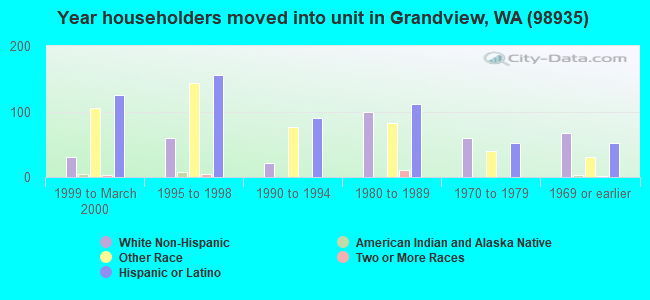
65% of the 98935 zip code residents lived in the same house 5 years ago. Out of people who lived in different houses, 72% lived in this county. Out of people who lived in different counties, 50% lived in Washington.
95% of the 98935 zip code residents lived in the same house 1 year ago. Out of people who lived in different houses, 80% moved from this county. Out of people who lived in different houses, 24% moved from different county within same state. Out of people who lived in different houses, 2% moved from different state.
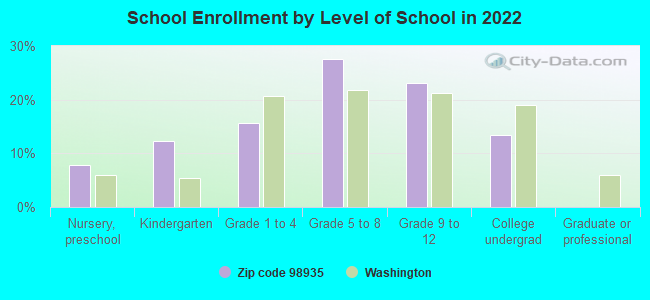
Private vs. public school enrollment:
Students in private schools in grades 1 to 8 (elementary and middle school): 18
Here:
3.2%
Washington:
12.4%
Students in private schools in grades 9 to 12 (high school):
Here:
0.0%
Washington:
9.2%
Students in private undergraduate colleges: 16
Here:
9.0%
Washington:
16.5%
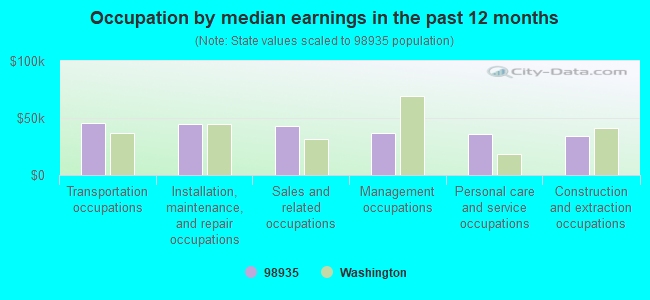
Occupation by median earnings in the past 12 months ($)
45,978Transportation occupations
45,153Installation, maintenance, and repair occupations
43,292Sales and related occupations
37,243Management occupations
35,800Personal care and service occupations
34,144Construction and extraction occupations
Top industries in this zip code by the number of employees in 2005:
Health Care and Social Assistance: Child Day Care Services (10-19 employees: 1 establishment, 5-9 employees: 1 establishment)
Accommodation and Food Services: Caterers (5-9: 1)
Other Services (except Public Administration): Commercial and Industrial Machinery and Equipment (except Automotive and Electronic) Repair and Maintenance (1-4: 1)
Construction: New Single-Family Housing Construction (except Operative Builders) (1-4: 1)
Construction: Roofing Contractors (1-4: 1)
Construction: Other Foundation, Structure, and Building Exterior Contractors (1-4: 1)
People in group quarters in 2010:
8 people in group homes intended for adults
People in group quarters in 2000:
54 people in other noninstitutional group quarters
Fatal accident statistics in 2013:
Fatal accident count: 2
Vehicles involved in fatal accidents: 3
Fatal accidents caused by drunken drivers: 0
Fatalities: 2
Persons involved in fatal accidents: 3
Pedestrians involved in fatal accidents: 0
Fatal accident statistics in 2012:
Fatal accident count: 2
Vehicles involved in fatal accidents: 2
Fatal accidents caused by drunken drivers: 1
Fatalities: 3
Persons involved in fatal accidents: 9
Pedestrians involved in fatal accidents: 1
Home Mortgage Disclosure Act Aggregated Statistics For Year 2009 (Based on 2 full tracts)
A) FHA, FSA/RHS & VA Home Purchase Loans
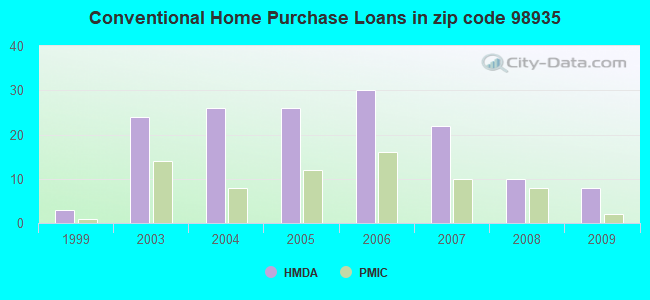
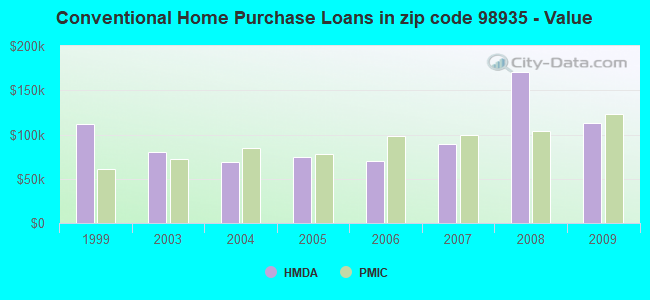
B) Conventional Home Purchase Loans
C) Refinancings
D) Home Improvement Loans
F) Non-occupant Loans on < 5 Family Dwellings (A B C & D)
G) Loans On Manufactured Home Dwelling (A B C & D)
Number
Average Value
Number
Average Value
Number
Average Value
Number
Average Value
Number
Average Value
Number
Average Value
LOANS ORIGINATED
10
$95,940
8
$113,194
32
$186,495
6
$78,455
10
$404,904
10
$425,049
APPLICATIONS APPROVED, NOT ACCEPTED
0
$0
6
$80,117
14
$77,932
4
$79,285
0
$0
6
$81,778
APPLICATIONS DENIED
4
$73,302
6
$60,170
62
$92,138
8
$69,811
6
$65,157
6
$67,152
APPLICATIONS WITHDRAWN
0
$0
2
$27,925
6
$126,990
0
$0
0
$0
0
$0
FILES CLOSED FOR INCOMPLETENESS
0
$0
0
$0
0
$0
0
$0
0
$0
0
$0
Aggregated Statistics For Year 2008 (Based on 2 full tracts)
A) FHA, FSA/RHS & VA Home Purchase Loans
B) Conventional Home Purchase Loans
C) Refinancings
D) Home Improvement Loans
F) Non-occupant Loans on < 5 Family Dwellings (A B C & D)
G) Loans On Manufactured Home Dwelling (A B C & D)
Number
Average Value
Number
Average Value
Number
Average Value
Number
Average Value
Number
Average Value
Number
Average Value
LOANS ORIGINATED
6
$124,330
10
$170,339
36
$83,164
6
$35,238
4
$46,872
8
$99,231
APPLICATIONS APPROVED, NOT ACCEPTED
0
$0
2
$115,685
14
$92,891
0
$0
6
$98,733
6
$88,427
APPLICATIONS DENIED
2
$117,680
22
$109,794
78
$96,099
8
$57,095
4
$91,752
14
$83,631
APPLICATIONS WITHDRAWN
4
$104,718
14
$112,125
8
$80,282
4
$72,305
4
$77,290
0
$0
FILES CLOSED FOR INCOMPLETENESS
0
$0
4
$84,770
8
$73,551
0
$0
0
$0
0
$0
Aggregated Statistics For Year 2007 (Based on 2 full tracts)
A) FHA, FSA/RHS & VA Home Purchase Loans
B) Conventional Home Purchase Loans
C) Refinancings
D) Home Improvement Loans
F) Non-occupant Loans on < 5 Family Dwellings (A B C & D)
G) Loans On Manufactured Home Dwelling (A B C & D)
Number
Average Value
Number
Average Value
Number
Average Value
Number
Average Value
Number
Average Value
Number
Average Value
LOANS ORIGINATED
4
$30,418
22
$89,666
30
$87,164
14
$16,099
4
$34,905
10
$82,776
APPLICATIONS APPROVED, NOT ACCEPTED
0
$0
2
$64,825
12
$100,062
4
$34,905
2
$98,735
2
$39,890
APPLICATIONS DENIED
2
$37,895
20
$71,008
70
$90,384
4
$64,325
14
$120,816
10
$98,334
APPLICATIONS WITHDRAWN
0
$0
0
$0
18
$90,754
0
$0
0
$0
2
$39,890
FILES CLOSED FOR INCOMPLETENESS
0
$0
2
$99,730
6
$148,598
0
$0
2
$99,730
0
$0
Aggregated Statistics For Year 2006 (Based on 2 full tracts)
A) FHA, FSA/RHS & VA Home Purchase Loans
B) Conventional Home Purchase Loans
C) Refinancings
D) Home Improvement Loans
F) Non-occupant Loans on < 5 Family Dwellings (A B C & D)
G) Loans On Manufactured Home Dwelling (A B C & D)
Number
Average Value
Number
Average Value
Number
Average Value
Number
Average Value
Number
Average Value
Number
Average Value
LOANS ORIGINATED
10
$103,520
30
$69,811
48
$78,371
2
$5,985
8
$71,556
12
$61,500
APPLICATIONS APPROVED, NOT ACCEPTED
0
$0
10
$48,070
10
$107,509
2
$14,960
0
$0
2
$85,770
APPLICATIONS DENIED
2
$92,750
18
$85,657
64
$92,032
18
$54,852
4
$71,805
18
$89,314
APPLICATIONS WITHDRAWN
2
$76,790
12
$95,575
36
$108,872
2
$59,840
0
$0
6
$94,078
FILES CLOSED FOR INCOMPLETENESS
0
$0
4
$55,850
8
$76,294
0
$0
4
$51,860
0
$0
Aggregated Statistics For Year 2005 (Based on 2 full tracts)
A) FHA, FSA/RHS & VA Home Purchase Loans
B) Conventional Home Purchase Loans
C) Refinancings
D) Home Improvement Loans
F) Non-occupant Loans on < 5 Family Dwellings (A B C & D)
G) Loans On Manufactured Home Dwelling (A B C & D)
Number
Average Value
Number
Average Value
Number
Average Value
Number
Average Value
Number
Average Value
Number
Average Value
LOANS ORIGINATED
2
$74,800
26
$74,107
36
$69,534
6
$28,922
4
$56,348
12
$66,487
APPLICATIONS APPROVED, NOT ACCEPTED
0
$0
8
$68,814
22
$58,025
2
$19,945
4
$76,292
2
$70,810
APPLICATIONS DENIED
2
$75,795
22
$68,723
64
$80,189
14
$29,349
4
$75,795
16
$66,321
APPLICATIONS WITHDRAWN
2
$85,770
8
$48,868
30
$119,144
4
$88,260
2
$67,815
10
$87,563
FILES CLOSED FOR INCOMPLETENESS
0
$0
2
$186,495
4
$82,775
2
$4,985
0
$0
0
$0
Aggregated Statistics For Year 2004 (Based on 2 full tracts)
A) FHA, FSA/RHS & VA Home Purchase Loans
B) Conventional Home Purchase Loans
C) Refinancings
D) Home Improvement Loans
F) Non-occupant Loans on < 5 Family Dwellings (A B C & D)
G) Loans On Manufactured Home Dwelling (A B C & D)
Number
Average Value
Number
Average Value
Number
Average Value
Number
Average Value
Number
Average Value
Number
Average Value
LOANS ORIGINATED
2
$136,630
26
$69,120
50
$261,173
8
$41,139
6
$52,525
12
$76,626
APPLICATIONS APPROVED, NOT ACCEPTED
0
$0
8
$72,802
10
$68,415
0
$0
0
$0
6
$84,438
APPLICATIONS DENIED
2
$80,780
16
$50,738
102
$95,897
8
$19,448
2
$29,920
18
$61,278
APPLICATIONS WITHDRAWN
0
$0
6
$47,870
30
$94,212
4
$14,960
8
$62,331
2
$34,905
FILES CLOSED FOR INCOMPLETENESS
0
$0
4
$119,675
4
$117,182
0
$0
0
$0
0
$0
Aggregated Statistics For Year 2003 (Based on 2 full tracts)
A) FHA, FSA/RHS & VA Home Purchase Loans
B) Conventional Home Purchase Loans
C) Refinancings
D) Home Improvement Loans
F) Non-occupant Loans on < 5 Family Dwellings (A B C & D)
Number
Average Value
Number
Average Value
Number
Average Value
Number
Average Value
Number
Average Value
LOANS ORIGINATED
6
$93,413
24
$80,200
82
$84,868
4
$40,890
0
$0
APPLICATIONS APPROVED, NOT ACCEPTED
0
$0
12
$96,572
6
$93,747
2
$13,960
0
$0
APPLICATIONS DENIED
0
$0
18
$93,857
66
$89,364
4
$54,352
0
$0
APPLICATIONS WITHDRAWN
2
$93,745
4
$79,285
32
$77,042
0
$0
2
$51,860
FILES CLOSED FOR INCOMPLETENESS
0
$0
0
$0
0
$0
0
$0
0
$0
Aggregated Statistics For Year 1999 (Based on 1 partial tract)
Detailed PMIC statistics for the following Tracts:0027.01
2002 - 2018 National Fire Incident Reporting System (NFIRS) incidents
Based on the data from the years 2002 - 2018 the average number of fire incidents per year is 34. The highest number of reported fire incidents - 47 took place in 2011, and the least - 20 in 2014. The data has a rising trend.
When looking into fire subcategories, the most reports belonged to: Outside Fires (51.2%), and Structure Fires (24.6%).
Fire incident types reported to NFIRS in Zip Code 98935


 Nearest zip codes: 99322, 98932, 98930, 98938, 98948, 98953.


 Based on the data from the years 2002 - 2018 the average number of fire incidents per year is 34. The highest number of reported fire incidents - 47 took place in 2011, and the least - 20 in 2014. The data has a rising trend.
 When looking into fire subcategories, the most reports belonged to: Outside Fires (51.2%), and Structure Fires (24.6%).