Estimated zip code population in 2022: 2,387 Zip code population in 2010: 2,106 Zip code population in 2000: 2,001
Houses and condos: 2,131 Renter-occupied apartments: 69
% of renters here:
6%
State:
36%
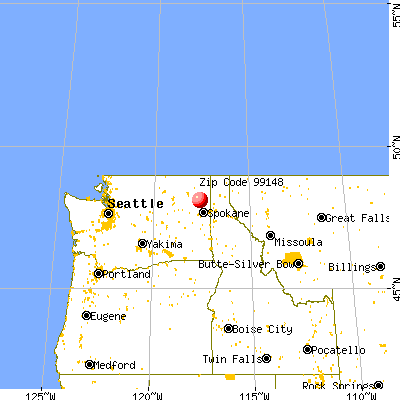
March 2022 cost of living index in zip code 99148: 88.9 (less than average, U.S. average is 100)
Land area: 57.9 sq. mi. Water area: 3.5 sq. mi.
Population density: 41 people per square mile
(very low).
OSM Map
General Map
Google Map
MSN Map
OSM Map
General Map
Google Map
MSN Map
OSM Map
General Map
Google Map
MSN Map
OSM Map
General Map
Google Map
MSN Map
Please wait while loading the map...
Real estate property taxes paid for housing units in 2022:
This zip code:
0.6% ($2,369)
Washington:
0.8% ($4,283)
Median real estate property taxes paid for housing units with mortgages in 2022: $2,668 (0.5%) Median real estate property taxes paid for housing units with no mortgage in 2022: $1,423 (0.5%)
Estimated median house/condo value in 2022: $404,328
99148:
$404,328
Washington:
$569,500
According to our research of Washington and other state lists, there was 1 registered sex offender living in 99148 zip code as of June 16, 2024. The ratio of all residents to sex offenders in zip code 99148 is 1,916 to 1. The ratio of registered sex offenders to all residents in this zip code is lower than the state average.
Median resident age:
This zip code:
56.8 years
Washington median age:
38.4 years
Average household size:
This zip code:
2.2 people
Washington:
2.5 people
Averages for the 2020 tax year for zip code 99148, filed in 2021:
Average Adjusted Gross Income (AGI) in 2020: $69,273 (Individual Income Tax Returns)
Here:
$69,273
State:
$99,264
Salary/wage: $57,696 (reported on 70.9% of returns)
Here:
$57,696
State:
$80,347
(% of AGI for various income ranges: 1080.0% for AGIs below $25k, 3158.4% for AGIs $25k-50k, 5140.8% for AGIs $50k-75k, 7686.2% for AGIs $75k-100k, 13477.0% for AGIs $100k-200k)
Taxable interest for individuals: $1,676 (reported on 40.9% of returns)
This zip code:
$1,676
Washington:
$2,077
(% of AGI for various income ranges: 25.0% for AGIs below $25k, 54.7% for AGIs $25k-50k, 56.2% for AGIs $50k-75k, 111.2% for AGIs $75k-100k, 202.0% for AGIs $100k-200k)
Ordinary dividends: $3,700 (reported on 18.2% of returns)
Here:
$3,700
State:
$10,013
(% of AGI for various income ranges: 38.6% for AGIs below $25k, 20.0% for AGIs $25k-50k, 40.0% for AGIs $50k-75k, 118.8% for AGIs $75k-100k, 349.0% for AGIs $100k-200k)
Net capital gain/loss in AGI: +$23,735 (reported on 20.9% of returns)
Here:
+$23,735
State:
+$40,092
(% of AGI for various income ranges: 5.0% for AGIs below $25k, 64.7% for AGIs $25k-50k, 290.8% for AGIs $50k-75k, 1109.0% for AGIs $100k-200k)
Profit/loss from business: +$8,281 (reported on 14.5% of returns)
Here:
+$8,281
State:
+$18,312
(% of AGI for various income ranges: 56.8% for AGIs below $25k, 205.8% for AGIs $25k-50k, 240.0% for AGIs $50k-75k, 497.0% for AGIs $100k-200k)
Taxable individual retirement arrangement distribution: $21,219 (reported on 14.5% of returns)
99148:
$21,219
Washington:
$24,221
(% of AGI for various income ranges: 100.5% for AGIs below $25k, 186.8% for AGIs $25k-50k, 609.2% for AGIs $50k-75k, 2027.0% for AGIs $100k-200k)
Total itemized deductions: $33,812 (reported on 7.3% of returns)
Here:
$33,812
State:
$39,068
(% of AGI for various income ranges: 343.2% for AGIs $25k-50k, 1185.0% for AGIs $75k-100k)
Charity contributions: $13,060 (reported on 4.5% of returns)
Here:
$13,060
State:
$15,331
(% of AGI for various income ranges: 102.6% for AGIs $25k-50k, 458.0% for AGIs $100k-200k)
Taxes paid: $7,614 (reported on 6.4% of returns)
99148:
$7,614
State:
$7,774
(% of AGI for various income ranges: 64.2% for AGIs $25k-50k, 262.5% for AGIs $75k-100k)
Earned income credit: $2,119 (reported on 14.5% of returns)
Here:
$2,119
State:
$2,020
(% of AGI for various income ranges: 83.6% for AGIs below $25k, 81.6% for AGIs $25k-50k)
Percentage of individuals using paid preparers for their 2020 taxes: 91.8%
Here:
92%
State:
93%
(% for various income ranges: 91.2% for AGIs below $25k, 92.3% for AGIs $25k-50k, 94.4% for AGIs $50k-75k, 90.9% for AGIs $75k-100k, 93.8% for AGIs $100k-200k, 80.0% for AGIs over 200k)
Averages for the 2012 tax year for zip code 99148, filed in 2013:
Average Adjusted Gross Income (AGI) in 2012: $49,575 (Individual Income Tax Returns)
Here:
$49,575
State:
$69,533
Salary/wage: $42,027 (reported on 70.3% of returns)
Here:
$42,027
State:
$57,267
(% of AGI for various income ranges: 60.5% for AGIs below $25k, 64.2% for AGIs $25k-50k, 56.3% for AGIs $50k-75k, 58.9% for AGIs $75k-100k, 59.2% for AGIs $100k-200k)
Taxable interest for individuals: $1,292 (reported on 41.8% of returns)
This zip code:
$1,292
Washington:
$1,816
(% of AGI for various income ranges: 1.5% for AGIs below $25k, 1.4% for AGIs $25k-50k, 1.7% for AGIs $50k-75k, 0.9% for AGIs $75k-100k, 0.5% for AGIs $100k-200k)
Ordinary dividends: $2,353 (reported on 20.9% of returns)
Here:
$2,353
State:
$8,163
(% of AGI for various income ranges: 1.9% for AGIs below $25k, 1.5% for AGIs $25k-50k, 1.0% for AGIs $50k-75k, 0.6% for AGIs $75k-100k, 0.7% for AGIs $100k-200k)
Net capital gain/loss in AGI: +$4,262 (reported on 14.3% of returns)
Here:
+$4,262
State:
+$21,568
(% of AGI for various income ranges: 0.2% for AGIs $50k-75k, 3.6% for AGIs $100k-200k)
Profit/loss from business: +$7,593 (reported on 15.4% of returns)
Here:
+$7,593
State:
+$16,521
(% of AGI for various income ranges: 5.2% for AGIs below $25k, 3.1% for AGIs $25k-50k, 1.0% for AGIs $50k-75k, 2.9% for AGIs $100k-200k)
Taxable individual retirement arrangement distribution: $12,521 (reported on 15.4% of returns)
99148:
$12,521
Washington:
$18,648
(% of AGI for various income ranges: 4.6% for AGIs below $25k, 3.7% for AGIs $25k-50k, 7.9% for AGIs $50k-75k, 3.2% for AGIs $100k-200k)
Total itemized deductions: $20,839 (26% of AGI, reported on 30.8% of returns)
Here:
$20,839
State:
$23,872
Here:
26.3% of AGI
State:
18.2% of AGI
(% of AGI for various income ranges: 14.7% for AGIs below $25k, 14.5% for AGIs $25k-50k, 11.2% for AGIs $50k-75k, 15.3% for AGIs $75k-100k, 11.6% for AGIs $100k-200k)
Charity contributions: $3,491 (reported on 24.2% of returns)
Here:
$3,491
State:
$4,465
(% of AGI for various income ranges: 1.3% for AGIs $25k-50k, 1.6% for AGIs $50k-75k, 2.9% for AGIs $75k-100k, 1.9% for AGIs $100k-200k)
Taxes paid: $5,096 (reported on 30.8% of returns)
99148:
$5,096
State:
$6,400
(% of AGI for various income ranges: 2.7% for AGIs below $25k, 2.9% for AGIs $25k-50k, 2.8% for AGIs $50k-75k, 3.8% for AGIs $75k-100k, 3.4% for AGIs $100k-200k)
Earned income credit: $1,900 (reported on 17.6% of returns)
Here:
$1,900
State:
$2,073
(% of AGI for various income ranges: 5.4% for AGIs below $25k, 0.8% for AGIs $25k-50k)
Percentage of individuals using paid preparers for their 2012 taxes: 45.1%
Here:
45%
State:
43%
(% for various income ranges: 36.1% for AGIs below $25k, 40.9% for AGIs $25k-50k, 53.3% for AGIs $50k-75k, 50.0% for AGIs $75k-100k, 70.0% for AGIs $100k-200k)
Averages for the 2004 tax year for zip code 99148, filed in 2005:
Average Adjusted Gross Income (AGI) in 2004: $37,034 (Individual Income Tax Returns)
Here:
$37,034
State:
$54,331
Salary/wage: $32,573 (reported on 75.3% of returns)
Here:
$32,573
State:
$45,761
(% of AGI for various income ranges: 81.1% for AGIs below $10k, 59.2% for AGIs $10k-25k, 66.6% for AGIs $25k-50k, 66.7% for AGIs $50k-75k, 65.5% for AGIs $75k-100k, 68.9% for AGIs over 100k)
Taxable interest for individuals: $1,650 (reported on 48.4% of returns)
This zip code:
$1,650
Washington:
$2,110
(% of AGI for various income ranges: 6.7% for AGIs below $10k, 4.4% for AGIs $10k-25k, 2.7% for AGIs $25k-50k, 1.4% for AGIs $50k-75k, 1.1% for AGIs $75k-100k, 1.0% for AGIs over 100k)
Taxable dividends: $2,023 (reported on 23.1% of returns)
Here:
$2,023
State:
$5,879
(% of AGI for various income ranges: 3.0% for AGIs below $10k, 1.2% for AGIs $10k-25k, 1.5% for AGIs $25k-50k, 0.9% for AGIs $50k-75k, 0.9% for AGIs $75k-100k, 1.6% for AGIs over 100k)
Net capital gain/loss: +$4,723 (reported on 23.6% of returns)
Here:
+$4,723
State:
+$15,835
(% of AGI for various income ranges: -2.5% for AGIs below $10k, 0.9% for AGIs $10k-25k, 3.2% for AGIs $25k-50k, 3.5% for AGIs $50k-75k, 1.8% for AGIs $75k-100k, 5.6% for AGIs over 100k)
Profit/loss from business: +$5,703 (reported on 17.4% of returns)
Here:
+$5,703
State:
+$13,994
(% of AGI for various income ranges: 9.9% for AGIs below $10k, 5.0% for AGIs $10k-25k, 3.4% for AGIs $25k-50k, 2.5% for AGIs $50k-75k, 1.5% for AGIs $75k-100k)
IRA payment deduction: $3,214 (reported on 2.9% of returns)
99148:
$3,214
Washington:
$3,001
Total itemized deductions: $16,949 (29% of AGI, reported on 29.1% of returns)
Here:
$16,949
State:
$19,669
Here:
28.6% of AGI
State:
20.7% of AGI
(% of AGI for various income ranges: 14.5% for AGIs $10k-25k, 12.6% for AGIs $25k-50k, 12.2% for AGIs $50k-75k, 16.5% for AGIs $75k-100k, 14.0% for AGIs over 100k)
Charity contributions deductions: $2,967 (5% of AGI, reported on 22.4% of returns)
Here:
$2,967
State:
$3,569
Here:
4.8% of AGI
State:
3.5% of AGI
(% of AGI for various income ranges: 1.1% for AGIs $10k-25k, 1.8% for AGIs $25k-50k, 1.5% for AGIs $50k-75k, 2.3% for AGIs $75k-100k, 2.5% for AGIs over 100k)
Total tax: $4,403 (reported on 73.8% of returns)
99148:
$4,403
State:
$9,065
(% of AGI for various income ranges: 2.9% for AGIs below $10k, 3.8% for AGIs $10k-25k, 6.0% for AGIs $25k-50k, 9.0% for AGIs $50k-75k, 10.9% for AGIs $75k-100k, 15.8% for AGIs over 100k)
Earned income credit: $1,613 (reported on 15.8% of returns)
Here:
$1,613
State:
$1,607
Percentage of individuals using paid preparers for their 2004 taxes: 51.3%
Here:
51%
State:
49%
(% for various income ranges: 44.6% for AGIs below $10k, 48.9% for AGIs $10k-25k, 55.8% for AGIs $25k-50k, 48.9% for AGIs $50k-75k, 56.2% for AGIs $75k-100k, 66.7% for AGIs over 100k)
Household received Food Stamps/SNAP in the past 12 months: 104 Household did not receive Food Stamps/SNAP in the past 12 months: 973
Women who had a birth in the past 12 months: 26 (10 now married, 14 unmarried) Women who did not have a birth in the past 12 months: 355 (199 now married, 155 unmarried)
Housing units in zip code 99148 with a mortgage: 591 (16 second mortgage, 12 both second mortgage and home equity loan) Houses without a mortgage: 41
Median monthly owner costs for units with a mortgage: $1,861 Median monthly owner costs for units without a mortgage: $501
Residents with income below the poverty level in 2022:
This zip code:
5.7%
Whole state:
10.0%
Residents with income below 50% of the poverty level in 2022:
This zip code:
3.5%
Whole state:
4.6%
Median number of rooms in houses and condos:
Here:
6.0
State:
6.5
Median number of rooms in apartments:
Here:
5.6
State:
3.9
Notable locations in this zip code not listed on our city pages
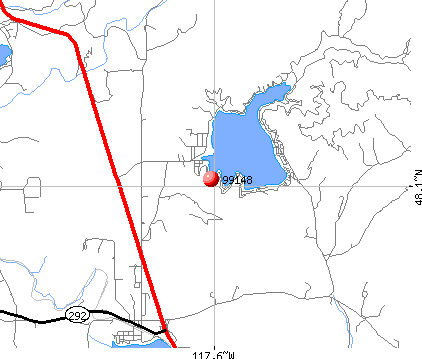
Notable locations in zip code 99148: Kaniksu Ranch (A), Loon Lake Sewer District 4 Sewage Treatment Plant (B), Stevens County Fire District 1 station 5 Deer Lake (C), Stevens County Fire District 1 station 2 Loon Lake (D). Display/hide their locations on the map
Churches in zip code 99148 include: Deer Park Mennonite Church (A), Lakeside Church of Nazarene (B), Loon Lake Assembly of God Church (C), Loon Lake Christian Fellowship Church (D), Springdale Community Church (E). Display/hide their locations on the map
Size of family households: 475 2-persons, 141 3-persons, 58 4-persons, 10 5-persons, 19 6-persons, 24 7-or-more-persons
Size of nonfamily households: 312 1-person, 38 2-persons
279 married couples with children.
19 single-parent households (14 men, 5 women).
98.3% of residents of 99148 zip code speak English at home.
1.3% of residents speak Spanish at home (30% very well, 57% well, 13% not well).
0.3% of residents speak other Indo-European language at home (100% very well).
Foreign born population: 15 (0.6%) (0.0% of them are naturalized citizens)
:
0.6%
Whole state:
15.3%
60%Taiwan
31%English
18%European
14%American
9%German
4%Norwegian
3%Irish
3%Danish
Year of entry for the foreign-born population
42010 or later
102000 to 2009
01990 to 1999
0Before 1990
Housing units lacking complete plumbing facilities: 7.2% Housing units lacking complete kitchen facilities: 4.5%
35.4%Electricity
28.6%Utility gas
26.4%Wood
7.5%Bottled, tank, or LP gas
1.7%Other fuel
Population in 1990: 1,885. Population change in the 1990s: +116 (+6.2%).
Place of birth for U.S.-born residents:
This state: 1,502
Northeast: 88
Midwest: 192
South: 98
West: 478
63% of the 99148 zip code residents lived in the same house 5 years ago. Out of people who lived in different houses, 26% lived in this county. Out of people who lived in different counties, 50% lived in Washington.
92% of the 99148 zip code residents lived in the same house 1 year ago. Out of people who lived in different houses, 17% moved from this county. Out of people who lived in different houses, 56% moved from different county within same state. Out of people who lived in different houses, 31% moved from different state. Out of people who lived in different houses, 5% moved from abroad.
Private vs. public school enrollment:
Students in private schools in grades 1 to 8 (elementary and middle school): 57
Here:
31.4%
Washington:
12.4%
Students in private schools in grades 9 to 12 (high school): 3
Here:
3.4%
Washington:
9.2%
Occupation by median earnings in the past 12 months ($)
163,816Fire fighting and prevention, and other protective service workers including supervisors
163,750Health diagnosing and treating practitioners and other technical occupations
117,725Installation, maintenance, and repair occupations
65,994Transportation occupations
57,891Business and financial operations occupations
51,164Production occupations
Companies with federal contracts located in this zip code:
J5 CONSTRUCTION INC (4045 MAPLE ST in LOON LAKE, WA; small business)
$5,678 with Air Force for Maintenance, Repair or Alteration of Real Property -- Other Airfield Structures. Signed on 2001-06-27. Completion date: 2001-08-06.
Top industries in this zip code by the number of employees in 2005:
Other Services (except Public Administration): Religious Organizations (10-19 employees: 1 establishment, 1-4 employees: 1 establishment)
Accommodation and Food Services: Full-Service Restaurants (5-9: 1, 1-4: 2)
Accommodation and Food Services: RV (Recreational Vehicle) Parks and Campgrounds (1-4: 4)
Mining: Construction Sand and Gravel Mining (5-9: 1)
Health Care and Social Assistance: All Other Outpatient Care Centers (5-9: 1)
Construction: New Single-Family Housing Construction (except Operative Builders) (1-4: 2)
Other Services (except Public Administration): General Automotive Repair (1-4: 2)
Accommodation and Food Services: Hotels (except Casino Hotels) and Motels (1-4: 2)
Fatal accident statistics in 2014:
Fatal accident count: 1
Vehicles involved in fatal accidents: 1
Fatal accidents caused by drunken drivers: 0
Fatalities: 1
Persons involved in fatal accidents: 1
Pedestrians involved in fatal accidents: 0
Fatal accident statistics in 2012:
Fatal accident count: 1
Vehicles involved in fatal accidents: 2
Fatal accidents caused by drunken drivers: 0
Fatalities: 1
Persons involved in fatal accidents: 2
Pedestrians involved in fatal accidents: 0
2002 - 2018 National Fire Incident Reporting System (NFIRS) incidents
Based on the data from the years 2002 - 2018 the average number of fires per year is 22. The highest number of reported fires - 54 took place in 2006, and the least - 7 in 2003. The data has a rising trend.
When looking into fire subcategories, the most reports belonged to: Outside Fires (46.3%), and Structure Fires (33.3%).
Fire incident types reported to NFIRS in Zip Code 99148


 Nearest zip codes: 99110, 99006, 99181, 99109, 99173, 99034.


 Based on the data from the years 2002 - 2018 the average number of fires per year is 22. The highest number of reported fires - 54 took place in 2006, and the least - 7 in 2003. The data has a rising trend.
 When looking into fire subcategories, the most reports belonged to: Outside Fires (46.3%), and Structure Fires (33.3%).