Estimated zip code population in 2022: 173 Zip code population in 2010: 340 Zip code population in 2000: 288
Houses and condos: 80 Renter-occupied apartments: 12
% of renters here:
22%
State:
36%
March 2022 cost of living index in zip code 99335: 86.3 (less than average, U.S. average is 100)
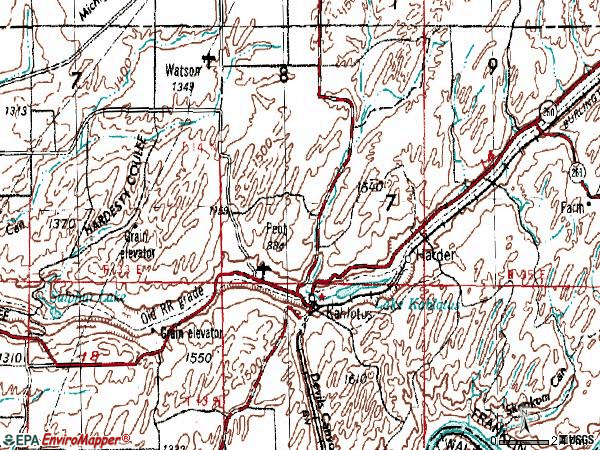
Land area: 169.3 sq. mi. Water area: 3.4 sq. mi.
Population density: 1 people per square mile
(very low).
OSM Map
General Map
Google Map
MSN Map
OSM Map
General Map
Google Map
MSN Map
OSM Map
General Map
Google Map
MSN Map
OSM Map
General Map
Google Map
MSN Map
Please wait while loading the map...
Real estate property taxes paid for housing units in 2022:
This zip code:
0.4% ($721)
Washington:
0.8% ($4,283)
Median real estate property taxes paid for housing units with mortgages in 2022: $969 (0.2%) Median real estate property taxes paid for housing units with no mortgage in 2022: $567 (0.2%)
Business Search- 14 Million verified businesses
Males: 93
(53.8%)
Females: 79
(46.2%)
For population 25 years and over in 99335:
High school or higher: 83.3%
Bachelor's degree or higher: 8.9%
Graduate or professional degree: 1.7%
Unemployed: 10.5%
Mean travel time to work (commute): 31.0 minutes
For population 15 years and over in 99335:
Never married: 26.0%
Now married: 64.4%
Separated: 1.4%
Widowed: 0.7%
Divorced: 7.5%
Zip code 99335 compared to state average:
Median household income below state average.
Median house value significantly below state average.
Unemployed percentage above state average.
Black race population percentage significantly below state average.
Median age above state average.
Foreign-born population percentage significantly below state average.
Renting percentage below state average.
Length of stay since moving in significantly above state average.
House age above state average.
Percentage of population with a bachelor's degree or higher significantly below state average.
Estimated median house/condo value in 2022: $184,179
99335:
$184,179
Washington:
$569,500
Median resident age:
This zip code:
44.8 years
Washington median age:
38.4 years
Average household size:
This zip code:
3.0 people
Washington:
2.5 people
Averages for the 2004 tax year for zip code 99335, filed in 2005:
Average Adjusted Gross Income (AGI) in 2004: $36,350 (Individual Income Tax Returns)
Here:
$36,350
State:
$54,331
Salary/wage: $34,398 (reported on 86.1% of returns)
Here:
$34,398
State:
$45,761
(% of AGI for various income ranges: 74.8% for AGIs below $10k, 86.0% for AGIs $10k-25k, 85.5% for AGIs $25k-50k, 73.2% for AGIs $50k-75k, 84.8% for AGIs $75k-100k)
Taxable interest for individuals: $232 (reported on 40.9% of returns)
This zip code:
$232
Washington:
$2,110
(% of AGI for various income ranges: 0.2% for AGIs $10k-25k, 0.3% for AGIs $25k-50k, 0.3% for AGIs $50k-75k, 0.2% for AGIs $75k-100k)
Taxable dividends: $333 (reported on 13.1% of returns)
Here:
$333
State:
$5,879
Profit/loss from business: +$1,727 (reported on 8.0% of returns)
Here:
+$1,727
State:
+$13,994
Total tax: $3,838 (reported on 76.6% of returns)
99335:
$3,838
State:
$9,065
(% of AGI for various income ranges: 3.6% for AGIs below $10k, 4.3% for AGIs $10k-25k, 5.9% for AGIs $25k-50k, 8.1% for AGIs $50k-75k, 11.9% for AGIs $75k-100k)
Earned income credit: $1,750 (reported on 14.6% of returns)
Here:
$1,750
State:
$1,607
Percentage of individuals using paid preparers for their 2004 taxes: 58.4%
Here:
58%
State:
49%
(% for various income ranges: 39.3% for AGIs below $10k, 57.6% for AGIs $10k-25k, 63.9% for AGIs $25k-50k, 66.7% for AGIs $50k-75k, 68.8% for AGIs $75k-100k)
Household received Food Stamps/SNAP in the past 12 months: 15 Household did not receive Food Stamps/SNAP in the past 12 months: 41
Women who had a birth in the past 12 months: 1 (2 now married, 0 unmarried) Women who did not have a birth in the past 12 months: 21 (12 now married, 9 unmarried)
Housing units in zip code 99335 with a mortgage: 19 Median monthly owner costs for units with a mortgage: $1,086 Median monthly owner costs for units without a mortgage: $390
Residents with income below the poverty level in 2022:
This zip code:
8.8%
Whole state:
10.0%
Residents with income below 50% of the poverty level in 2022:
This zip code:
4.9%
Whole state:
4.6%
Median number of rooms in houses and condos:
Here:
5.5
State:
6.5
Median number of rooms in apartments:
Here:
5.2
State:
3.9
Notable locations in this zip code not listed on our city pages
Notable locations in zip code 99335: Davin Ranch (A), H U Ranch (B), Harder Ranch (C), Howard Ranch (D), Nanamaker Farm (E), Franklin County Fire District 2 (F). Display/hide their locations on the map
Size of family households: 15 2-persons, 10 3-persons, 2 4-persons, 9 5-persons, 2 6-persons
Size of nonfamily households: 10 1-person, 6 2-persons
18 married couples with children.
0 single-parent households ().
86.8% of residents of 99335 zip code speak English at home.
10.2% of residents speak Spanish at home (47% very well, 29% well, 24% not well).
1.8% of residents speak other Indo-European language at home (100% very well).
Foreign born population: 7 (4.2%) (29.1% of them are naturalized citizens)
This zip code:
4.2%
Whole state:
15.3%
100%Honduras
29%Irish
13%German
9%American
9%Norwegian
7%Scottish
4%Italian
3%European
Year of entry for the foreign-born population
02010 or later
12000 to 2009
21990 to 1999
3Before 1990
Facilities with environmental interests located in this zip code:
CONNELL SAND AND GRAVEL-ROSS P (PO BOX 498 in KAHLOTUS, WA)
National Pollutant Discharge Elimination System NON-MAJOR (Tracking pollutant discharge elimination systems) - permit Business SIC classification: CONSTRUCTION SAND AND GRAVEL Organizations: CONNELL SAND AND GRAVEL INC (CONTACT/OPERATOR)
Alternative names: CONNELL SAND & GRAVEL
Housing units lacking complete plumbing facilities: 7.5% Housing units lacking complete kitchen facilities: 6.4%
81.2%Electricity
16.6%Wood
1.8%Bottled, tank, or LP gas
1.8%Fuel oil, kerosene, etc.
Place of birth for U.S.-born residents:
This state: 110
Midwest: 15
South: 4
West: 32
58% of the 99335 zip code residents lived in the same house 5 years ago. Out of people who lived in different houses, 37% lived in this county. Out of people who lived in different counties, 50% lived in Washington.
102% of the 99335 zip code residents lived in the same house 1 year ago.
Private vs. public school enrollment:
Students in private schools in grades 1 to 8 (elementary and middle school):
Here:
0.0%
Washington:
12.4%
Students in private schools in grades 9 to 12 (high school):
Here:
0.0%
Washington:
9.2%
Students in private undergraduate colleges:
Here:
0.0%
Washington:
16.5%
Occupation by median earnings in the past 12 months ($)
75,187Transportation occupations
55,339Construction and extraction occupations
3,728Office and administrative support occupations
Top industries in this zip code by the number of employees in 2005:
Finance and Insurance: Commercial Banking (10-19 employees: 1 establishment)
Wholesale Trade: Grain and Field Bean Merchant Wholesalers (1-4: 1)
Home Mortgage Disclosure Act Aggregated Statistics For Year 2009 (Based on 2 partial tracts)
A) FHA, FSA/RHS & VA Home Purchase Loans
B) Conventional Home Purchase Loans
C) Refinancings
D) Home Improvement Loans
F) Non-occupant Loans on < 5 Family Dwellings (A B C & D)
G) Loans On Manufactured Home Dwelling (A B C & D)
Number
Average Value
Number
Average Value
Number
Average Value
Number
Average Value
Number
Average Value
Number
Average Value
LOANS ORIGINATED
11
$169,982
3
$192,980
8
$186,271
0
$0
0
$0
1
$202,440
APPLICATIONS APPROVED, NOT ACCEPTED
0
$0
0
$0
0
$0
0
$0
0
$0
0
$0
APPLICATIONS DENIED
0
$0
1
$156,380
7
$194,407
2
$54,250
1
$46,060
1
$145,450
APPLICATIONS WITHDRAWN
1
$209,980
1
$50,740
3
$204,083
1
$16,130
0
$0
0
$0
FILES CLOSED FOR INCOMPLETENESS
0
$0
0
$0
3
$138,773
1
$11,710
0
$0
0
$0
Aggregated Statistics For Year 2008 (Based on 2 partial tracts)
A) FHA, FSA/RHS & VA Home Purchase Loans
B) Conventional Home Purchase Loans
C) Refinancings
D) Home Improvement Loans
F) Non-occupant Loans on < 5 Family Dwellings (A B C & D)
G) Loans On Manufactured Home Dwelling (A B C & D)
Number
Average Value
Number
Average Value
Number
Average Value
Number
Average Value
Number
Average Value
Number
Average Value
LOANS ORIGINATED
9
$156,843
10
$165,175
5
$210,762
2
$47,355
1
$163,150
2
$164,705
APPLICATIONS APPROVED, NOT ACCEPTED
1
$118,650
1
$120,730
1
$116,050
0
$0
0
$0
1
$77,020
APPLICATIONS DENIED
1
$43,450
2
$133,220
5
$163,302
2
$22,765
0
$0
2
$54,380
APPLICATIONS WITHDRAWN
1
$133,220
3
$118,477
3
$150,570
1
$19,520
0
$0
0
$0
FILES CLOSED FOR INCOMPLETENESS
0
$0
1
$181,100
1
$127,240
0
$0
0
$0
0
$0
Aggregated Statistics For Year 2007 (Based on 2 partial tracts)
A) FHA, FSA/RHS & VA Home Purchase Loans
B) Conventional Home Purchase Loans
C) Refinancings
D) Home Improvement Loans
F) Non-occupant Loans on < 5 Family Dwellings (A B C & D)
G) Loans On Manufactured Home Dwelling (A B C & D)
Number
Average Value
Number
Average Value
Number
Average Value
Number
Average Value
Number
Average Value
Number
Average Value
LOANS ORIGINATED
2
$162,625
10
$186,772
6
$403,917
2
$171,730
1
$134,520
4
$587,272
APPLICATIONS APPROVED, NOT ACCEPTED
0
$0
1
$140,510
1
$199,050
1
$36,430
0
$0
1
$99,140
APPLICATIONS DENIED
1
$113,450
2
$151,175
4
$154,625
0
$0
0
$0
2
$126,715
APPLICATIONS WITHDRAWN
1
$149,880
2
$676,910
3
$244,413
1
$26,540
0
$0
1
$162,890
FILES CLOSED FOR INCOMPLETENESS
0
$0
1
$85,610
1
$129,580
0
$0
0
$0
0
$0
Aggregated Statistics For Year 2006 (Based on 2 partial tracts)
A) FHA, FSA/RHS & VA Home Purchase Loans
B) Conventional Home Purchase Loans
C) Refinancings
D) Home Improvement Loans
F) Non-occupant Loans on < 5 Family Dwellings (A B C & D)
G) Loans On Manufactured Home Dwelling (A B C & D)
Number
Average Value
Number
Average Value
Number
Average Value
Number
Average Value
Number
Average Value
Number
Average Value
LOANS ORIGINATED
2
$169,000
18
$98,659
5
$96,794
3
$29,317
4
$86,582
3
$73,637
APPLICATIONS APPROVED, NOT ACCEPTED
0
$0
2
$99,655
1
$164,190
1
$23,680
0
$0
0
$0
APPLICATIONS DENIED
0
$0
4
$101,088
6
$120,777
3
$30,963
1
$116,570
1
$116,310
APPLICATIONS WITHDRAWN
1
$101,480
4
$114,162
3
$176,763
0
$0
2
$123,465
0
$0
FILES CLOSED FOR INCOMPLETENESS
0
$0
0
$0
1
$111,890
0
$0
0
$0
0
$0
Aggregated Statistics For Year 2005 (Based on 2 partial tracts)
A) FHA, FSA/RHS & VA Home Purchase Loans
B) Conventional Home Purchase Loans
C) Refinancings
D) Home Improvement Loans
F) Non-occupant Loans on < 5 Family Dwellings (A B C & D)
G) Loans On Manufactured Home Dwelling (A B C & D)
Number
Average Value
Number
Average Value
Number
Average Value
Number
Average Value
Number
Average Value
Number
Average Value
LOANS ORIGINATED
3
$138,513
31
$87,108
6
$221,733
0
$0
6
$176,545
4
$118,455
APPLICATIONS APPROVED, NOT ACCEPTED
1
$55,420
5
$107,514
2
$60,105
0
$0
1
$59,850
1
$128,800
APPLICATIONS DENIED
1
$98,100
5
$103,664
5
$155,288
1
$31,480
0
$0
2
$77,020
APPLICATIONS WITHDRAWN
1
$56,980
4
$103,755
2
$223,510
1
$22,120
1
$153,000
1
$109,020
FILES CLOSED FOR INCOMPLETENESS
0
$0
2
$95,365
2
$144,540
0
$0
1
$107,720
1
$62,710
Aggregated Statistics For Year 2004 (Based on 2 partial tracts)
A) FHA, FSA/RHS & VA Home Purchase Loans
B) Conventional Home Purchase Loans
C) Refinancings
D) Home Improvement Loans
F) Non-occupant Loans on < 5 Family Dwellings (A B C & D)
G) Loans On Manufactured Home Dwelling (A B C & D)
Number
Average Value
Number
Average Value
Number
Average Value
Number
Average Value
Number
Average Value
Number
Average Value
LOANS ORIGINATED
2
$111,625
19
$82,812
4
$274,445
0
$0
5
$66,716
2
$83,655
APPLICATIONS APPROVED, NOT ACCEPTED
1
$88,730
4
$146,558
1
$264,100
0
$0
1
$71,290
1
$13,790
APPLICATIONS DENIED
1
$63,750
4
$79,165
3
$115,443
1
$13,530
2
$53,860
1
$95,750
APPLICATIONS WITHDRAWN
0
$0
2
$147,275
3
$91,243
0
$0
1
$118,130
1
$173,030
FILES CLOSED FOR INCOMPLETENESS
0
$0
1
$74,160
1
$167,050
0
$0
0
$0
1
$62,450
Aggregated Statistics For Year 2003 (Based on 2 partial tracts)
A) FHA, FSA/RHS & VA Home Purchase Loans
B) Conventional Home Purchase Loans
C) Refinancings
D) Home Improvement Loans
F) Non-occupant Loans on < 5 Family Dwellings (A B C & D)
Number
Average Value
Number
Average Value
Number
Average Value
Number
Average Value
Number
Average Value
LOANS ORIGINATED
7
$126,940
19
$138,796
11
$123,595
2
$27,710
1
$81,440
APPLICATIONS APPROVED, NOT ACCEPTED
0
$0
2
$96,275
2
$135,435
0
$0
0
$0
APPLICATIONS DENIED
1
$106,420
3
$103,733
8
$153,518
1
$15,870
0
$0
APPLICATIONS WITHDRAWN
1
$117,610
3
$105,900
3
$139,293
0
$0
1
$115,530
FILES CLOSED FOR INCOMPLETENESS
0
$0
0
$0
0
$0
0
$0
0
$0
Aggregated Statistics For Year 2002 (Based on 2 partial tracts)
A) FHA, FSA/RHS & VA Home Purchase Loans
B) Conventional Home Purchase Loans
C) Refinancings
D) Home Improvement Loans
F) Non-occupant Loans on < 5 Family Dwellings (A B C & D)
Number
Average Value
Number
Average Value
Number
Average Value
Number
Average Value
Number
Average Value
LOANS ORIGINATED
12
$114,662
18
$108,287
7
$141,771
1
$58,540
2
$82,485
APPLICATIONS APPROVED, NOT ACCEPTED
1
$90,810
1
$125,420
1
$138,950
0
$0
0
$0
APPLICATIONS DENIED
1
$73,640
3
$56,983
5
$154,038
0
$0
1
$36,690
APPLICATIONS WITHDRAWN
0
$0
1
$76,240
2
$105,510
0
$0
0
$0
FILES CLOSED FOR INCOMPLETENESS
0
$0
1
$48,140
1
$46,060
0
$0
0
$0
Aggregated Statistics For Year 2001 (Based on 2 partial tracts)
A) FHA, FSA/RHS & VA Home Purchase Loans
B) Conventional Home Purchase Loans
C) Refinancings
F) Non-occupant Loans on < 5 Family Dwellings (A B C & D)
Number
Average Value
Number
Average Value
Number
Average Value
Number
Average Value
LOANS ORIGINATED
4
$113,838
6
$102,822
6
$118,043
1
$44,490
APPLICATIONS APPROVED, NOT ACCEPTED
1
$94,970
1
$163,410
2
$82,615
0
$0
APPLICATIONS DENIED
1
$53,860
2
$71,685
4
$77,085
1
$85,870
APPLICATIONS WITHDRAWN
0
$0
1
$9,630
2
$64,920
0
$0
FILES CLOSED FOR INCOMPLETENESS
0
$0
0
$0
0
$0
0
$0
Aggregated Statistics For Year 2000 (Based on 2 partial tracts)
A) FHA, FSA/RHS & VA Home Purchase Loans
B) Conventional Home Purchase Loans
C) Refinancings
D) Home Improvement Loans
F) Non-occupant Loans on < 5 Family Dwellings (A B C & D)
Number
Average Value
Number
Average Value
Number
Average Value
Number
Average Value
Number
Average Value
LOANS ORIGINATED
1
$86,910
5
$99,760
2
$85,605
1
$16,130
1
$50,480
APPLICATIONS APPROVED, NOT ACCEPTED
0
$0
2
$87,035
3
$87,600
0
$0
1
$37,210
APPLICATIONS DENIED
1
$90,030
4
$77,540
4
$90,355
1
$29,400
0
$0
APPLICATIONS WITHDRAWN
0
$0
1
$244,850
3
$81,183
1
$18,210
0
$0
FILES CLOSED FOR INCOMPLETENESS
0
$0
0
$0
1
$94,190
0
$0
0
$0
Aggregated Statistics For Year 1999 (Based on 1 partial tract)

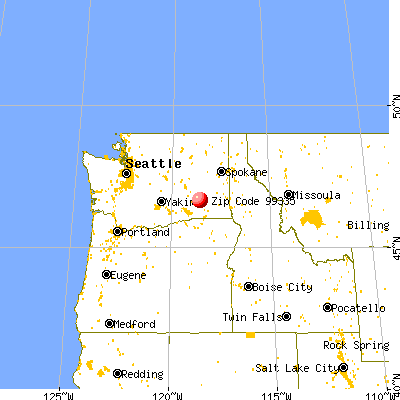


 Nearest zip codes: 99371, 99348, 99333, 99341, 99359, 99326.