Estimated zip code population in 2022: 38,077 Zip code population in 2010: 35,857 Zip code population in 2000: 33,897
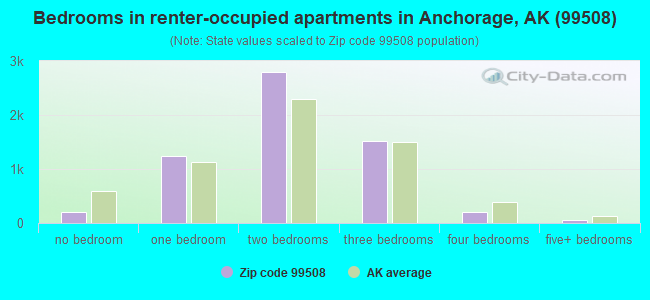
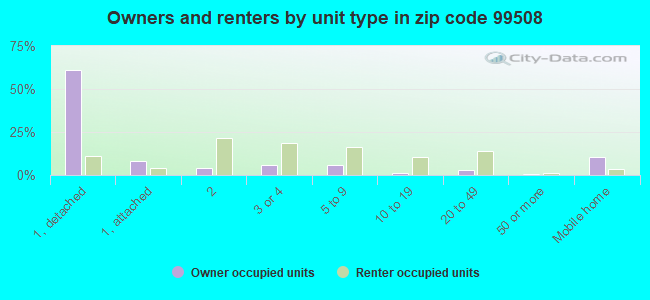
Houses and condos: 14,368 Renter-occupied apartments: 6,135
% of renters here:
46%
State:
34%
March 2022 cost of living index in zip code 99508: 102.9 (near average, U.S. average is 100)
Land area: 6.9 sq. mi. Water area: 0.1 sq. mi.
Population density: 5,487 people per square mile
(average).
OSM Map
General Map
Google Map
MSN Map
OSM Map
General Map
Google Map
MSN Map
OSM Map
General Map
Google Map
MSN Map
OSM Map
General Map
Google Map
MSN Map
Please wait while loading the map...
Real estate property taxes paid for housing units in 2022:
This zip code:
1.3% ($4,151)
Alaska:
1.1% ($3,650)
Median real estate property taxes paid for housing units with mortgages in 2022: $4,519 (1.3%) Median real estate property taxes paid for housing units with no mortgage in 2022: $2,862 (1.1%)
Averages for the 2020 tax year for zip code 99508, filed in 2021:
Average Adjusted Gross Income (AGI) in 2020: $57,675 (Individual Income Tax Returns)
Here:
$57,675
State:
$75,656
Salary/wage: $48,240 (reported on 83.9% of returns)
Here:
$48,240
State:
$62,417
(% of AGI for various income ranges: 1104.4% for AGIs below $25k, 3599.0% for AGIs $25k-50k, 6444.0% for AGIs $50k-75k, 9499.4% for AGIs $75k-100k, 16984.6% for AGIs $100k-200k, 59011.9% for AGIs over 200k)
Taxable interest for individuals: $1,826 (reported on 19.6% of returns)
This zip code:
$1,826
Alaska:
$1,789
(% of AGI for various income ranges: 5.2% for AGIs below $25k, 9.7% for AGIs $25k-50k, 19.9% for AGIs $50k-75k, 47.5% for AGIs $75k-100k, 160.4% for AGIs $100k-200k, 1717.5% for AGIs over 200k)
Ordinary dividends: $8,381 (reported on 17.1% of returns)
Here:
$8,381
State:
$5,446
(% of AGI for various income ranges: 19.9% for AGIs below $25k, 19.9% for AGIs $25k-50k, 46.9% for AGIs $50k-75k, 154.5% for AGIs $75k-100k, 459.7% for AGIs $100k-200k, 9002.5% for AGIs over 200k)
Net capital gain/loss in AGI: +$16,964 (reported on 12.9% of returns)
Here:
+$16,964
State:
+$17,390
(% of AGI for various income ranges: 11.9% for AGIs below $25k, 12.4% for AGIs $25k-50k, 65.2% for AGIs $50k-75k, 103.1% for AGIs $75k-100k, 616.7% for AGIs $100k-200k, 15895.6% for AGIs over 200k)
Profit/loss from business: +$15,381 (reported on 12.2% of returns)
Here:
+$15,381
State:
+$14,751
(% of AGI for various income ranges: 55.6% for AGIs below $25k, 85.4% for AGIs $25k-50k, 166.9% for AGIs $50k-75k, 348.6% for AGIs $75k-100k, 849.7% for AGIs $100k-200k, 6101.2% for AGIs over 200k)
Taxable individual retirement arrangement distribution: $23,499 (reported on 5.2% of returns)
99508:
$23,499
Alaska:
$26,310
(% of AGI for various income ranges: 13.9% for AGIs below $25k, 32.3% for AGIs $25k-50k, 100.3% for AGIs $50k-75k, 253.2% for AGIs $75k-100k, 767.4% for AGIs $100k-200k, 3921.2% for AGIs over 200k)
Self-employed (Keogh) retirement plans: $23,856 (reported on 0.6% of returns)
99508:
$23,856
Alaska:
$23,465
(% of AGI for various income ranges: 5.5% for AGIs $25k-50k, 76.3% for AGIs $100k-200k, 755.6% for AGIs over 200k)
Total itemized deductions: $29,217 (reported on 4.5% of returns)
Here:
$29,217
State:
$32,074
(% of AGI for various income ranges: 16.8% for AGIs below $25k, 48.7% for AGIs $25k-50k, 164.7% for AGIs $50k-75k, 338.2% for AGIs $75k-100k, 638.3% for AGIs $100k-200k, 3980.6% for AGIs over 200k)
Charity contributions: $10,945 (reported on 3.4% of returns)
Here:
$10,945
State:
$13,240
(% of AGI for various income ranges: 8.1% for AGIs $25k-50k, 23.8% for AGIs $50k-75k, 49.9% for AGIs $75k-100k, 222.6% for AGIs $100k-200k, 1582.5% for AGIs over 200k)
Taxes paid: $5,543 (reported on 4.3% of returns)
99508:
$5,543
State:
$6,075
(% of AGI for various income ranges: 2.6% for AGIs below $25k, 8.3% for AGIs $25k-50k, 27.8% for AGIs $50k-75k, 65.7% for AGIs $75k-100k, 122.5% for AGIs $100k-200k, 676.2% for AGIs over 200k)
Earned income credit: $2,209 (reported on 19.5% of returns)
Here:
$2,209
State:
$2,017
(% of AGI for various income ranges: 96.2% for AGIs below $25k, 75.2% for AGIs $25k-50k, 1.2% for AGIs $50k-75k)
Percentage of individuals using paid preparers for their 2020 taxes: 92.2%
Here:
92%
State:
92%
(% for various income ranges: 91.8% for AGIs below $25k, 93.9% for AGIs $25k-50k, 91.9% for AGIs $50k-75k, 92.7% for AGIs $75k-100k, 89.5% for AGIs $100k-200k, 90.0% for AGIs over 200k)
Averages for the 2012 tax year for zip code 99508, filed in 2013:
Average Adjusted Gross Income (AGI) in 2012: $49,900 (Individual Income Tax Returns)
Here:
$49,900
State:
$63,695
Salary/wage: $41,044 (reported on 87.1% of returns)
Here:
$41,044
State:
$52,620
(% of AGI for various income ranges: 79.2% for AGIs below $25k, 85.5% for AGIs $25k-50k, 80.7% for AGIs $50k-75k, 75.6% for AGIs $75k-100k, 71.1% for AGIs $100k-200k, 45.1% for AGIs over 200k)
Taxable interest for individuals: $1,781 (reported on 23.1% of returns)
This zip code:
$1,781
Alaska:
$1,478
(% of AGI for various income ranges: 0.3% for AGIs below $25k, 0.3% for AGIs $25k-50k, 0.6% for AGIs $50k-75k, 0.4% for AGIs $75k-100k, 0.9% for AGIs $100k-200k, 1.9% for AGIs over 200k)
Ordinary dividends: $6,553 (reported on 19.2% of returns)
Here:
$6,553
State:
$4,666
(% of AGI for various income ranges: 3.7% for AGIs below $25k, 1.2% for AGIs $25k-50k, 1.4% for AGIs $50k-75k, 1.2% for AGIs $75k-100k, 2.0% for AGIs $100k-200k, 5.4% for AGIs over 200k)
Net capital gain/loss in AGI: +$7,994 (reported on 10.6% of returns)
Here:
+$7,994
State:
+$12,441
(% of AGI for various income ranges: 0.3% for AGIs below $25k, 0.2% for AGIs $25k-50k, 0.4% for AGIs $50k-75k, 0.6% for AGIs $75k-100k, 1.5% for AGIs $100k-200k, 5.7% for AGIs over 200k)
Profit/loss from business: +$18,914 (reported on 10.4% of returns)
Here:
+$18,914
State:
+$17,607
(% of AGI for various income ranges: 3.8% for AGIs below $25k, 2.0% for AGIs $25k-50k, 2.0% for AGIs $50k-75k, 2.4% for AGIs $75k-100k, 3.7% for AGIs $100k-200k, 8.6% for AGIs over 200k)
Taxable individual retirement arrangement distribution: $19,732 (reported on 5.4% of returns)
99508:
$19,732
Alaska:
$19,871
(% of AGI for various income ranges: 0.8% for AGIs below $25k, 0.8% for AGIs $25k-50k, 1.4% for AGIs $50k-75k, 2.0% for AGIs $75k-100k, 3.0% for AGIs $100k-200k, 3.9% for AGIs over 200k)
Self-employment retirement plans: $19,792 (reported on 0.8% of returns)
99508:
$19,792
Alaska:
$20,625
(% of AGI for various income ranges: 0.1% for AGIs $25k-50k, 0.4% for AGIs $100k-200k, 1.0% for AGIs over 200k)
Total itemized deductions: $19,097 (16% of AGI, reported on 18.6% of returns)
Here:
$19,097
State:
$20,513
Here:
16.4% of AGI
State:
15.5% of AGI
(% of AGI for various income ranges: 3.5% for AGIs below $25k, 5.3% for AGIs $25k-50k, 7.7% for AGIs $50k-75k, 8.5% for AGIs $75k-100k, 9.1% for AGIs $100k-200k, 7.4% for AGIs over 200k)
Charity contributions: $4,743 (reported on 13.7% of returns)
Here:
$4,743
State:
$4,894
(% of AGI for various income ranges: 0.3% for AGIs below $25k, 0.6% for AGIs $25k-50k, 1.1% for AGIs $50k-75k, 1.5% for AGIs $75k-100k, 1.8% for AGIs $100k-200k, 2.1% for AGIs over 200k)
Taxes paid: $4,268 (reported on 17.8% of returns)
99508:
$4,268
State:
$4,526
(% of AGI for various income ranges: 0.6% for AGIs below $25k, 1.0% for AGIs $25k-50k, 1.6% for AGIs $50k-75k, 1.8% for AGIs $75k-100k, 2.1% for AGIs $100k-200k, 1.8% for AGIs over 200k)
Earned income credit: $2,328 (reported on 22.4% of returns)
Here:
$2,328
State:
$1,975
(% of AGI for various income ranges: 7.4% for AGIs below $25k, 1.3% for AGIs $25k-50k)
Percentage of individuals using paid preparers for their 2012 taxes: 42.1%
Here:
42%
State:
43%
(% for various income ranges: 39.4% for AGIs below $25k, 40.9% for AGIs $25k-50k, 41.7% for AGIs $50k-75k, 47.9% for AGIs $75k-100k, 47.4% for AGIs $100k-200k, 72.5% for AGIs over 200k)
Averages for the 2004 tax year for zip code 99508, filed in 2005:
Average Adjusted Gross Income (AGI) in 2004: $40,680 (Individual Income Tax Returns)
Here:
$40,680
State:
$45,527
Salary/wage: $34,799 (reported on 81.5% of returns)
Here:
$34,799
State:
$41,300
(% of AGI for various income ranges: 95.5% for AGIs below $10k, 83.7% for AGIs $10k-25k, 84.7% for AGIs $25k-50k, 76.6% for AGIs $50k-75k, 73.6% for AGIs $75k-100k, 49.8% for AGIs over 100k)
Taxable interest for individuals: $1,433 (reported on 36.4% of returns)
This zip code:
$1,433
Alaska:
$1,233
(% of AGI for various income ranges: 2.6% for AGIs below $10k, 0.7% for AGIs $10k-25k, 0.7% for AGIs $25k-50k, 1.0% for AGIs $50k-75k, 1.3% for AGIs $75k-100k, 1.9% for AGIs over 100k)
Taxable dividends: $5,589 (reported on 20.9% of returns)
Here:
$5,589
State:
$2,694
(% of AGI for various income ranges: 2.9% for AGIs below $10k, 1.3% for AGIs $10k-25k, 1.1% for AGIs $25k-50k, 1.4% for AGIs $50k-75k, 1.4% for AGIs $75k-100k, 5.8% for AGIs over 100k)
Net capital gain/loss: +$10,492 (reported on 13.8% of returns)
Here:
+$10,492
State:
+$10,140
(% of AGI for various income ranges: -1.3% for AGIs below $10k, 0.2% for AGIs $10k-25k, 0.3% for AGIs $25k-50k, 0.7% for AGIs $50k-75k, 1.6% for AGIs $75k-100k, 9.0% for AGIs over 100k)
Profit/loss from business: +$18,814 (reported on 11.2% of returns)
Here:
+$18,814
State:
+$12,808
(% of AGI for various income ranges: 3.9% for AGIs below $10k, 3.0% for AGIs $10k-25k, 2.0% for AGIs $25k-50k, 3.7% for AGIs $50k-75k, 3.7% for AGIs $75k-100k, 9.1% for AGIs over 100k)
IRA payment deduction: $2,791 (reported on 1.8% of returns)
99508:
$2,791
Alaska:
$2,963
(% of AGI for various income ranges: 0.1% for AGIs $10k-25k, 0.1% for AGIs $25k-50k, 0.2% for AGIs $50k-75k, 0.1% for AGIs $75k-100k, 0.1% for AGIs over 100k)
Self-employed pension: $14,282 (reported on 1.2% of returns)
Here:
$14,282
Alaska:
$13,983
(% of AGI for various income ranges: 0.1% for AGIs $25k-50k, 0.2% for AGIs $50k-75k, 0.3% for AGIs $75k-100k, 0.9% for AGIs over 100k)
Total itemized deductions: $15,619 (19% of AGI, reported on 20.6% of returns)
Here:
$15,619
State:
$16,716
Here:
18.5% of AGI
State:
18.3% of AGI
(% of AGI for various income ranges: 9.0% for AGIs below $10k, 3.8% for AGIs $10k-25k, 7.0% for AGIs $25k-50k, 9.7% for AGIs $50k-75k, 11.2% for AGIs $75k-100k, 7.5% for AGIs over 100k)
Charity contributions deductions: $3,916 (4% of AGI, reported on 17.1% of returns)
Here:
$3,916
State:
$3,652
Here:
4.4% of AGI
State:
3.8% of AGI
(% of AGI for various income ranges: 0.5% for AGIs below $10k, 0.5% for AGIs $10k-25k, 1.0% for AGIs $25k-50k, 1.8% for AGIs $50k-75k, 2.2% for AGIs $75k-100k, 2.1% for AGIs over 100k)
Total tax: $6,833 (reported on 76.6% of returns)
99508:
$6,833
State:
$7,049
(% of AGI for various income ranges: 2.3% for AGIs below $10k, 4.1% for AGIs $10k-25k, 7.5% for AGIs $25k-50k, 10.1% for AGIs $50k-75k, 11.9% for AGIs $75k-100k, 21.1% for AGIs over 100k)
Earned income credit: $1,607 (reported on 16.8% of returns)
Here:
$1,607
State:
$1,505
Percentage of individuals using paid preparers for their 2004 taxes: 52.0%
Here:
52%
State:
49%
(% for various income ranges: 45.1% for AGIs below $10k, 56.9% for AGIs $10k-25k, 50.9% for AGIs $25k-50k, 53.9% for AGIs $50k-75k, 50.2% for AGIs $75k-100k, 63.6% for AGIs over 100k)
Likely homosexual households (counted as self-reported same-sex unmarried-partner households)
Lesbian couples: 0.0% of all households
Gay men: 0.3% of all households
Household received Food Stamps/SNAP in the past 12 months: 2,626 Household did not receive Food Stamps/SNAP in the past 12 months: 10,699
Women who had a birth in the past 12 months: 791 (574 now married, 210 unmarried) Women who did not have a birth in the past 12 months: 9,004 (2,894 now married, 6,224 unmarried)
Housing units in zip code 99508 with a mortgage: 4,627 (166 second mortgage, 30 home equity loan, 103 both second mortgage and home equity loan) Houses without a mortgage: 17
Median monthly owner costs for units with a mortgage: $2,062 Median monthly owner costs for units without a mortgage: $731
Residents with income below the poverty level in 2022:
This zip code:
20.7%
Whole state:
11.0%
Residents with income below 50% of the poverty level in 2022:
This zip code:
12.4%
Whole state:
5.6%
Median number of rooms in houses and condos:
Here:
5.5
State:
5.6
Median number of rooms in apartments:
Here:
4.0
State:
3.9
Notable locations in this zip code not listed on our city pages
Notable locations in zip code 99508: Providence Family Medicine Center (A), Alaska Spine Institute (B), Alaska Native Tribal Health Consortium Community Health Service (C), Southcentral Foundation Alaska Native Primary Care Center (D), Alaska Center For Pediatrics (E), Alaska Surgery Center (F), Providence Sports Medicine and Rehabilitation Services (G), Northwest Medical Center (H), Medical Park Family Care (I), Ravenwood Family Clinic (J), McLaughlin Youth Center (K), Sutton's Greenhouse (L), Anchorage Fire Department Battalion 3 East Side Station 4 (M). Display/hide their locations on the map
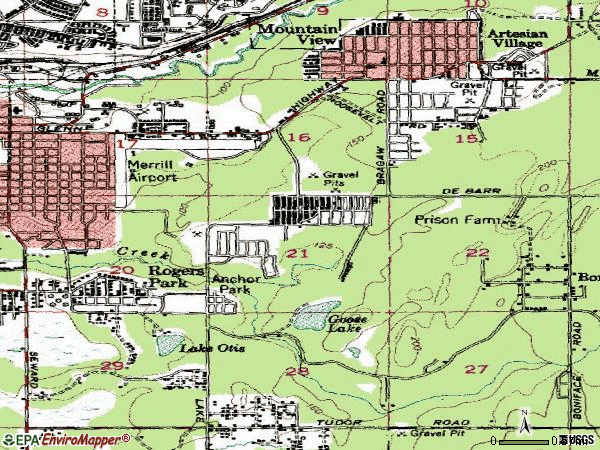
Parks in zip code 99508 include: Anchor Park (1), Nichols Park (2), Goose Lake Park (3), Carlson Park (4), David Green Park (5), University Park (6), East Chester/Woodside Park (7), Tkishla Park (8), Lake Otis Park (9). Display/hide their locations on the map
4,002 married couples with children.
5,333 single-parent households (1,110 men, 4,223 women).
71.2% of residents of 99508 zip code speak English at home.
7.0% of residents speak Spanish at home (60% very well, 22% well, 14% not well, 5% not at all).
2.4% of residents speak other Indo-European language at home (78% very well, 9% well, 13% not well).
18.0% of residents speak Asian or Pacific Island language at home (71% very well, 19% well, 8% not well, 2% not at all).
2.0% of residents speak other language at home (67% very well, 26% well, 7% not well).
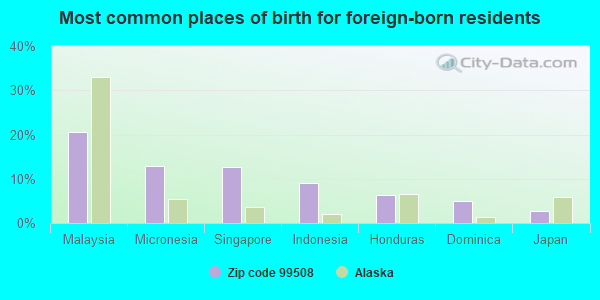
Foreign born population: 5,793 (15.2%) (63.5% of them are naturalized citizens)
Major facilities with environmental interests located in this zip code:
ALYESKA INFORMATION SERVICES (900 EAST BENSON BOULEVARD in ANCHORAGE, AK)
ENFORCEMENT/COMPLIANCE ACTIVITY (Integrated Compliance Information System) - ICIS-10-1999-0140, FORMAL ENFORCEMENT ACTION (Integrated Compliance Information System) - ICIS-10-1999-0140, FORMAL ENFORCEMENT ACTION (Integrated Compliance Information System) - ICIS-10-1996-0050, FORMAL ENFORCEMENT ACTION COMPLIANCE ACTIVITY (Tracking inspections of insecticide, fungicide, and rodenticide, and toxic substances) (Resource Conservation and Recovery Act (tracking hazardous waste)) Business SIC classification: CRUDE PETROLEUM AND NATURAL GAS; CRUDE PETROLEUM PIPELINES Organizations: SEE COMMENTS (CONTACT/OWNER)
Alternative names: B P EXPLORATION ALASKA INC, BP EXPL ALASKA, BP EXPL ALASKA ENDICOTT
HOME DEPOT USA INC HD 1302 (400 RODEO PLACE in ANCHORAGE, AK)
Conditionally Exempt Small Quantity Generators, less than 100 kg/month of hazardous waste (Resource Conservation and Recovery Act (tracking hazardous waste)) - notification - ICIS-, ENFORCEMENT/COMPLIANCE ACTIVITY Organizations: PENSKE AUTO CENTER INC (CONTACT/OWNER)
Alternative names: PENSKE AUTO CENTER RODEO PL
KING CAREER CENTER (2650 E NORTHERN LIGHTS BLVD. in ANCHORAGE, AK)
COMPLIANCE ACTIVITY (Tracking inspections of insecticide, fungicide, and rodenticide, and toxic substances) (National Center for Education Statistics) - STATE ID-57110 Organizations: ANCHORAGE SCHOOL DISTRICT (SCHOOL DISTRICT)
Alternative names: ANCHORAGE SCHOOL DIST KING CAREER CENTER, ALTERNATIVE CAREER EDUCATION, ANCHORAGE SCHOOL DIST KING CAREER CENTER
AIRPORT HEIGHTS SCHOOL - ANCHORAGE A-8 NW (1510 ALDER DRIVE in ANCHORAGE, AK)
(Geographic Names Information System) (National Center for Education Statistics) - STATE ID-50020 Organizations: ANCHORAGE SCHOOL DISTRICT (SCHOOL DISTRICT)
Alternative names: AIRPORT HEIGHTS ELEMENTARY
MOUNTAIN VIEW ELEMENTARY (4005 MCPHEE AVENUE in ANCHORAGE, AK)
ENFORCEMENT/COMPLIANCE ACTIVITY (Integrated Compliance Information System) (National Center for Education Statistics) - STATE ID-50480 Organizations: ANCHORAGE SCHOOL DISTRICT (SCHOOL DISTRICT)
EAST HIGH SCHOOL (4025 E. NORTHERN LIGHTS BLVD in ANCHORAGE, AK)
(Geographic Names Information System) (National Center for Education Statistics) - STATE ID-50220 Organizations: ANCHORAGE SCHOOL DISTRICT (SCHOOL DISTRICT)
CHARTER NORTH HOSPITAL (2530 DEBARR ROAD in ANCHORAGE, AK)
(National Center for Education Statistics) - STATE ID-57120 Organizations: ANCHORAGE SCHOOL DISTRICT (SCHOOL DISTRICT)
ALASKA SCHOOL FOR THE DEAF & HARD OF HEARING (4600 DEBARR RD. in ANCHORAGE, AK)
(National Center for Education Statistics) - STATE ID-57010 Organizations: ANCHORAGE SCHOOL DISTRICT (SCHOOL DISTRICT)
CLARK MIDDLE SCHOOL (150 SOUTH BRAGAW STREET in ANCHORAGE, AK)
(National Center for Education Statistics) - STATE ID-50560 Organizations: ANCHORAGE SCHOOL DISTRICT (SCHOOL DISTRICT)
MCLAUGHLIN YOUTH CENTER (2600 PROVIDENCE DR. in ANCHORAGE, AK)
(National Center for Education Statistics) - STATE ID-57020 Organizations: ANCHORAGE SCHOOL DISTRICT (SCHOOL DISTRICT)
ANCHORAGE OUTREACH/PRIVATE (2220 NICHOLS ST. in ANCHORAGE, AK)
(National Center for Education Statistics) - STATE ID-57170 Organizations: ANCHORAGE SCHOOL DISTRICT (SCHOOL DISTRICT)
MAPLEWOOD GROUP HOME (1920 24TH STREET in ANCHORAGE, AK)
(National Center for Education Statistics) - STATE ID-57050 Organizations: ANCHORAGE SCHOOL DISTRICT (SCHOOL DISTRICT)
COLLEGE GATE ELEMENTARY (3101 SUNFLOWER STREET in ANCHORAGE, AK)
(National Center for Education Statistics) - STATE ID-50170 Organizations: ANCHORAGE SCHOOL DISTRICT (SCHOOL DISTRICT)
Housing units lacking complete plumbing facilities: 1.9% Housing units lacking complete kitchen facilities: 1.2%
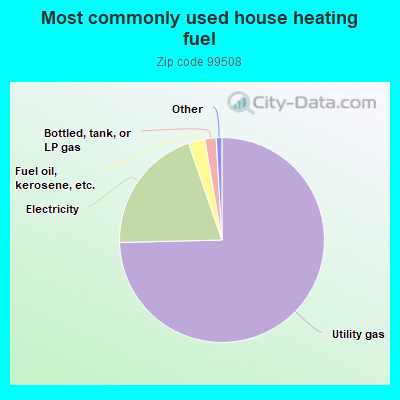
74.7%Utility gas
20.1%Electricity
2.6%Fuel oil, kerosene, etc.
1.8%Bottled, tank, or LP gas
Population in 1990: 29,857. Population change in the 1990s: +4,040 (+13.5%).
Place of birth for U.S.-born residents:
This state: 17,014
Northeast: 1,566
Midwest: 2,409
South: 3,472
West: 5,908
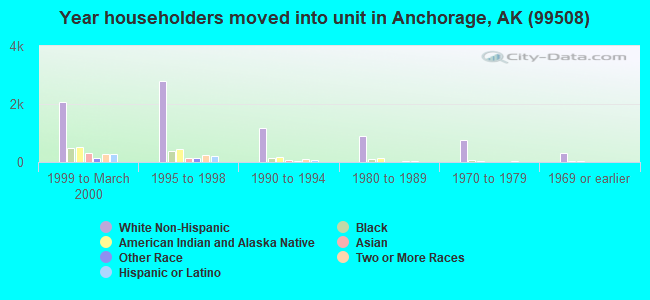
38% of the 99508 zip code residents lived in the same house 5 years ago. Out of people who lived in different houses, 61% lived in this county. Out of people who lived in different counties, 50% lived in Alaska.
83% of the 99508 zip code residents lived in the same house 1 year ago. Out of people who lived in different houses, 62% moved from this county. Out of people who lived in different houses, 9% moved from different county within same state. Out of people who lived in different houses, 22% moved from different state. Out of people who lived in different houses, 3% moved from abroad.
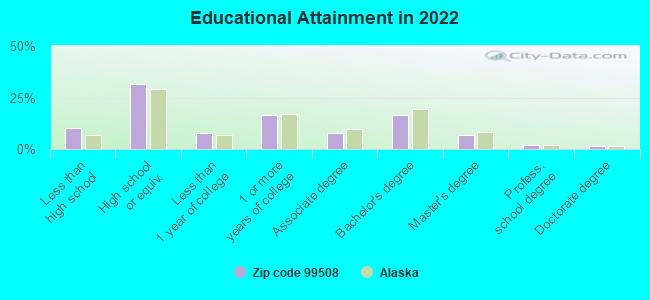
Private vs. public school enrollment:
Students in private schools in grades 1 to 8 (elementary and middle school): 530
Here:
12.8%
Alaska:
15.7%
Students in private schools in grades 9 to 12 (high school): 164
Here:
9.2%
Alaska:
13.7%
Students in private undergraduate colleges: 325
Here:
18.8%
Alaska:
14.7%
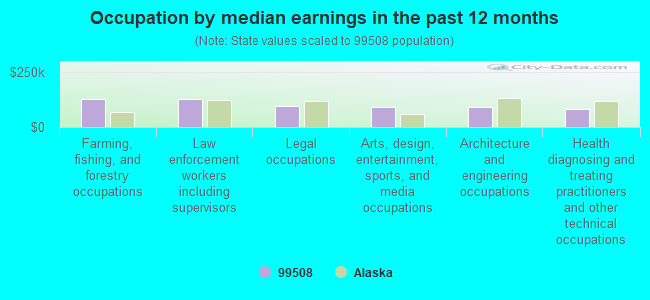
Occupation by median earnings in the past 12 months ($)
129,823Farming, fishing, and forestry occupations
127,632Law enforcement workers including supervisors
98,178Legal occupations
93,827Arts, design, entertainment, sports, and media occupations
93,021Architecture and engineering occupations
82,367Health diagnosing and treating practitioners and other technical occupations
Companies with biggest federal contracts located in this zip code (ANCHORAGE, AK):
BOWHEAD - EAGLE, L L C (2156 CRATAEGUS AVENUE; small business) : $39,555,304 in 66 contractsfrom 2001 to 2006
Contracts for Other Professional Services, Program Management/Support Services, Technical Representation Services -- Engines, Turbines, and Components, Logistics Support Services, and moreby Army Signed by year:2000: $0; 2001: $391,115; 2002: $670,611; 2003: $1,485,134; 2004: $15,840,717; 2005: $19,483,053; 2006: $1,684,674.
Biggest contracts:
$8,200,000 with Army for Other Professional Services. Taking place in CA. Signed on 2005-03-17. Completion date: 2005-08-31.
$2,823,979 with Army for Other Professional Services. Taking place in VA. Signed on 2005-03-31. Completion date: 2005-03-31.
$2,820,383, same as above.Signed on 2004-10-04. Completion date: 2005-03-31.
$2,200,000 with Army for Other Professional Services. Taking place in LA. Signed on 2004-09-24. Completion date: 2005-03-01.
AKIMA INTRA-DATA, LLC (1001 E BENSON BLVD STE-101; small business) : $29,876,280 in 54 contractsfrom 2004 to 2006
Contracts for Other Education and Training Services, ADP Data Conversion Services, Other ADP and Telecommunications Services (includes data storage on tapes, compact disks, etc.) by Army Signed by year:2000: $0; 2001: $0; 2002: $0; 2003: $0; 2004: $5,051,058; 2005: $24,225,488; 2006: $599,734.
Biggest contracts:
$3,762,423 with Army for Other Education and Training Services. Taking place in MS. Signed on 2005-06-22. Completion date: 2005-04-30.
$3,629,975, same as above.Signed on 2005-01-25. Completion date: 2005-03-31.
$2,850,992, same as above.Signed on 2005-11-04. Completion date: 2006-02-28.
$2,325,565, same as above.Signed on 2005-04-20. Completion date: 2005-04-30.
NANA SERVICES, LLC (1001 E BENSON BLVD; small business) : $22,642,001 in 49 contractsfrom 2001 to 2006
Contracts for Custodial Janitorial Services, Maintenance, Repair or Alteration of Real Property -- Dining Facilities, Food Services, Other Professional Services, and moreby Air Force, Navy, Maritime Administration, Department of Veterans Affairs, and others Signed by year:2000: $0; 2001: $979,709; 2002: $2,991,385; 2003: $4,842,346; 2004: $5,348,130; 2005: $6,941,005; 2006: $1,539,426.
Biggest contracts:
$2,187,805 with Air Force for Custodial Janitorial Services. Taking place in TX. Signed on 2004-10-01. Completion date: 2005-09-30.
$2,000,000 with Navy for Maintenance, Repair or Alteration of Real Property -- Dining Facilities. Taking place in HI. Signed on 2004-11-15. Completion date: 2008-09-14.
$1,994,569 with Air Force for Custodial Janitorial Services. Taking place in TX. Signed on 2005-10-01. Completion date: 2006-09-30.
$1,836,785, same as above.Signed on 2003-12-01. Completion date: 2004-09-30.
MWH AMERICAS, INC (1835 S BRAGAW STREET) : $18,113,276 in 18 contractsfrom 2001 to 2005
Contracts for Maintenance, Repair or Alteration of Real Property -- Other Utilities, Construction of Structures and Facilities -- Other Utilities, Construction of Structures and Facilities -- Other Conservation and Development Facilities, Other Architect and Engineering Services by Army, United States Coast Guard (disused code: now 7008) Signed by year:2000: $0; 2001: -$3,000; 2002: $10,205,000; 2003: $307,352; 2004: $7,328,664; 2005: $275,260; 2006: $0.
Biggest contracts:
$9,555,000 with Army for Maintenance, Repair or Alteration of Real Property -- Other Utilities. Signed on 2002-09-30. Completion date: 2003-08-30.
$7,260,000 with Army for Construction of Structures and Facilities -- Other Utilities. Signed on 2004-09-22. Completion date: 2006-07-12.
$650,000 with Army for Maintenance, Repair or Alteration of Real Property -- Other Utilities. Signed on 2002-09-30. Completion date: 2003-08-30.
$198,743 with Army for Construction of Structures and Facilities -- Other Conservation and Development Facilities. Signed on 2003-09-30. Completion date: 2003-09-23.
E AND S DIVERSIFIED SERVICES I (4433 MT VIEW DR; small business) : $15,377,104 in 59 contractsfrom 1999 to 2006
Contracts for Other Housekeeping Services, Food Services, Custodial Janitorial Services, Laundry and DryCleaning Services by Department of Defense, Defense Commissary Agency, Air Force, Federal Aviation Administration, and others Signed by year:2000: $4,978,173; 2001: $1,288,699; 2002: $1,367,832; 2003: $977,118; 2004: $2,323,648; 2005: $1,526,704; 2006: $1,752,192.
Biggest contracts:
$1,252,796 with Department of Defense for Other Housekeeping Services. Taking place in FL. Signed on 2003-07-28. Completion date: 2002-08-31.
$1,224,217, same as above.Signed on 2000-10-01. Completion date: 2002-08-31.
$1,193,087, same as above.Signed on 2002-07-31. Completion date: 2002-08-31.
$1,157,049, same as above.Signed on 2000-07-28. Completion date: 2001-08-31.
PROVIDENCE HEALTH SYSTEM-WASHI (3200 PROVIDENCE DRIVE) : $4,955,518 in 6 contractsfrom 2002 to 2006
Contracts for Internal Medicine Services, Telephone and/or Communications Services (includes Telegraph, Telex, and Cablevision Services) by Department of Veterans Affairs, Air Force Signed by year:2000: $0; 2001: $0; 2002: $4,753,499; 2003: $0; 2004: $110,446; 2005: $98,571; 2006: -$6,998.
Biggest contracts:
$2,455,894 with Department of Veterans Affairs for Internal Medicine Services. Signed on 2002-10-15. Completion date: 2005-08-15.
$1,437,974, same as above.Signed on 2002-10-15. Completion date: 2005-08-15.
$859,631, same as above.Signed on 2002-10-15. Completion date: 2005-08-15.
$110,446 with Air Force for Telephone and/or Communications Services (includes Telegraph, Telex, and Cablevision Services). Signed on 2004-09-27. Completion date: 2005-09-29.
ENTERPRISE ENGINEERING, INC (1709 S BRAGAW ST 202) : $1,613,764 in 89 contractsfrom 1999 to 2006
Contracts for Other Architect and Engineering Services, Architect - Engineer Services (including landscaping, interior layout, and designing) by Navy Signed by year:2000: $1,261,324; 2001: $197,681; 2002: $94,509; 2003: -$47,073; 2004: -$10,093; 2005: -$41,950; 2006: -$26,817.
Biggest contracts:
$169,337 with Navy for Other Architect and Engineering Services. Taking place in HI. Signed on 1999-11-30. Completion date: 2000-11-29.
$169,295, same as above.Signed on 2000-05-11. Completion date: 2000-09-21.
$154,315, same as above.Signed on 2000-06-20. Completion date: 2001-06-20.
$132,576, same as above.Signed on 2000-06-05. Completion date: 2001-06-04.
PHI GROUP, ALASKA (3525 WENTWORTH STREET; small business) : $1,323,758 in 5 contractsfrom 2005 to 2006
Contracts for Program Management/Support Services, Other Social Services -- Advanced Development (R&D) by Army Signed by year:2000: $0; 2001: $0; 2002: $0; 2003: $0; 2004: $0; 2005: $811,921; 2006: $511,837.
Biggest contracts:
$435,329 with Army for Program Management/Support Services. Signed on 2005-09-30. Completion date: 2006-09-29.
$376,592 with Army for Other Social Services -- Advanced Development (R&D). Signed on 2005-09-30. Completion date: 2006-09-29.
$281,018 with Army for Other Social Services -- Advanced Development (R&D). Taking place in TX. Signed on 2006-02-07. Completion date: 2006-09-29.
$141,000 with Army for Other Social Services -- Advanced Development (R&D). Signed on 2006-03-17. Completion date: 2006-03-21.
MQC ENTERPRISES, INC (4433 MOUNTAIN VIEW DRIVE) : $1,125,847 in 4 contractsfrom 2002 to 2005
$586,775 with Department of Defense for Other Housekeeping Services. Signed on 2003-05-29. Completion date: 2003-05-31.
$581,775 with Defense Commissary Agency for Other Housekeeping Services. Signed on 2005-06-01. Completion date: 2006-05-31.
$560,667 with Department of Defense for Other Housekeeping Services. Signed on 2002-04-24. Completion date: 2003-05-31.
-$603,370 with Defense Commissary Agency for Other Housekeeping Services. Signed on 2004-05-28. Completion date: 2003-05-31.
HOMELAND SECURITY CONSULTING (1242 ST GOTTHARD; small business)
$378,705 with Air Force for Other Management Support Services. Signed on 2005-07-11. Completion date: 2005-09-30.
Top industries in this zip code by the number of employees in 2005:
Health Care and Social Assistance: General Medical and Surgical Hospitals (over 1000 employees: 1 establishment, 500-999 employees: 1 establishment, 250-499 employees: 1 establishment)
Health Care and Social Assistance: Offices of Physicians (except Mental Health Specialists) (100-249: 1, 50-99: 2, 20-49: 12, 10-19: 30, 5-9: 44, 1-4: 97)
Health Care and Social Assistance: Other Individual and Family Services (over 1000: 1, 50-99: 1, 10-19: 1, 1-4: 3)
Health Care and Social Assistance: All Other Outpatient Care Centers (over 1000: 1, 20-49: 1, 10-19: 2, 1-4: 3)
Information: Television Broadcasting (500-999: 1)
Health Care and Social Assistance: Vocational Rehabilitation Services (250-499: 1, 20-49: 1, 1-4: 1)
Educational Services: Colleges, Universities, and Professional Schools (250-499: 1, 1-4: 1)
Accommodation and Food Services: Food Service Contractors (100-249: 1, 20-49: 3, 10-19: 2, 5-9: 2, 1-4: 3)
Health Care and Social Assistance: Home Health Care Services (100-249: 1, 20-49: 2, 5-9: 2)
People in group quarters in 2010:
293 people in college/university student housing
273 people in nursing facilities/skilled-nursing facilities
159 people in emergency and transitional shelters (with sleeping facilities) for people experiencing homelessness
146 people in workers' group living quarters and job corps centers
128 people in correctional residential facilities
102 people in residential treatment centers for juveniles (non-correctional)
74 people in group homes intended for adults
70 people in mental (psychiatric) hospitals and psychiatric units in other hospitals
70 people in other noninstitutional facilities
59 people in residential treatment centers for adults
6 people in group homes for juveniles (non-correctional)
5 people in residential schools for people with disabilities
People in group quarters in 2000:
622 people in college dormitories (includes college quarters off campus)
304 people in other noninstitutional group quarters
213 people in training schools for juvenile delinquents
77 people in homes for the mentally retarded
48 people in other group homes
43 people in mental (psychiatric) hospitals or wards
41 people in hospitals or wards for drug/alcohol abuse
40 people in homes or halfway houses for drug/alcohol abuse
38 people in homes for the mentally ill
30 people in residential treatment centers for emotionally disturbed children
14 people in religious group quarters
10 people in wards in general hospitals for patients who have no usual home elsewhere
9 people in agriculture workers' dormitories on farms
7 people in orthopedic wards and institutions for the physically handicapped
6 people in hospitals/wards and hospices for chronically ill
6 people in other hospitals or wards for chronically ill
3 people in other nonhousehold living situations
Fatal accident statistics in 2014:
Fatal accident count: 1
Vehicles involved in fatal accidents: 1
Fatal accidents caused by drunken drivers: 1
Fatalities: 1
Persons involved in fatal accidents: 1
Pedestrians involved in fatal accidents: 0
Fatal accident statistics in 2013:
Fatal accident count: 1
Vehicles involved in fatal accidents: 2
Fatal accidents caused by drunken drivers: 1
Fatalities: 1
Persons involved in fatal accidents: 9
Pedestrians involved in fatal accidents: 0
Home Mortgage Disclosure Act Aggregated Statistics For Year 2009 (Based on 8 full and 6 partial tracts)
A) FHA, FSA/RHS & VA Home Purchase Loans
B) Conventional Home Purchase Loans
C) Refinancings
D) Home Improvement Loans
E) Loans on Dwellings For 5+ Families
F) Non-occupant Loans on < 5 Family Dwellings (A B C & D)
G) Loans On Manufactured Home Dwelling (A B C & D)
Number
Average Value
Number
Average Value
Number
Average Value
Number
Average Value
Number
Average Value
Number
Average Value
Number
Average Value
LOANS ORIGINATED
319
$216,476
203
$208,865
1,028
$213,035
38
$109,319
5
$649,738
96
$190,391
0
$0
APPLICATIONS APPROVED, NOT ACCEPTED
16
$208,732
8
$213,161
93
$191,519
5
$73,876
2
$662,800
12
$174,020
0
$0
APPLICATIONS DENIED
61
$211,694
47
$183,081
351
$214,714
55
$52,945
0
$0
27
$150,734
4
$28,830
APPLICATIONS WITHDRAWN
44
$219,853
19
$203,316
277
$193,713
30
$87,964
0
$0
39
$171,112
0
$0
FILES CLOSED FOR INCOMPLETENESS
0
$0
3
$270,053
53
$196,668
7
$90,357
0
$0
2
$224,935
1
$24,360
Aggregated Statistics For Year 2008 (Based on 8 full and 6 partial tracts)
A) FHA, FSA/RHS & VA Home Purchase Loans
B) Conventional Home Purchase Loans
C) Refinancings
D) Home Improvement Loans
E) Loans on Dwellings For 5+ Families
F) Non-occupant Loans on < 5 Family Dwellings (A B C & D)
G) Loans On Manufactured Home Dwelling (A B C & D)
Number
Average Value
Number
Average Value
Number
Average Value
Number
Average Value
Number
Average Value
Number
Average Value
Number
Average Value
LOANS ORIGINATED
320
$212,997
281
$205,389
476
$200,470
33
$124,858
14
$794,911
92
$175,620
2
$41,435
APPLICATIONS APPROVED, NOT ACCEPTED
13
$206,284
15
$184,902
65
$174,595
4
$54,698
0
$0
7
$176,889
1
$11,980
APPLICATIONS DENIED
31
$198,785
61
$202,606
273
$216,815
46
$58,512
5
$534,158
56
$197,291
4
$5,862
APPLICATIONS WITHDRAWN
32
$207,966
34
$227,587
164
$204,602
17
$78,405
0
$0
32
$175,798
0
$0
FILES CLOSED FOR INCOMPLETENESS
0
$0
1
$316,000
35
$202,307
5
$64,194
0
$0
3
$198,070
0
$0
Aggregated Statistics For Year 2007 (Based on 8 full and 6 partial tracts)
A) FHA, FSA/RHS & VA Home Purchase Loans
B) Conventional Home Purchase Loans
C) Refinancings
D) Home Improvement Loans
E) Loans on Dwellings For 5+ Families
F) Non-occupant Loans on < 5 Family Dwellings (A B C & D)
G) Loans On Manufactured Home Dwelling (A B C & D)
Number
Average Value
Number
Average Value
Number
Average Value
Number
Average Value
Number
Average Value
Number
Average Value
Number
Average Value
LOANS ORIGINATED
220
$203,202
423
$176,488
654
$187,475
76
$100,232
6
$418,297
169
$184,385
0
$0
APPLICATIONS APPROVED, NOT ACCEPTED
12
$261,831
38
$153,704
94
$170,169
17
$80,532
0
$0
34
$163,567
0
$0
APPLICATIONS DENIED
25
$245,152
97
$211,421
442
$193,769
106
$66,308
0
$0
76
$207,681
8
$23,955
APPLICATIONS WITHDRAWN
16
$190,499
81
$168,833
224
$194,627
45
$58,959
5
$376,286
46
$182,327
2
$24,980
FILES CLOSED FOR INCOMPLETENESS
0
$0
11
$235,657
38
$199,988
12
$100,219
0
$0
1
$256,000
0
$0
Aggregated Statistics For Year 2006 (Based on 8 full and 6 partial tracts)
A) FHA, FSA/RHS & VA Home Purchase Loans
B) Conventional Home Purchase Loans
C) Refinancings
D) Home Improvement Loans
E) Loans on Dwellings For 5+ Families
F) Non-occupant Loans on < 5 Family Dwellings (A B C & D)
G) Loans On Manufactured Home Dwelling (A B C & D)
Number
Average Value
Number
Average Value
Number
Average Value
Number
Average Value
Number
Average Value
Number
Average Value
Number
Average Value
LOANS ORIGINATED
222
$183,957
724
$164,945
737
$174,825
59
$94,870
14
$477,266
192
$181,657
2
$158,950
APPLICATIONS APPROVED, NOT ACCEPTED
10
$222,471
79
$172,992
108
$182,842
28
$77,254
2
$268,860
29
$191,008
0
$0
APPLICATIONS DENIED
13
$165,987
199
$147,371
433
$183,390
76
$53,709
1
$63,870
96
$160,919
10
$104,910
APPLICATIONS WITHDRAWN
20
$236,062
182
$138,652
269
$172,134
32
$90,275
6
$3,718,630
46
$150,668
2
$149,955
FILES CLOSED FOR INCOMPLETENESS
0
$0
17
$135,327
73
$182,784
3
$116,713
0
$0
6
$203,153
0
$0
Aggregated Statistics For Year 2005 (Based on 8 full and 6 partial tracts)
A) FHA, FSA/RHS & VA Home Purchase Loans
B) Conventional Home Purchase Loans
C) Refinancings
D) Home Improvement Loans
E) Loans on Dwellings For 5+ Families
F) Non-occupant Loans on < 5 Family Dwellings (A B C & D)
G) Loans On Manufactured Home Dwelling (A B C & D)
Number
Average Value
Number
Average Value
Number
Average Value
Number
Average Value
Number
Average Value
Number
Average Value
Number
Average Value
LOANS ORIGINATED
283
$189,135
791
$152,969
804
$168,683
82
$81,987
14
$636,084
264
$172,619
1
$43,810
APPLICATIONS APPROVED, NOT ACCEPTED
9
$259,176
50
$143,202
113
$149,441
14
$109,662
0
$0
29
$187,255
3
$57,380
APPLICATIONS DENIED
17
$229,520
193
$162,029
383
$168,121
107
$65,669
0
$0
85
$163,378
7
$25,379
APPLICATIONS WITHDRAWN
10
$283,859
108
$156,201
216
$161,864
16
$82,257
3
$707,747
28
$219,242
2
$3,000
FILES CLOSED FOR INCOMPLETENESS
0
$0
23
$167,169
146
$169,700
13
$73,465
0
$0
11
$191,814
0
$0
Aggregated Statistics For Year 2004 (Based on 8 full and 6 partial tracts)
A) FHA, FSA/RHS & VA Home Purchase Loans
B) Conventional Home Purchase Loans
C) Refinancings
D) Home Improvement Loans
E) Loans on Dwellings For 5+ Families
F) Non-occupant Loans on < 5 Family Dwellings (A B C & D)
G) Loans On Manufactured Home Dwelling (A B C & D)
Number
Average Value
Number
Average Value
Number
Average Value
Number
Average Value
Number
Average Value
Number
Average Value
Number
Average Value
LOANS ORIGINATED
364
$165,073
737
$155,838
834
$156,559
59
$45,546
16
$633,629
243
$166,770
2
$19,120
APPLICATIONS APPROVED, NOT ACCEPTED
10
$181,269
79
$192,456
115
$147,074
13
$81,533
1
$165,000
47
$179,038
1
$87,660
APPLICATIONS DENIED
31
$191,215
132
$161,349
375
$153,603
59
$53,359
2
$1,517,540
69
$165,937
8
$13,990
APPLICATIONS WITHDRAWN
39
$160,823
139
$162,116
209
$151,236
13
$56,456
2
$242,315
61
$172,106
1
$1,600
FILES CLOSED FOR INCOMPLETENESS
3
$211,377
12
$179,069
170
$153,024
9
$85,287
0
$0
11
$158,713
0
$0
Aggregated Statistics For Year 2003 (Based on 8 full and 6 partial tracts)
A) FHA, FSA/RHS & VA Home Purchase Loans
B) Conventional Home Purchase Loans
C) Refinancings
D) Home Improvement Loans
E) Loans on Dwellings For 5+ Families
F) Non-occupant Loans on < 5 Family Dwellings (A B C & D)
Number
Average Value
Number
Average Value
Number
Average Value
Number
Average Value
Number
Average Value
Number
Average Value
LOANS ORIGINATED
403
$161,030
629
$150,311
1,974
$140,710
72
$34,243
18
$274,764
324
$150,732
APPLICATIONS APPROVED, NOT ACCEPTED
15
$159,116
43
$134,397
154
$133,181
15
$97,922
0
$0
27
$147,922
APPLICATIONS DENIED
35
$146,681
72
$152,373
431
$124,538
64
$37,050
2
$49,985
63
$147,047
APPLICATIONS WITHDRAWN
74
$153,678
103
$144,150
350
$125,338
5
$98,276
3
$632,907
65
$159,702
FILES CLOSED FOR INCOMPLETENESS
3
$241,980
11
$156,021
57
$149,515
8
$28,380
0
$0
8
$114,756
Aggregated Statistics For Year 2002 (Based on 8 full and 6 partial tracts)
A) FHA, FSA/RHS & VA Home Purchase Loans
B) Conventional Home Purchase Loans
C) Refinancings
D) Home Improvement Loans
E) Loans on Dwellings For 5+ Families
F) Non-occupant Loans on < 5 Family Dwellings (A B C & D)
Number
Average Value
Number
Average Value
Number
Average Value
Number
Average Value
Number
Average Value
Number
Average Value
LOANS ORIGINATED
382
$157,052
450
$133,803
1,249
$141,198
56
$16,469
12
$391,485
192
$143,043
APPLICATIONS APPROVED, NOT ACCEPTED
18
$159,591
24
$143,470
105
$130,921
10
$48,895
0
$0
18
$119,112
APPLICATIONS DENIED
31
$154,802
68
$115,501
244
$134,828
45
$28,231
0
$0
55
$139,395
APPLICATIONS WITHDRAWN
41
$142,414
82
$159,872
154
$139,661
3
$15,930
0
$0
36
$148,203
FILES CLOSED FOR INCOMPLETENESS
3
$226,260
14
$151,765
46
$130,587
0
$0
0
$0
5
$155,382
Aggregated Statistics For Year 2001 (Based on 8 full and 6 partial tracts)
A) FHA, FSA/RHS & VA Home Purchase Loans
B) Conventional Home Purchase Loans
C) Refinancings
D) Home Improvement Loans
E) Loans on Dwellings For 5+ Families
F) Non-occupant Loans on < 5 Family Dwellings (A B C & D)
Number
Average Value
Number
Average Value
Number
Average Value
Number
Average Value
Number
Average Value
Number
Average Value
LOANS ORIGINATED
371
$146,815
445
$127,115
679
$138,561
94
$20,274
16
$1,244,820
149
$109,790
APPLICATIONS APPROVED, NOT ACCEPTED
6
$148,138
32
$142,963
53
$119,101
9
$20,022
1
$308,980
13
$173,022
APPLICATIONS DENIED
13
$136,281
47
$94,309
112
$107,371
47
$20,228
0
$0
23
$78,590
APPLICATIONS WITHDRAWN
44
$155,037
32
$122,144
117
$119,091
7
$19,304
1
$231,260
20
$104,458
FILES CLOSED FOR INCOMPLETENESS
2
$172,950
1
$125,350
24
$83,671
0
$0
0
$0
2
$144,915
Aggregated Statistics For Year 2000 (Based on 8 full and 6 partial tracts)
A) FHA, FSA/RHS & VA Home Purchase Loans
B) Conventional Home Purchase Loans
C) Refinancings
D) Home Improvement Loans
E) Loans on Dwellings For 5+ Families
F) Non-occupant Loans on < 5 Family Dwellings (A B C & D)
Number
Average Value
Number
Average Value
Number
Average Value
Number
Average Value
Number
Average Value
Number
Average Value
LOANS ORIGINATED
364
$142,274
367
$113,322
161
$96,479
132
$24,412
19
$853,064
82
$74,917
APPLICATIONS APPROVED, NOT ACCEPTED
8
$143,962
16
$120,144
43
$93,504
17
$32,692
0
$0
13
$85,212
APPLICATIONS DENIED
10
$184,989
58
$95,250
108
$103,283
35
$16,344
1
$95,810
15
$100,931
APPLICATIONS WITHDRAWN
55
$133,860
48
$125,013
73
$108,783
11
$16,622
2
$223,945
26
$98,598
FILES CLOSED FOR INCOMPLETENESS
2
$132,500
5
$68,752
18
$86,459
3
$14,293
0
$0
3
$162,340
Aggregated Statistics For Year 1999 (Based on 3 full and 5 partial tracts)
A) FHA, FSA/RHS & VA Home Purchase Loans
B) Conventional Home Purchase Loans
C) Refinancings
D) Home Improvement Loans
E) Loans on Dwellings For 5+ Families
F) Non-occupant Loans on < 5 Family Dwellings (A B C & D)
2002 - 2018 National Fire Incident Reporting System (NFIRS) incidents
Based on the data from the years 2002 - 2018 the average number of fires per year is 137. The highest number of reported fire incidents - 164 took place in 2009, and the least - 114 in 2012. The data has a rising trend.
When looking into fire subcategories, the most reports belonged to: Structure Fires (48.0%), and Outside Fires (31.2%).
Fire incident types reported to NFIRS in Zip Code 99508


 Nearest zip codes: 99501, 99506, 99513, 99504, 99518, 99507.


 Based on the data from the years 2002 - 2018 the average number of fires per year is 137. The highest number of reported fire incidents - 164 took place in 2009, and the least - 114 in 2012. The data has a rising trend.
 When looking into fire subcategories, the most reports belonged to: Structure Fires (48.0%), and Outside Fires (31.2%).