Estimated zip code population in 2022: 972 Zip code population in 2010: 1,385 Zip code population in 2000: 1,092
Houses and condos: 1,117 Renter-occupied apartments: 46
% of renters here:
10%
State:
34%
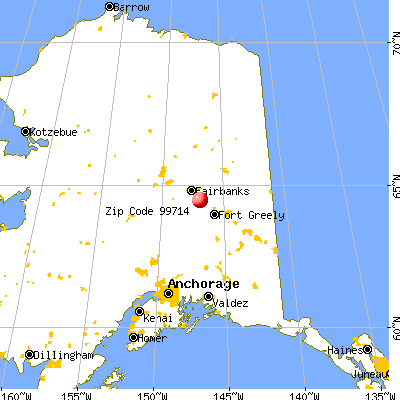
March 2022 cost of living index in zip code 99714: 107.1 (more than average, U.S. average is 100)
Land area: 348.4 sq. mi. Water area: 27.3 sq. mi.
Population density: 3 people per square mile
(very low).
OSM Map
General Map
Google Map
MSN Map
OSM Map
General Map
Google Map
MSN Map
OSM Map
General Map
Google Map
MSN Map
OSM Map
General Map
Google Map
MSN Map
Please wait while loading the map...
Real estate property taxes paid for housing units in 2022:
This zip code:
0.7% ($2,022)
Alaska:
1.1% ($3,650)
Median real estate property taxes paid for housing units with mortgages in 2022: $2,083 (0.9%) Median real estate property taxes paid for housing units with no mortgage in 2022: $2,005 (0.7%)
Estimated median house/condo value in 2022: $270,473
99714:
$270,473
Alaska:
$336,900
According to our research of Alaska and other state lists, there were 2 registered sex offenders living in 99714 zip code as of June 16, 2024. The ratio of all residents to sex offenders in zip code 99714 is 605 to 1. The ratio of registered sex offenders to all residents in this zip code is lower than the state average.
Median resident age:
This zip code:
53.8 years
Alaska median age:
35.9 years
Average household size:
This zip code:
2.0 people
Alaska:
2.6 people
Averages for the 2020 tax year for zip code 99714, filed in 2021:
Average Adjusted Gross Income (AGI) in 2020: $71,135 (Individual Income Tax Returns)
Here:
$71,135
State:
$75,656
Salary/wage: $62,186 (reported on 75.5% of returns)
Here:
$62,186
State:
$62,417
(% of AGI for various income ranges: 905.0% for AGIs below $25k, 3282.5% for AGIs $25k-50k, 5391.7% for AGIs $50k-75k, 8690.0% for AGIs $75k-100k, 17255.7% for AGIs $100k-200k)
Taxable interest for individuals: $608 (reported on 26.5% of returns)
This zip code:
$608
Alaska:
$1,789
(% of AGI for various income ranges: 17.5% for AGIs $25k-50k, 76.7% for AGIs $50k-75k, 27.1% for AGIs $100k-200k)
Ordinary dividends: $2,856 (reported on 18.4% of returns)
Here:
$2,856
State:
$5,446
(% of AGI for various income ranges: 22.5% for AGIs below $25k, 126.7% for AGIs $50k-75k, 232.9% for AGIs $100k-200k)
Net capital gain/loss in AGI: +$10,656 (reported on 18.4% of returns)
Here:
+$10,656
State:
+$17,390
(% of AGI for various income ranges: 50.0% for AGIs below $25k, 408.3% for AGIs $50k-75k, 962.9% for AGIs $100k-200k)
Profit/loss from business: +$3,329 (reported on 14.3% of returns)
Here:
+$3,329
State:
+$14,751
(% of AGI for various income ranges: 400.0% for AGIs $100k-200k)
Taxable individual retirement arrangement distribution: $14,275 (reported on 8.2% of returns)
99714:
$14,275
Alaska:
$26,310
(% of AGI for various income ranges: 1142.0% for AGIs $75k-100k)
Earned income credit: $2,800 (reported on 8.2% of returns)
Here:
$2,800
State:
$2,017
(% of AGI for various income ranges: 48.8% for AGIs below $25k, 91.2% for AGIs $25k-50k)
Percentage of individuals using paid preparers for their 2020 taxes: 91.8%
Here:
92%
State:
92%
(% for various income ranges: 83.3% for AGIs below $25k, 90.0% for AGIs $25k-50k, 100.0% for AGIs $50k-75k, 100.0% for AGIs $75k-100k, 91.7% for AGIs $100k-200k)
Averages for the 2012 tax year for zip code 99714, filed in 2013:
Average Adjusted Gross Income (AGI) in 2012: $54,254 (Individual Income Tax Returns)
Here:
$54,254
State:
$63,695
Salary/wage: $46,558 (reported on 75.0% of returns)
Here:
$46,558
State:
$52,620
(% of AGI for various income ranges: 59.5% for AGIs below $25k, 63.3% for AGIs $25k-50k, 73.3% for AGIs $50k-75k, 66.3% for AGIs $75k-100k, 60.5% for AGIs $100k-200k)
Taxable interest for individuals: $656 (reported on 33.3% of returns)
This zip code:
$656
Alaska:
$1,478
(% of AGI for various income ranges: 0.3% for AGIs below $25k, 0.6% for AGIs $25k-50k, 0.4% for AGIs $50k-75k, 0.4% for AGIs $75k-100k, 0.3% for AGIs $100k-200k)
Ordinary dividends: $7,144 (reported on 18.8% of returns)
Here:
$7,144
State:
$4,666
(% of AGI for various income ranges: 6.9% for AGIs below $25k, 10.7% for AGIs $25k-50k, 0.5% for AGIs $100k-200k)
Net capital gain/loss in AGI: +$7,086 (reported on 14.6% of returns)
Here:
+$7,086
State:
+$12,441
Profit/loss from business: +$2,557 (reported on 14.6% of returns)
Here:
+$2,557
State:
+$17,607
Taxable individual retirement arrangement distribution: $14,500 (reported on 6.2% of returns)
99714:
$14,500
Alaska:
$19,871
Total itemized deductions: $17,533 (19% of AGI, reported on 18.8% of returns)
Here:
$17,533
State:
$20,513
Here:
18.6% of AGI
State:
15.5% of AGI
Charity contributions: $6,100 (reported on 14.6% of returns)
Here:
$6,100
State:
$4,894
Taxes paid: $2,700 (reported on 18.8% of returns)
99714:
$2,700
State:
$4,526
Earned income credit: $1,620 (reported on 10.4% of returns)
Here:
$1,620
State:
$1,975
(% of AGI for various income ranges: 4.9% for AGIs below $25k)
Percentage of individuals using paid preparers for their 2012 taxes: 43.8%
Here:
44%
State:
43%
(% for various income ranges: 40.0% for AGIs below $25k, 33.3% for AGIs $25k-50k, 50.0% for AGIs $50k-75k, 50.0% for AGIs $75k-100k, 57.1% for AGIs $100k-200k)
Averages for the 2004 tax year for zip code 99714, filed in 2005:
Average Adjusted Gross Income (AGI) in 2004: $35,397 (Individual Income Tax Returns)
Here:
$35,397
State:
$45,527
Salary/wage: $35,912 (reported on 77.2% of returns)
Here:
$35,912
State:
$41,300
(% of AGI for various income ranges: 171.5% for AGIs below $10k, 84.6% for AGIs $10k-25k, 78.3% for AGIs $25k-50k, 78.5% for AGIs $50k-75k, 80.9% for AGIs $75k-100k, 65.4% for AGIs over 100k)
Taxable interest for individuals: $784 (reported on 45.1% of returns)
This zip code:
$784
Alaska:
$1,233
(% of AGI for various income ranges: 4.9% for AGIs below $10k, 0.3% for AGIs $10k-25k, 1.0% for AGIs $25k-50k, 1.0% for AGIs $50k-75k, 1.4% for AGIs $75k-100k, 0.5% for AGIs over 100k)
Taxable dividends: $965 (reported on 16.7% of returns)
Here:
$965
State:
$2,694
(% of AGI for various income ranges: 4.9% for AGIs below $10k, 1.2% for AGIs $25k-50k, 0.3% for AGIs $50k-75k, 0.2% for AGIs $75k-100k)
Total itemized deductions: $14,456 (22% of AGI, reported on 15.4% of returns)
Here:
$14,456
State:
$16,716
Here:
22.0% of AGI
State:
18.3% of AGI
(% of AGI for various income ranges: 9.1% for AGIs $25k-50k, 8.4% for AGIs $50k-75k, 4.3% for AGIs $75k-100k, 6.1% for AGIs over 100k)
Charity contributions deductions: $3,277 (5% of AGI, reported on 12.6% of returns)
Here:
$3,277
State:
$3,652
Here:
5.0% of AGI
State:
3.8% of AGI
(% of AGI for various income ranges: 1.5% for AGIs $25k-50k, 2.0% for AGIs $50k-75k, 0.4% for AGIs $75k-100k, 1.2% for AGIs over 100k)
Total tax: $4,530 (reported on 78.6% of returns)
99714:
$4,530
State:
$7,049
(% of AGI for various income ranges: 4.1% for AGIs below $10k, 4.2% for AGIs $10k-25k, 7.2% for AGIs $25k-50k, 10.1% for AGIs $50k-75k, 12.1% for AGIs $75k-100k, 14.9% for AGIs over 100k)
Earned income credit: $1,475 (reported on 11.5% of returns)
Here:
$1,475
State:
$1,505
Percentage of individuals using paid preparers for their 2004 taxes: 53.9%
Here:
54%
State:
49%
(% for various income ranges: 50.7% for AGIs below $10k, 58.3% for AGIs $10k-25k, 51.3% for AGIs $25k-50k, 60.3% for AGIs $50k-75k, 44.4% for AGIs $75k-100k, 64.3% for AGIs over 100k)
Household received Food Stamps/SNAP in the past 12 months: 24 Household did not receive Food Stamps/SNAP in the past 12 months: 459
Women who did not have a birth in the past 12 months: 163 (87 now married, 74 unmarried)
Housing units in zip code 99714 with a mortgage: 163 (7 second mortgage, 12 home equity loan, 1 both second mortgage and home equity loan) Houses without a mortgage: 15
Median monthly owner costs for units with a mortgage: $1,825 Median monthly owner costs for units without a mortgage: $412
Residents with income below the poverty level in 2022:
This zip code:
16.0%
Whole state:
11.0%
Residents with income below 50% of the poverty level in 2022:
This zip code:
15.4%
Whole state:
5.6%
Median number of rooms in houses and condos:
Here:
3.6
State:
5.6
Median number of rooms in apartments:
Here:
4.2
State:
3.9
Notable locations in this zip code not listed on our city pages
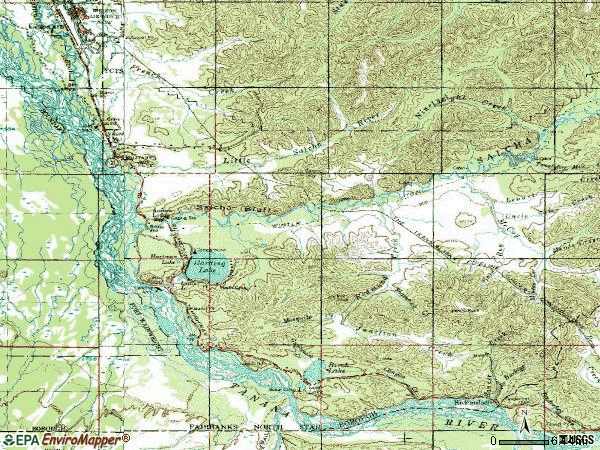
Notable locations in zip code 99714: Bingle Camp (A), Canyon Creek Camp (B), Salcha Fire and Rescue Station 1 (C), Salcha Fire and Rescue Station 2 (D). Display/hide their locations on the map
Lakes: Birch Lake (A), Little Harding Lake (B), Stringer Road Pond (C), Chisholm Lake (D), Harding Lake (E), Hartman Lake (F), Little Lake (G). Display/hide their locations on the map
Streams, rivers, and creeks: Buckeye Creek (A), Canyon Creek (B), Shamrock Creek (C), Salcha River (D), Mosquito Creek (E), Gunnysack Creek (F), Junction Creek (G), Salcha Slough (H), Democrat Creek (I). Display/hide their locations on the map
Size of family households: 239 2-persons, 37 3-persons, 15 4-persons, 8 5-persons
Size of nonfamily households: 182 1-person, 10 2-persons
38 married couples with children.
41 single-parent households (41 women).
93.9% of residents of 99714 zip code speak English at home.
6.6% of residents speak other Indo-European language at home (100% very well).
1.3% of residents speak other language at home (100% very well).
Foreign born population: 31 (3.2%) (52.9% of them are naturalized citizens)
This zip code:
3.2%
Whole state:
7.5%
55%Serbia
42%Micronesia
36%English
18%Norwegian
7%European
5%German
5%Scotch-Irish
4%Ukrainian
3%American
Year of entry for the foreign-born population
172010 or later
02000 to 2009
171990 to 1999
4Before 1990
Facilities with environmental interests located in this zip code:
AMERICAN CREEK; ERICKSON, KEN (9857 SALCHA DR in SALCHA, AK)
National Pollutant Discharge Elimination System NON-MAJOR (Tracking pollutant discharge elimination systems) - permit Business SIC classification: GOLD ORES Alternative names: ERIKSON, KEN
TAPS PUMP STATION NUMBER 8 (RICHARDSON HIGHWAY MILE POST 330 in SALCHA, AK)
Conditionally Exempt Small Quantity Generators, less than 100 kg/month of hazardous waste (Resource Conservation and Recovery Act (tracking hazardous waste)) - notification USED OIL PROGRAM (Resource Conservation and Recovery Act (tracking hazardous waste)) Organizations: REFERENCE LETTER #01-17289 (CONTACT/OWNER)
Alternative names: TAPS PUMP STA 8
Housing units lacking complete plumbing facilities: 25.0% Housing units lacking complete kitchen facilities: 24.1%
68.7%Fuel oil, kerosene, etc.
24.5%Wood
4.9%Utility gas
2.1%Bottled, tank, or LP gas
Population in 1990: 890. Population change in the 1990s: +202 (+22.7%).
Place of birth for U.S.-born residents:
This state: 132
Northeast: 87
Midwest: 234
South: 114
West: 377
56% of the 99714 zip code residents lived in the same house 5 years ago. Out of people who lived in different houses, 51% lived in this county. Out of people who lived in different counties, 50% lived in Alaska.
90% of the 99714 zip code residents lived in the same house 1 year ago. Out of people who lived in different houses, 49% moved from this county. Out of people who lived in different houses, 6% moved from different county within same state. Out of people who lived in different houses, 43% moved from different state. Out of people who lived in different houses, 3% moved from abroad.
Private vs. public school enrollment:
Students in private schools in grades 1 to 8 (elementary and middle school): 21
Here:
37.4%
Alaska:
15.7%
Students in private schools in grades 9 to 12 (high school): 5
Here:
21.5%
Alaska:
13.7%
Students in private undergraduate colleges:
Here:
0.0%
Alaska:
14.7%
Occupation by median earnings in the past 12 months ($)
104,299Transportation occupations
93,851Installation, maintenance, and repair occupations
61,509Sales and related occupations
56,370Management occupations
52,002Office and administrative support occupations
17,514Education, training, and library occupations
Companies with federal contracts located in this zip code:
WHITE SPRUCE ENTERPRISES INC (10293 OLD VALDEZ TRAIL in SALCHA, AK; small business) : $10,850 in 2 contractsin 2002
$8,250 with Army for Prefabricated and Portable Buildings. Signed on 2002-08-28. Completion date: 2002-09-27.
$2,600 with Army for Trailers. Signed on 2002-07-18. Completion date: 2002-07-15.
Top industries in this zip code by the number of employees in 2005:
Administrative and Support and Waste Management and Remediation Services: Facilities Support Services (20-49 employees: 1 establishment)
Construction: Commercial and Institutional Building Construction (10-19: 1)
Construction: Electrical Contractors (5-9: 1)
Accommodation and Food Services: Hotels (except Casino Hotels) and Motels (5-9: 1)
Professional, Scientific, and Technical Services: Research and Development in the Physical, Engineering, and Life Sciences (5-9: 1)
Construction: New Single-Family Housing Construction (except Operative Builders) (1-4: 2)
Other Services (except Public Administration): Religious Organizations (1-4: 1)
Fatal accident statistics in 2010:
Fatal accident count: 2
Vehicles involved in fatal accidents: 3
Fatal accidents caused by drunken drivers: 1
Fatalities: 2
Persons involved in fatal accidents: 5
Pedestrians involved in fatal accidents: 0
Home Mortgage Disclosure Act Aggregated Statistics For Year 2009 (Based on 2 partial tracts)
A) FHA, FSA/RHS & VA Home Purchase Loans
B) Conventional Home Purchase Loans
C) Refinancings
D) Home Improvement Loans
F) Non-occupant Loans on < 5 Family Dwellings (A B C & D)
Number
Average Value
Number
Average Value
Number
Average Value
Number
Average Value
Number
Average Value
LOANS ORIGINATED
2
$180,195
2
$138,330
9
$172,257
1
$39,710
4
$112,325
APPLICATIONS APPROVED, NOT ACCEPTED
0
$0
0
$0
0
$0
0
$0
0
$0
APPLICATIONS DENIED
0
$0
0
$0
3
$134,660
0
$0
1
$182,140
APPLICATIONS WITHDRAWN
0
$0
0
$0
2
$124,950
0
$0
1
$140,700
FILES CLOSED FOR INCOMPLETENESS
0
$0
0
$0
0
$0
1
$66,030
0
$0
Aggregated Statistics For Year 2008 (Based on 2 partial tracts)
A) FHA, FSA/RHS & VA Home Purchase Loans
B) Conventional Home Purchase Loans
C) Refinancings
D) Home Improvement Loans
F) Non-occupant Loans on < 5 Family Dwellings (A B C & D)
Number
Average Value
Number
Average Value
Number
Average Value
Number
Average Value
Number
Average Value
LOANS ORIGINATED
2
$122,360
5
$157,448
4
$186,990
2
$45,535
3
$161,993
APPLICATIONS APPROVED, NOT ACCEPTED
0
$0
0
$0
1
$153,220
0
$0
0
$0
APPLICATIONS DENIED
2
$156,670
0
$0
3
$142,283
0
$0
0
$0
APPLICATIONS WITHDRAWN
1
$148,900
0
$0
3
$155,520
0
$0
0
$0
FILES CLOSED FOR INCOMPLETENESS
0
$0
0
$0
2
$120,415
0
$0
0
$0
Aggregated Statistics For Year 2007 (Based on 2 partial tracts)
A) FHA, FSA/RHS & VA Home Purchase Loans
B) Conventional Home Purchase Loans
C) Refinancings
D) Home Improvement Loans
F) Non-occupant Loans on < 5 Family Dwellings (A B C & D)
Number
Average Value
Number
Average Value
Number
Average Value
Number
Average Value
Number
Average Value
LOANS ORIGINATED
2
$190,985
6
$157,102
6
$160,052
3
$82,293
3
$125,307
APPLICATIONS APPROVED, NOT ACCEPTED
0
$0
0
$0
3
$77,257
0
$0
0
$0
APPLICATIONS DENIED
0
$0
1
$67,330
6
$108,547
3
$72,653
2
$94,090
APPLICATIONS WITHDRAWN
0
$0
1
$225,730
4
$167,892
2
$82,005
1
$173,070
FILES CLOSED FOR INCOMPLETENESS
0
$0
0
$0
0
$0
0
$0
0
$0
Aggregated Statistics For Year 2006 (Based on 2 partial tracts)
A) FHA, FSA/RHS & VA Home Purchase Loans
B) Conventional Home Purchase Loans
C) Refinancings
D) Home Improvement Loans
F) Non-occupant Loans on < 5 Family Dwellings (A B C & D)
G) Loans On Manufactured Home Dwelling (A B C & D)
Number
Average Value
Number
Average Value
Number
Average Value
Number
Average Value
Number
Average Value
Number
Average Value
LOANS ORIGINATED
2
$142,210
7
$147,114
6
$134,300
2
$16,830
4
$136,062
0
$0
APPLICATIONS APPROVED, NOT ACCEPTED
0
$0
0
$0
0
$0
0
$0
0
$0
0
$0
APPLICATIONS DENIED
0
$0
2
$151,060
5
$134,918
1
$25,900
0
$0
1
$205,440
APPLICATIONS WITHDRAWN
0
$0
1
$114,370
3
$156,240
0
$0
1
$155,810
0
$0
FILES CLOSED FOR INCOMPLETENESS
0
$0
0
$0
1
$117,830
0
$0
0
$0
0
$0
Aggregated Statistics For Year 2005 (Based on 2 partial tracts)
A) FHA, FSA/RHS & VA Home Purchase Loans
B) Conventional Home Purchase Loans
C) Refinancings
D) Home Improvement Loans
F) Non-occupant Loans on < 5 Family Dwellings (A B C & D)
Number
Average Value
Number
Average Value
Number
Average Value
Number
Average Value
Number
Average Value
LOANS ORIGINATED
2
$197,025
4
$149,225
5
$135,090
2
$52,655
2
$136,600
APPLICATIONS APPROVED, NOT ACCEPTED
0
$0
0
$0
2
$100,995
0
$0
0
$0
APPLICATIONS DENIED
0
$0
4
$112,215
3
$110,490
3
$31,650
1
$126,030
APPLICATIONS WITHDRAWN
0
$0
2
$100,995
2
$192,280
0
$0
0
$0
FILES CLOSED FOR INCOMPLETENESS
0
$0
0
$0
0
$0
0
$0
0
$0
Aggregated Statistics For Year 2004 (Based on 2 partial tracts)
A) FHA, FSA/RHS & VA Home Purchase Loans
B) Conventional Home Purchase Loans
C) Refinancings
D) Home Improvement Loans
F) Non-occupant Loans on < 5 Family Dwellings (A B C & D)
Detailed PMIC statistics for the following Tracts:0017.00
2002 - 2018 National Fire Incident Reporting System (NFIRS) incidents
According to the data from the years 2002 - 2018 the average number of fire incidents per year is 7. The highest number of reported fire incidents - 20 took place in 2017, and the least - 0 in 2003. The data has a rising trend.
When looking into fire subcategories, the most incidents belonged to: Outside Fires (43.7%), and Structure Fires (40.5%).
Fire incident types reported to NFIRS in Zip Code 99714


 Nearest zip codes: 99702, 99712, 99705, 99703, 99775, 99737.


 According to the data from the years 2002 - 2018 the average number of fire incidents per year is 7. The highest number of reported fire incidents - 20 took place in 2017, and the least - 0 in 2003. The data has a rising trend.
 When looking into fire subcategories, the most incidents belonged to: Outside Fires (43.7%), and Structure Fires (40.5%).