Bridge Statistics for Cumberland, Rhode Island (RI)
Condition, Traffic, Stress, Structural Evaluation, Project Costs
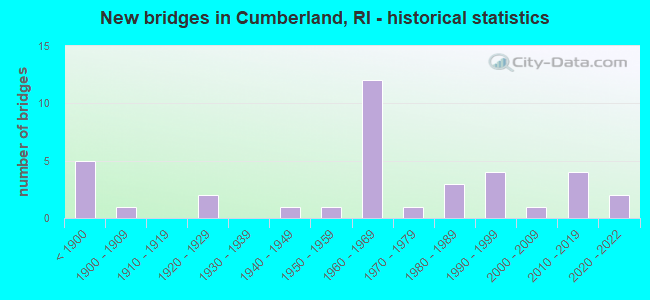
- New bridges - historical statistics
- 5Before 1900
- 11900-1909
- 21920-1929
- 11940-1949
- 11950-1959
- 121960-1969
- 11970-1979
- 31980-1989
- 41990-1999
- 12000-2009
- 42010-2019
- 22020-2022
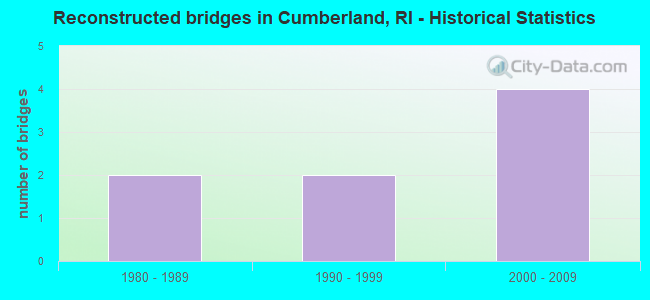
- Reconstructed bridges - Historical Statistics
- 21980-1989
- 21990-1999
- 42000-2009
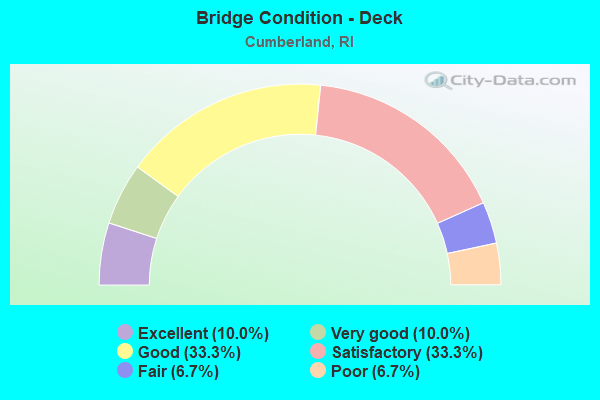
- Bridge Condition - Deck
- 10.0%Excellent
- 10.0%Very good
- 33.3%Good
- 33.3%Satisfactory
- 6.7%Fair
- 6.7%Poor
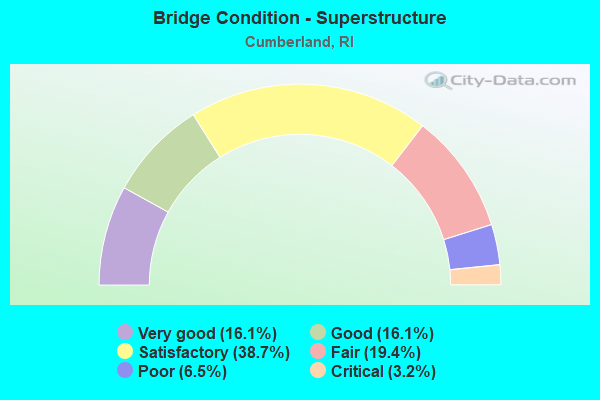
- Bridge Condition - Superstructure
- 16.1%Very good
- 16.1%Good
- 38.7%Satisfactory
- 19.4%Fair
- 6.5%Poor
- 3.2%Critical
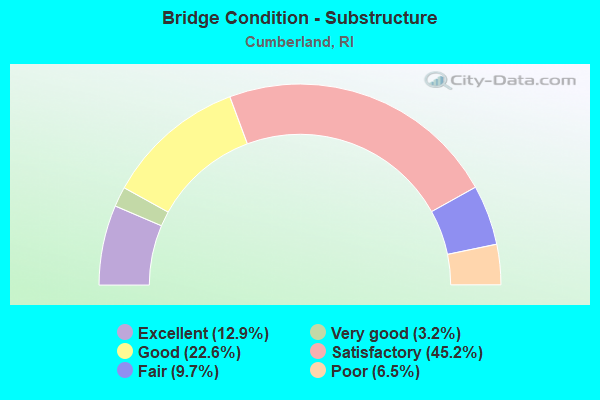
- Bridge Condition - Substructure
- 12.9%Excellent
- 3.2%Very good
- 22.6%Good
- 45.2%Satisfactory
- 9.7%Fair
- 6.5%Poor
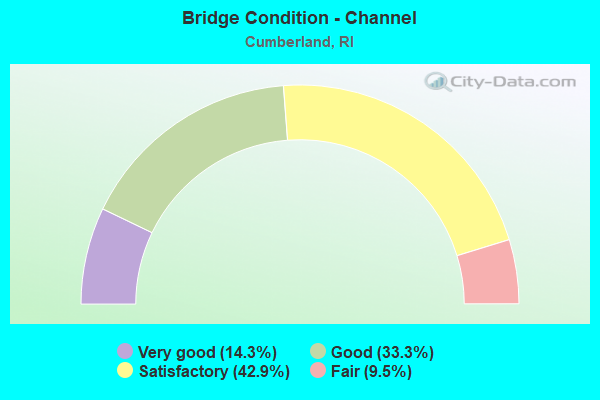
- Bridge Condition - Channel
- 14.3%Very good
- 33.3%Good
- 42.9%Satisfactory
- 9.5%Fair
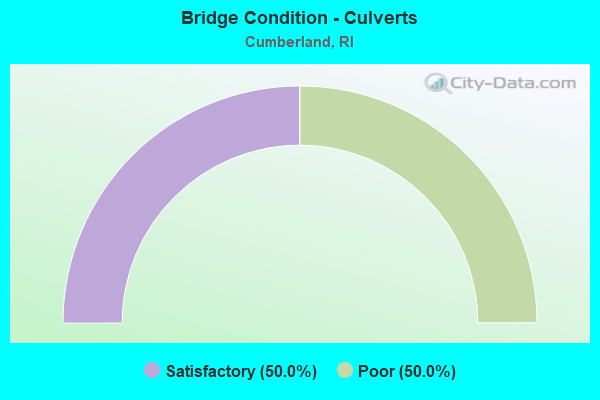
- Bridge Condition - Culverts
- 50.0%Satisfactory
- 50.0%Poor