Bridge Statistics for Dover, New Hampshire (NH)
Condition, Traffic, Stress, Structural Evaluation, Project Costs
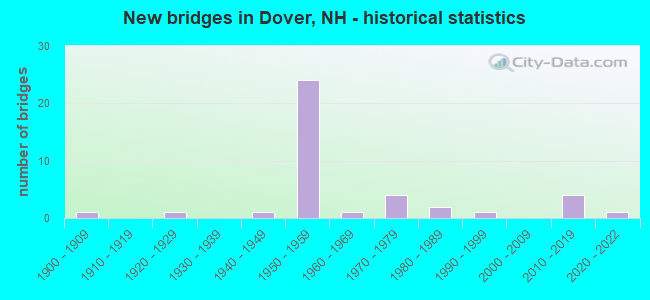
- New bridges - historical statistics
- 11900-1909
- 11920-1929
- 11940-1949
- 241950-1959
- 11960-1969
- 41970-1979
- 21980-1989
- 11990-1999
- 42010-2019
- 12020-2022
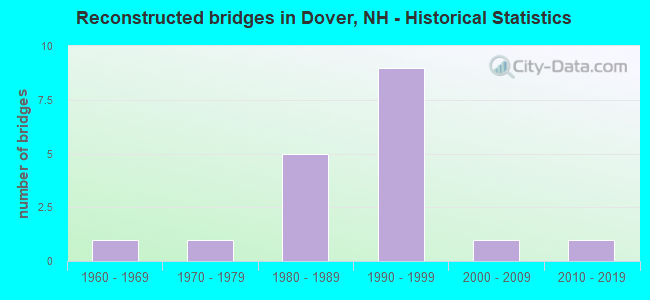
- Reconstructed bridges - Historical Statistics
- 11960-1969
- 11970-1979
- 51980-1989
- 91990-1999
- 12000-2009
- 12010-2019
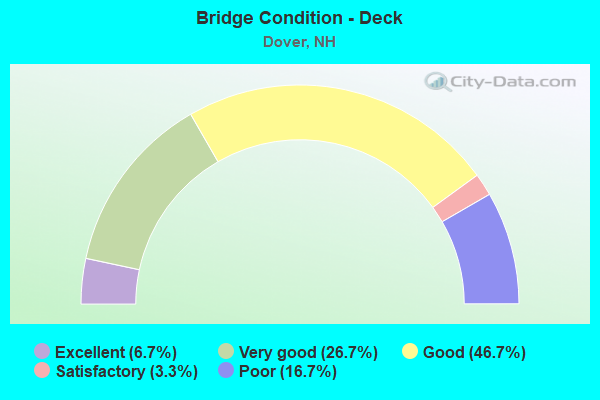
- Bridge Condition - Deck
- 6.7%Excellent
- 26.7%Very good
- 46.7%Good
- 3.3%Satisfactory
- 16.7%Poor
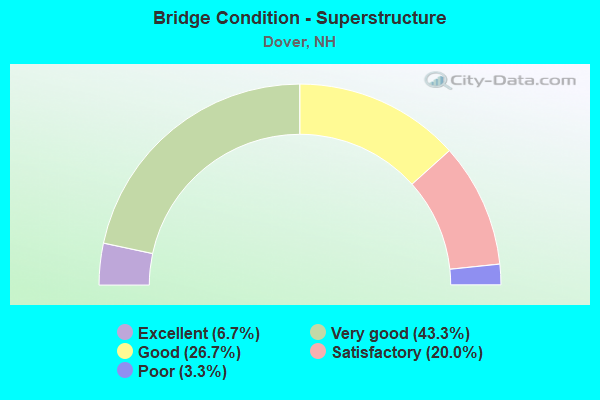
- Bridge Condition - Superstructure
- 6.7%Excellent
- 43.3%Very good
- 26.7%Good
- 20.0%Satisfactory
- 3.3%Poor
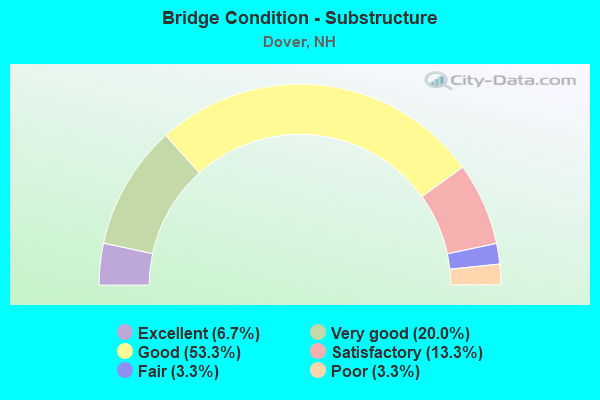
- Bridge Condition - Substructure
- 6.7%Excellent
- 20.0%Very good
- 53.3%Good
- 13.3%Satisfactory
- 3.3%Fair
- 3.3%Poor
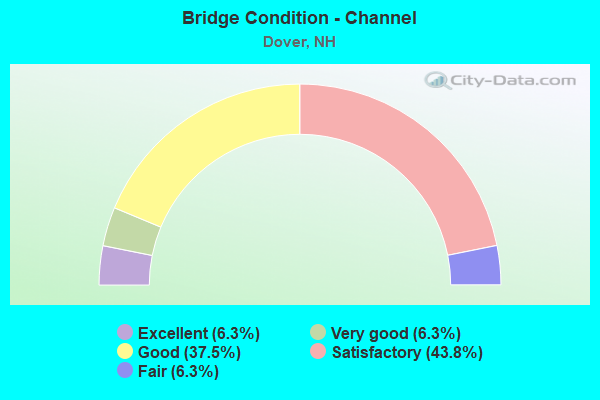
- Bridge Condition - Channel
- 6.3%Excellent
- 6.3%Very good
- 37.5%Good
- 43.8%Satisfactory
- 6.3%Fair