Bridge Statistics for La Salle, Illinois (IL)
Condition, Traffic, Stress, Structural Evaluation, Project Costs
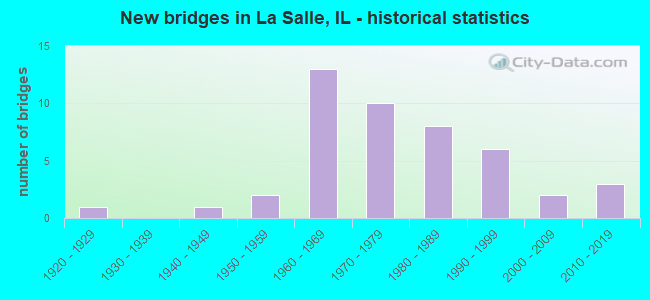
- New bridges - historical statistics
- 11920-1929
- 11940-1949
- 21950-1959
- 131960-1969
- 101970-1979
- 81980-1989
- 61990-1999
- 22000-2009
- 32010-2019
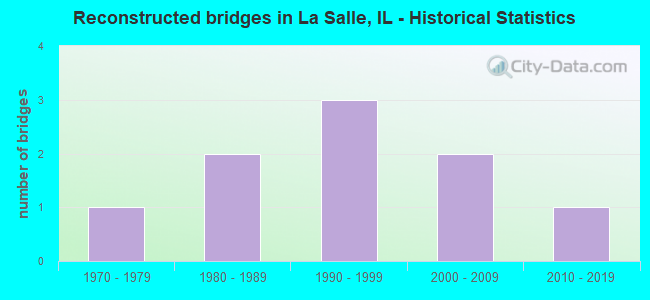
- Reconstructed bridges - Historical Statistics
- 11970-1979
- 21980-1989
- 31990-1999
- 22000-2009
- 12010-2019
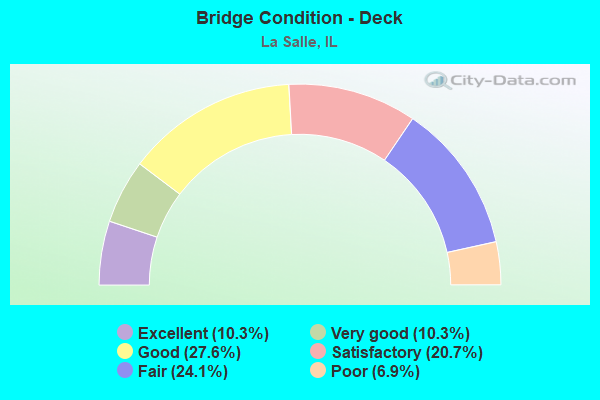
- Bridge Condition - Deck
- 10.3%Excellent
- 10.3%Very good
- 27.6%Good
- 20.7%Satisfactory
- 24.1%Fair
- 6.9%Poor
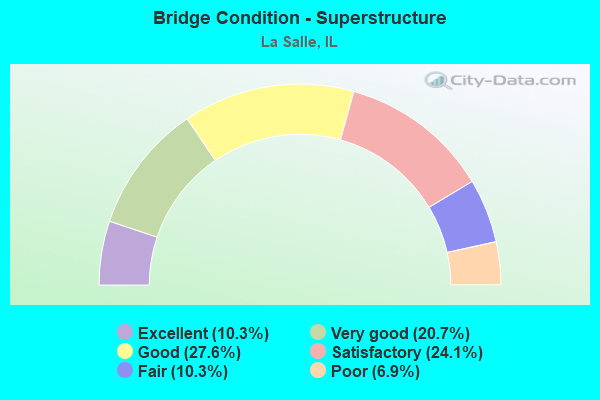
- Bridge Condition - Superstructure
- 10.3%Excellent
- 20.7%Very good
- 27.6%Good
- 24.1%Satisfactory
- 10.3%Fair
- 6.9%Poor
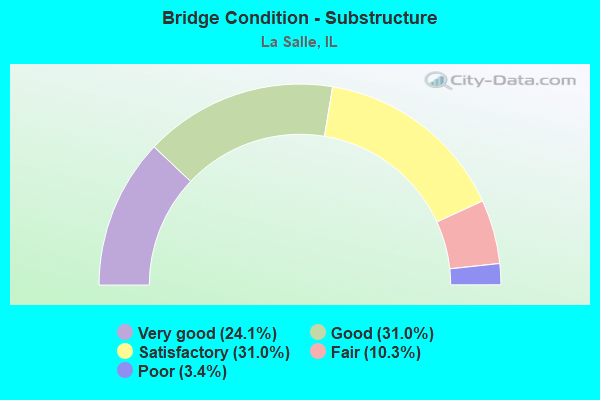
- Bridge Condition - Substructure
- 24.1%Very good
- 31.0%Good
- 31.0%Satisfactory
- 10.3%Fair
- 3.4%Poor
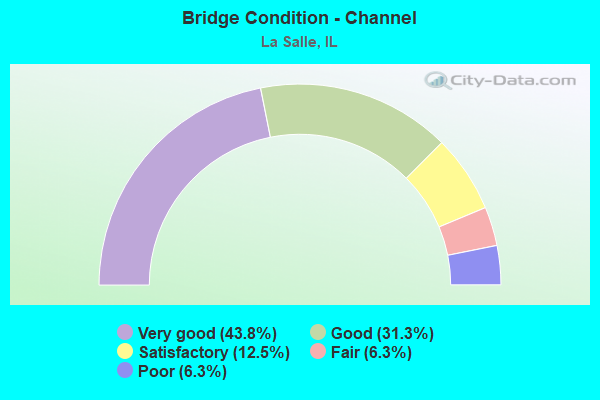
- Bridge Condition - Channel
- 43.8%Very good
- 31.3%Good
- 12.5%Satisfactory
- 6.3%Fair
- 6.3%Poor
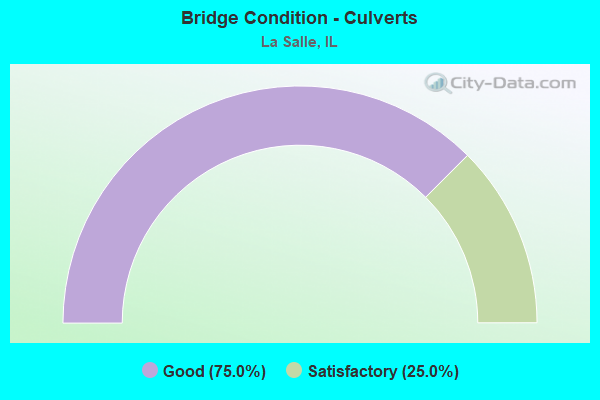
- Bridge Condition - Culverts
- 75.0%Good
- 25.0%Satisfactory