Bridge Statistics for New Castle, Indiana (IN)
Condition, Traffic, Stress, Structural Evaluation, Project Costs
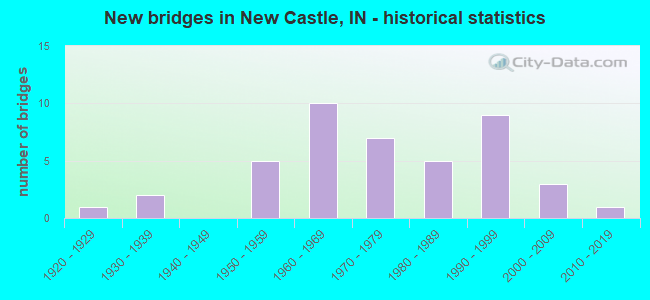
- New bridges - historical statistics
- 11920-1929
- 21930-1939
- 51950-1959
- 101960-1969
- 71970-1979
- 51980-1989
- 91990-1999
- 32000-2009
- 12010-2019
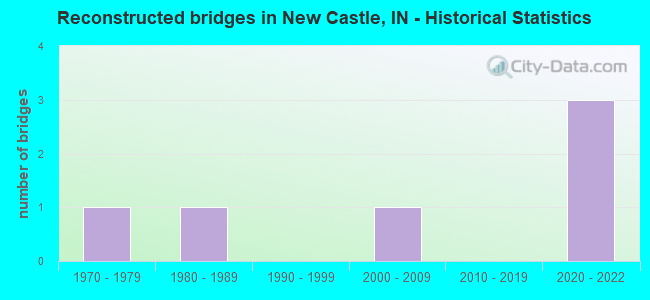
- Reconstructed bridges - Historical Statistics
- 11970-1979
- 11980-1989
- 01990-1999
- 12000-2009
- 02010-2019
- 32020-2022
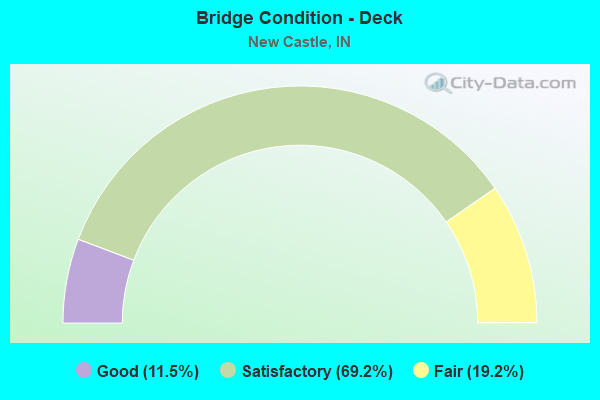
- Bridge Condition - Deck
- 11.5%Good
- 69.2%Satisfactory
- 19.2%Fair
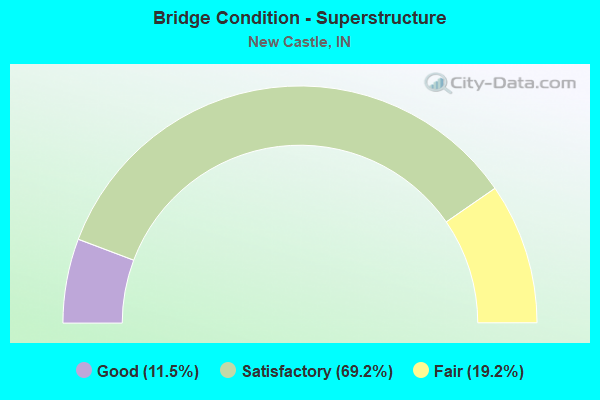
- Bridge Condition - Superstructure
- 11.5%Good
- 69.2%Satisfactory
- 19.2%Fair
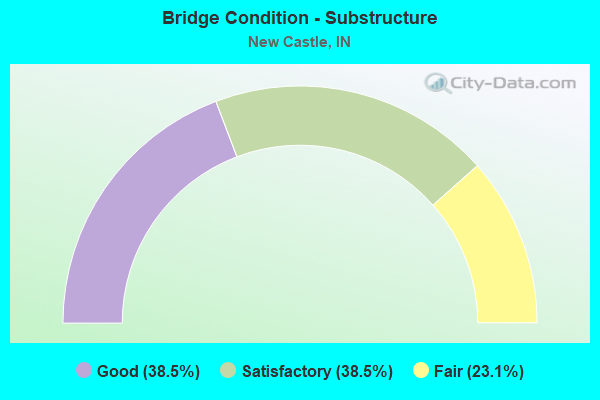
- Bridge Condition - Substructure
- 38.5%Good
- 38.5%Satisfactory
- 23.1%Fair
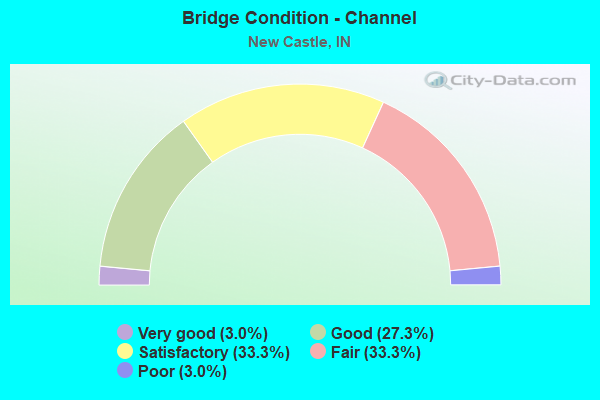
- Bridge Condition - Channel
- 3.0%Very good
- 27.3%Good
- 33.3%Satisfactory
- 33.3%Fair
- 3.0%Poor
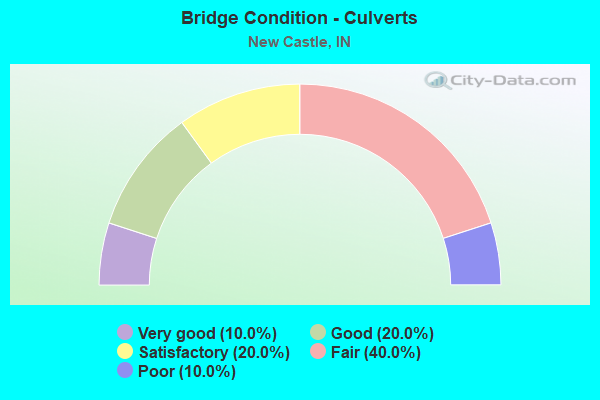
- Bridge Condition - Culverts
- 10.0%Very good
- 20.0%Good
- 20.0%Satisfactory
- 40.0%Fair
- 10.0%Poor