Cape May Court House, New Jersey Submit your own pictures of this place and show them to the world
OSM Map
General Map
Google Map
MSN Map
OSM Map
General Map
Google Map
MSN Map
OSM Map
General Map
Google Map
MSN Map
OSM Map
General Map
Google Map
MSN Map
Please wait while loading the map...
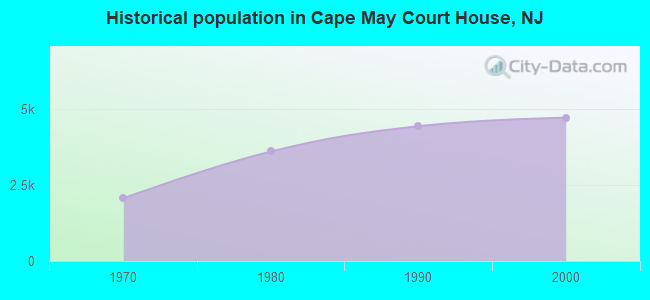
Population in 2010: 5,338. Population change since 2000: +13.5%Males: 2,489 Females: 2,849
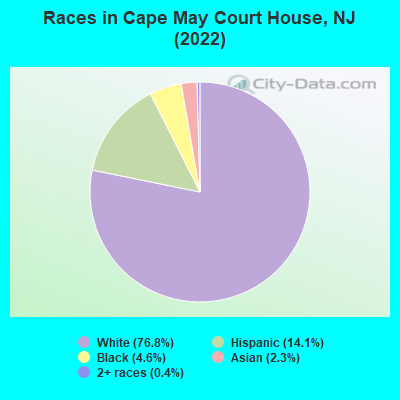
March 2022 cost of living index in Cape May Court House: 103.8 (near average, U.S. average is 100) Percentage of residents living in poverty in 2022: 17.1%for White Non-Hispanic residents , 17.7% for Black residents , 35.5% for Hispanic or Latino residents , 5.0% for other race residents , 72.7% for two or more races residents )
Profiles of local businesses
Business Search - 14 Million verified businesses
Data:
Median household income ($)
Median household income (% change since 2000)
Household income diversity
Ratio of average income to average house value (%)
Ratio of average income to average rent
Median household income ($) - White
Median household income ($) - Black or African American
Median household income ($) - Asian
Median household income ($) - Hispanic or Latino
Median household income ($) - American Indian and Alaska Native
Median household income ($) - Multirace
Median household income ($) - Other Race
Median household income for houses/condos with a mortgage ($)
Median household income for apartments without a mortgage ($)
Races - White alone (%)
Races - White alone (% change since 2000)
Races - Black alone (%)
Races - Black alone (% change since 2000)
Races - American Indian alone (%)
Races - American Indian alone (% change since 2000)
Races - Asian alone (%)
Races - Asian alone (% change since 2000)
Races - Hispanic (%)
Races - Hispanic (% change since 2000)
Races - Native Hawaiian and Other Pacific Islander alone (%)
Races - Native Hawaiian and Other Pacific Islander alone (% change since 2000)
Races - Two or more races (%)
Races - Two or more races (% change since 2000)
Races - Other race alone (%)
Races - Other race alone (% change since 2000)
Racial diversity
Unemployment (%)
Unemployment (% change since 2000)
Unemployment (%) - White
Unemployment (%) - Black or African American
Unemployment (%) - Asian
Unemployment (%) - Hispanic or Latino
Unemployment (%) - American Indian and Alaska Native
Unemployment (%) - Multirace
Unemployment (%) - Other Race
Population density (people per square mile)
Population - Males (%)
Population - Females (%)
Population - Males (%) - White
Population - Males (%) - Black or African American
Population - Males (%) - Asian
Population - Males (%) - Hispanic or Latino
Population - Males (%) - American Indian and Alaska Native
Population - Males (%) - Multirace
Population - Males (%) - Other Race
Population - Females (%) - White
Population - Females (%) - Black or African American
Population - Females (%) - Asian
Population - Females (%) - Hispanic or Latino
Population - Females (%) - American Indian and Alaska Native
Population - Females (%) - Multirace
Population - Females (%) - Other Race
Coronavirus confirmed cases (May 21, 2024)
Deaths caused by coronavirus (May 21, 2024)
Coronavirus confirmed cases (per 100k population) (May 21, 2024)
Deaths caused by coronavirus (per 100k population) (May 21, 2024)
Daily increase in number of cases (May 21, 2024)
Weekly increase in number of cases (May 21, 2024)
Cases doubled (in days) (May 21, 2024)
Hospitalized patients (Apr 18, 2022)
Negative test results (Apr 18, 2022)
Total test results (Apr 18, 2022)
COVID Vaccine doses distributed (per 100k population) (Sep 19, 2023)
COVID Vaccine doses administered (per 100k population) (Sep 19, 2023)
COVID Vaccine doses distributed (Sep 19, 2023)
COVID Vaccine doses administered (Sep 19, 2023)
Likely homosexual households (%)
Likely homosexual households (% change since 2000)
Likely homosexual households - Lesbian couples (%)
Likely homosexual households - Lesbian couples (% change since 2000)
Likely homosexual households - Gay men (%)
Likely homosexual households - Gay men (% change since 2000)
Cost of living index
Median gross rent ($)
Median contract rent ($)
Median monthly housing costs ($)
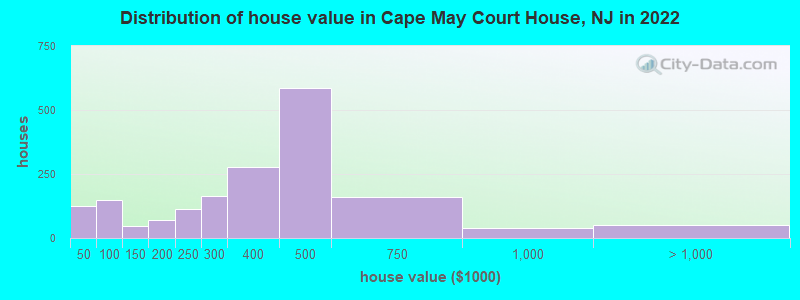
Median house or condo value ($)
Median house or condo value ($ change since 2000)
Mean house or condo value by units in structure - 1, detached ($)
Mean house or condo value by units in structure - 1, attached ($)
Mean house or condo value by units in structure - 2 ($)
Mean house or condo value by units in structure by units in structure - 3 or 4 ($)
Mean house or condo value by units in structure - 5 or more ($)
Mean house or condo value by units in structure - Boat, RV, van, etc. ($)
Mean house or condo value by units in structure - Mobile home ($)
Median house or condo value ($) - White
Median house or condo value ($) - Black or African American
Median house or condo value ($) - Asian
Median house or condo value ($) - Hispanic or Latino
Median house or condo value ($) - American Indian and Alaska Native
Median house or condo value ($) - Multirace
Median house or condo value ($) - Other Race
Median resident age
Resident age diversity
Median resident age - Males
Median resident age - Females
Median resident age - White
Median resident age - Black or African American
Median resident age - Asian
Median resident age - Hispanic or Latino
Median resident age - American Indian and Alaska Native
Median resident age - Multirace
Median resident age - Other Race
Median resident age - Males - White
Median resident age - Males - Black or African American
Median resident age - Males - Asian
Median resident age - Males - Hispanic or Latino
Median resident age - Males - American Indian and Alaska Native
Median resident age - Males - Multirace
Median resident age - Males - Other Race
Median resident age - Females - White
Median resident age - Females - Black or African American
Median resident age - Females - Asian
Median resident age - Females - Hispanic or Latino
Median resident age - Females - American Indian and Alaska Native
Median resident age - Females - Multirace
Median resident age - Females - Other Race
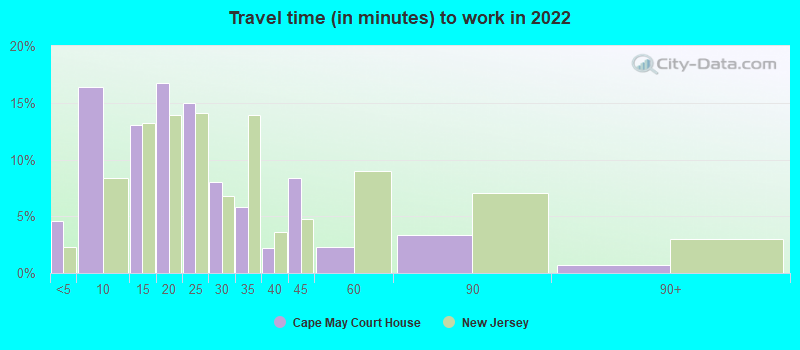
Commute - mean travel time to work (minutes)
Travel time to work - Less than 5 minutes (%)
Travel time to work - Less than 5 minutes (% change since 2000)
Travel time to work - 5 to 9 minutes (%)
Travel time to work - 5 to 9 minutes (% change since 2000)
Travel time to work - 10 to 19 minutes (%)
Travel time to work - 10 to 19 minutes (% change since 2000)
Travel time to work - 20 to 29 minutes (%)
Travel time to work - 20 to 29 minutes (% change since 2000)
Travel time to work - 30 to 39 minutes (%)
Travel time to work - 30 to 39 minutes (% change since 2000)
Travel time to work - 40 to 59 minutes (%)
Travel time to work - 40 to 59 minutes (% change since 2000)
Travel time to work - 60 to 89 minutes (%)
Travel time to work - 60 to 89 minutes (% change since 2000)
Travel time to work - 90 or more minutes (%)
Travel time to work - 90 or more minutes (% change since 2000)
Marital status - Never married (%)
Marital status - Now married (%)
Marital status - Separated (%)
Marital status - Widowed (%)
Marital status - Divorced (%)
Median family income ($)
Median family income (% change since 2000)
Median non-family income ($)
Median non-family income (% change since 2000)
Median per capita income ($)
Median per capita income (% change since 2000)
Median family income ($) - White
Median family income ($) - Black or African American
Median family income ($) - Asian
Median family income ($) - Hispanic or Latino
Median family income ($) - American Indian and Alaska Native
Median family income ($) - Multirace
Median family income ($) - Other Race
Median year house/condo built
Median year apartment built
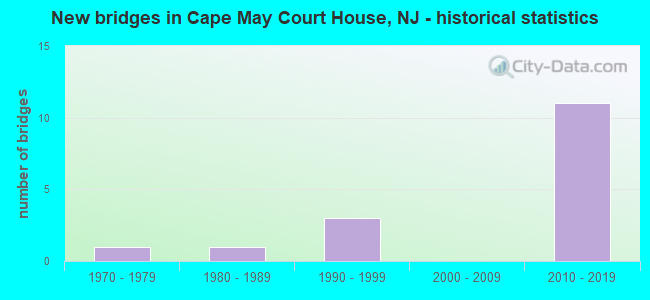
Year house built - Built 2005 or later (%)
Year house built - Built 2000 to 2004 (%)
Year house built - Built 1990 to 1999 (%)
Year house built - Built 1980 to 1989 (%)
Year house built - Built 1970 to 1979 (%)
Year house built - Built 1960 to 1969 (%)
Year house built - Built 1950 to 1959 (%)
Year house built - Built 1940 to 1949 (%)
Year house built - Built 1939 or earlier (%)
Average household size
Household density (households per square mile)
Average household size - White
Average household size - Black or African American
Average household size - Asian
Average household size - Hispanic or Latino
Average household size - American Indian and Alaska Native
Average household size - Multirace
Average household size - Other Race
Occupied housing units (%)
Vacant housing units (%)
Owner occupied housing units (%)
Renter occupied housing units (%)
Vacancy status - For rent (%)
Vacancy status - For sale only (%)
Vacancy status - Rented or sold, not occupied (%)
Vacancy status - For seasonal, recreational, or occasional use (%)
Vacancy status - For migrant workers (%)
Vacancy status - Other vacant (%)
Residents with income below the poverty level (%)
Residents with income below 50% of the poverty level (%)
Children below poverty level (%)
Poor families by family type - Married-couple family (%)
Poor families by family type - Male, no wife present (%)
Poor families by family type - Female, no husband present (%)
Poverty status for native-born residents (%)
Poverty status for foreign-born residents (%)
Poverty among high school graduates not in families (%)
Poverty among people who did not graduate high school not in families (%)
Residents with income below the poverty level (%) - White
Residents with income below the poverty level (%) - Black or African American
Residents with income below the poverty level (%) - Asian
Residents with income below the poverty level (%) - Hispanic or Latino
Residents with income below the poverty level (%) - American Indian and Alaska Native
Residents with income below the poverty level (%) - Multirace
Residents with income below the poverty level (%) - Other Race
Air pollution - Air Quality Index (AQI)
Air pollution - CO
Air pollution - NO2
Air pollution - SO2
Air pollution - Ozone
Air pollution - PM10
Air pollution - PM25
Air pollution - Pb
Crime - Murders per 100,000 population
Crime - Rapes per 100,000 population
Crime - Robberies per 100,000 population
Crime - Assaults per 100,000 population
Crime - Burglaries per 100,000 population
Crime - Thefts per 100,000 population
Crime - Auto thefts per 100,000 population
Crime - Arson per 100,000 population
Crime - City-data.com crime index
Crime - Violent crime index
Crime - Property crime index
Crime - Murders per 100,000 population (5 year average)
Crime - Rapes per 100,000 population (5 year average)
Crime - Robberies per 100,000 population (5 year average)
Crime - Assaults per 100,000 population (5 year average)
Crime - Burglaries per 100,000 population (5 year average)
Crime - Thefts per 100,000 population (5 year average)
Crime - Auto thefts per 100,000 population (5 year average)
Crime - Arson per 100,000 population (5 year average)
Crime - City-data.com crime index (5 year average)
Crime - Violent crime index (5 year average)
Crime - Property crime index (5 year average)
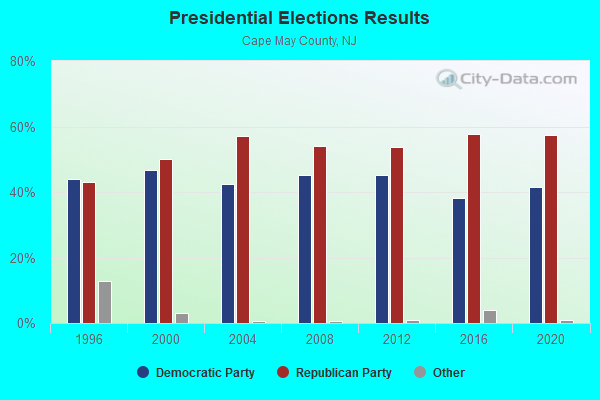
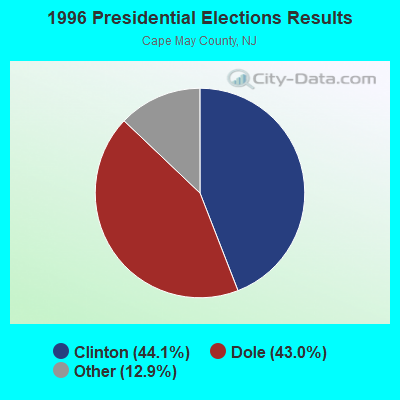
1996 Presidential Elections Results (%) - Democratic Party (Clinton)
1996 Presidential Elections Results (%) - Republican Party (Dole)
1996 Presidential Elections Results (%) - Other
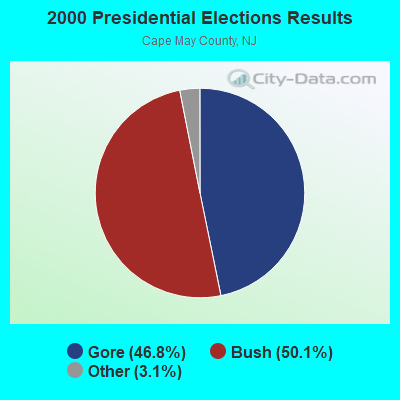
2000 Presidential Elections Results (%) - Democratic Party (Gore)
2000 Presidential Elections Results (%) - Republican Party (Bush)
2000 Presidential Elections Results (%) - Other
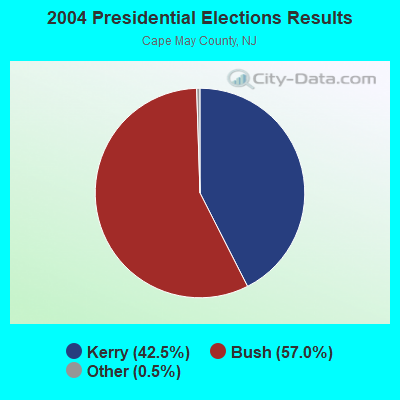
2004 Presidential Elections Results (%) - Democratic Party (Kerry)
2004 Presidential Elections Results (%) - Republican Party (Bush)
2004 Presidential Elections Results (%) - Other
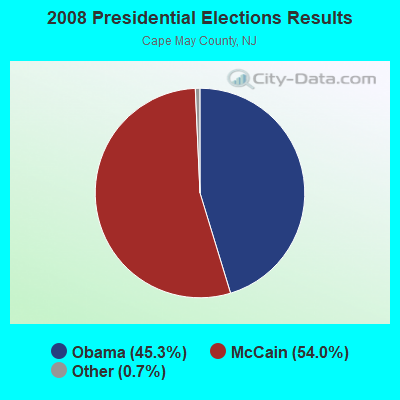
2008 Presidential Elections Results (%) - Democratic Party (Obama)
2008 Presidential Elections Results (%) - Republican Party (McCain)
2008 Presidential Elections Results (%) - Other
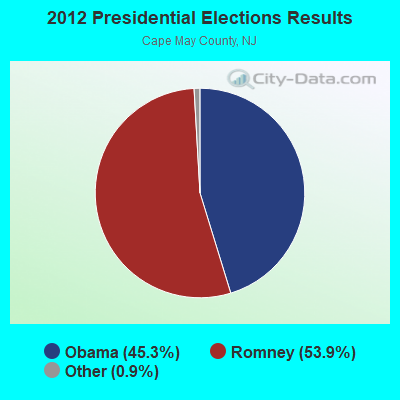
2012 Presidential Elections Results (%) - Democratic Party (Obama)
2012 Presidential Elections Results (%) - Republican Party (Romney)
2012 Presidential Elections Results (%) - Other
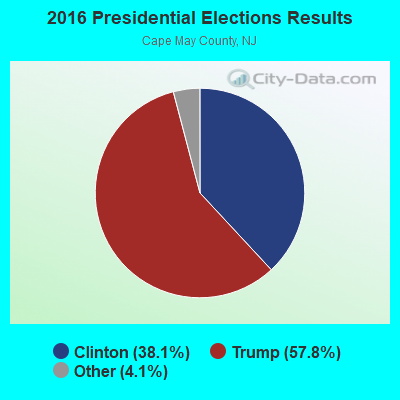
2016 Presidential Elections Results (%) - Democratic Party (Clinton)
2016 Presidential Elections Results (%) - Republican Party (Trump)
2016 Presidential Elections Results (%) - Other
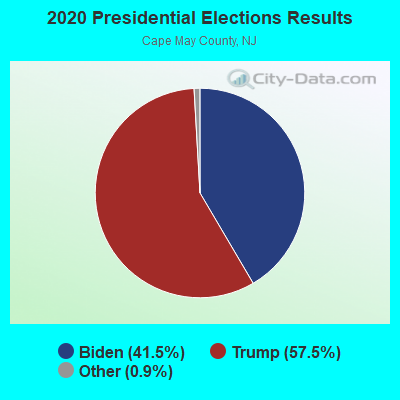
2020 Presidential Elections Results (%) - Democratic Party (Biden)
2020 Presidential Elections Results (%) - Republican Party (Trump)
2020 Presidential Elections Results (%) - Other
Ancestries Reported - Arab (%)
Ancestries Reported - Czech (%)
Ancestries Reported - Danish (%)
Ancestries Reported - Dutch (%)
Ancestries Reported - English (%)
Ancestries Reported - French (%)
Ancestries Reported - French Canadian (%)
Ancestries Reported - German (%)
Ancestries Reported - Greek (%)
Ancestries Reported - Hungarian (%)
Ancestries Reported - Irish (%)
Ancestries Reported - Italian (%)
Ancestries Reported - Lithuanian (%)
Ancestries Reported - Norwegian (%)
Ancestries Reported - Polish (%)
Ancestries Reported - Portuguese (%)
Ancestries Reported - Russian (%)
Ancestries Reported - Scotch-Irish (%)
Ancestries Reported - Scottish (%)
Ancestries Reported - Slovak (%)
Ancestries Reported - Subsaharan African (%)
Ancestries Reported - Swedish (%)
Ancestries Reported - Swiss (%)
Ancestries Reported - Ukrainian (%)
Ancestries Reported - United States (%)
Ancestries Reported - Welsh (%)
Ancestries Reported - West Indian (%)
Ancestries Reported - Other (%)
Educational Attainment - No schooling completed (%)
Educational Attainment - Less than high school (%)
Educational Attainment - High school or equivalent (%)
Educational Attainment - Less than 1 year of college (%)
Educational Attainment - 1 or more years of college (%)
Educational Attainment - Associate degree (%)
Educational Attainment - Bachelor's degree (%)
Educational Attainment - Master's degree (%)
Educational Attainment - Professional school degree (%)
Educational Attainment - Doctorate degree (%)
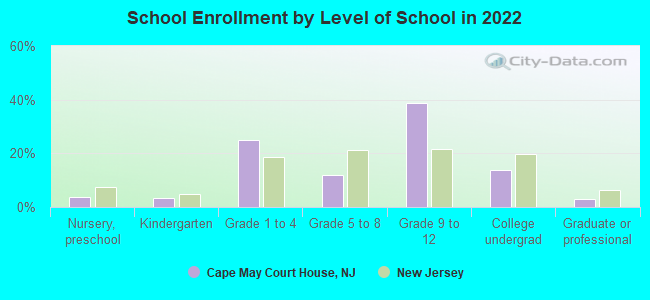
School Enrollment - Nursery, preschool (%)
School Enrollment - Kindergarten (%)
School Enrollment - Grade 1 to 4 (%)
School Enrollment - Grade 5 to 8 (%)
School Enrollment - Grade 9 to 12 (%)
School Enrollment - College undergrad (%)
School Enrollment - Graduate or professional (%)
School Enrollment - Not enrolled in school (%)
School enrollment - Public schools (%)
School enrollment - Private schools (%)
School enrollment - Not enrolled (%)
Median number of rooms in houses and condos
Median number of rooms in apartments
Housing units lacking complete plumbing facilities (%)
Housing units lacking complete kitchen facilities (%)
Density of houses
Urban houses (%)
Rural houses (%)
Households with people 60 years and over (%)
Households with people 65 years and over (%)
Households with people 75 years and over (%)
Households with one or more nonrelatives (%)
Households with no nonrelatives (%)
Population in households (%)
Family households (%)
Nonfamily households (%)
Population in families (%)
Family households with own children (%)
Median number of bedrooms in owner occupied houses
Mean number of bedrooms in owner occupied houses
Median number of bedrooms in renter occupied houses
Mean number of bedrooms in renter occupied houses
Median number of vehichles in owner occupied houses
Mean number of vehichles in owner occupied houses
Median number of vehichles in renter occupied houses
Mean number of vehichles in renter occupied houses
Mortgage status - with mortgage (%)
Mortgage status - with second mortgage (%)
Mortgage status - with home equity loan (%)
Mortgage status - with both second mortgage and home equity loan (%)
Mortgage status - without a mortgage (%)
Average family size
Average family size - White
Average family size - Black or African American
Average family size - Asian
Average family size - Hispanic or Latino
Average family size - American Indian and Alaska Native
Average family size - Multirace
Average family size - Other Race
Geographical mobility - Same house 1 year ago (%)
Geographical mobility - Moved within same county (%)
Geographical mobility - Moved from different county within same state (%)
Geographical mobility - Moved from different state (%)
Geographical mobility - Moved from abroad (%)
Place of birth - Born in state of residence (%)
Place of birth - Born in other state (%)
Place of birth - Native, outside of US (%)
Place of birth - Foreign born (%)
Housing units in structures - 1, detached (%)
Housing units in structures - 1, attached (%)
Housing units in structures - 2 (%)
Housing units in structures - 3 or 4 (%)
Housing units in structures - 5 to 9 (%)
Housing units in structures - 10 to 19 (%)
Housing units in structures - 20 to 49 (%)
Housing units in structures - 50 or more (%)
Housing units in structures - Mobile home (%)
Housing units in structures - Boat, RV, van, etc. (%)
House/condo owner moved in on average (years ago)
Renter moved in on average (years ago)
Year householder moved into unit - Moved in 1999 to March 2000 (%)
Year householder moved into unit - Moved in 1995 to 1998 (%)
Year householder moved into unit - Moved in 1990 to 1994 (%)
Year householder moved into unit - Moved in 1980 to 1989 (%)
Year householder moved into unit - Moved in 1970 to 1979 (%)
Year householder moved into unit - Moved in 1969 or earlier (%)
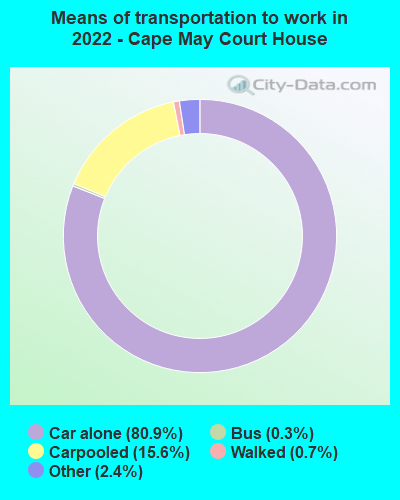
Means of transportation to work - Drove car alone (%)
Means of transportation to work - Carpooled (%)
Means of transportation to work - Public transportation (%)
Means of transportation to work - Bus or trolley bus (%)
Means of transportation to work - Streetcar or trolley car (%)
Means of transportation to work - Subway or elevated (%)
Means of transportation to work - Railroad (%)
Means of transportation to work - Ferryboat (%)
Means of transportation to work - Taxicab (%)
Means of transportation to work - Motorcycle (%)
Means of transportation to work - Bicycle (%)
Means of transportation to work - Walked (%)
Means of transportation to work - Other means (%)
Working at home (%)
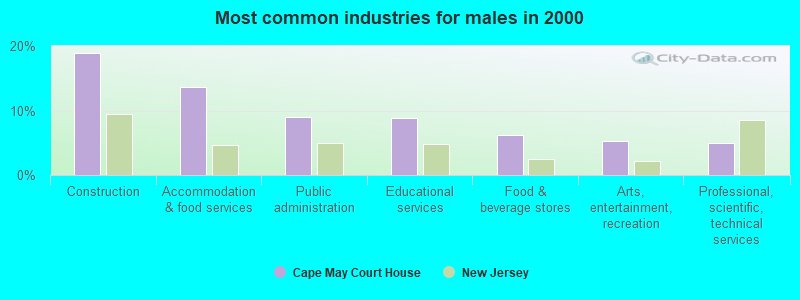
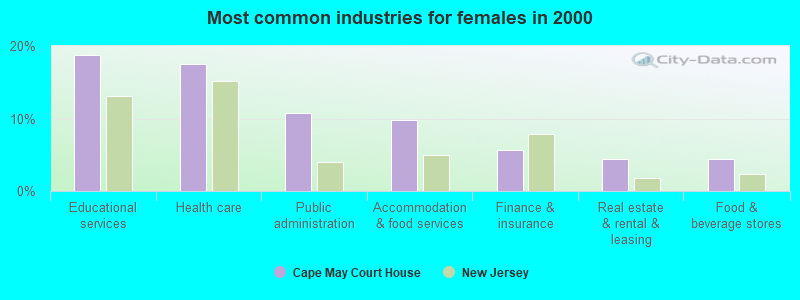
Industry diversity
Most Common Industries - Agriculture, forestry, fishing and hunting, and mining (%)
Most Common Industries - Agriculture, forestry, fishing and hunting (%)
Most Common Industries - Mining, quarrying, and oil and gas extraction (%)
Most Common Industries - Construction (%)
Most Common Industries - Manufacturing (%)
Most Common Industries - Wholesale trade (%)
Most Common Industries - Retail trade (%)
Most Common Industries - Transportation and warehousing, and utilities (%)
Most Common Industries - Transportation and warehousing (%)
Most Common Industries - Utilities (%)
Most Common Industries - Information (%)
Most Common Industries - Finance and insurance, and real estate and rental and leasing (%)
Most Common Industries - Finance and insurance (%)
Most Common Industries - Real estate and rental and leasing (%)
Most Common Industries - Professional, scientific, and management, and administrative and waste management services (%)
Most Common Industries - Professional, scientific, and technical services (%)
Most Common Industries - Management of companies and enterprises (%)
Most Common Industries - Administrative and support and waste management services (%)
Most Common Industries - Educational services, and health care and social assistance (%)
Most Common Industries - Educational services (%)
Most Common Industries - Health care and social assistance (%)
Most Common Industries - Arts, entertainment, and recreation, and accommodation and food services (%)
Most Common Industries - Arts, entertainment, and recreation (%)
Most Common Industries - Accommodation and food services (%)
Most Common Industries - Other services, except public administration (%)
Most Common Industries - Public administration (%)
Occupation diversity
Most Common Occupations - Management, business, science, and arts occupations (%)
Most Common Occupations - Management, business, and financial occupations (%)
Most Common Occupations - Management occupations (%)
Most Common Occupations - Business and financial operations occupations (%)
Most Common Occupations - Computer, engineering, and science occupations (%)
Most Common Occupations - Computer and mathematical occupations (%)
Most Common Occupations - Architecture and engineering occupations (%)
Most Common Occupations - Life, physical, and social science occupations (%)
Most Common Occupations - Education, legal, community service, arts, and media occupations (%)
Most Common Occupations - Community and social service occupations (%)
Most Common Occupations - Legal occupations (%)
Most Common Occupations - Education, training, and library occupations (%)
Most Common Occupations - Arts, design, entertainment, sports, and media occupations (%)
Most Common Occupations - Healthcare practitioners and technical occupations (%)
Most Common Occupations - Health diagnosing and treating practitioners and other technical occupations (%)
Most Common Occupations - Health technologists and technicians (%)
Most Common Occupations - Service occupations (%)
Most Common Occupations - Healthcare support occupations (%)
Most Common Occupations - Protective service occupations (%)
Most Common Occupations - Fire fighting and prevention, and other protective service workers including supervisors (%)
Most Common Occupations - Law enforcement workers including supervisors (%)
Most Common Occupations - Food preparation and serving related occupations (%)
Most Common Occupations - Building and grounds cleaning and maintenance occupations (%)
Most Common Occupations - Personal care and service occupations (%)
Most Common Occupations - Sales and office occupations (%)
Most Common Occupations - Sales and related occupations (%)
Most Common Occupations - Office and administrative support occupations (%)
Most Common Occupations - Natural resources, construction, and maintenance occupations (%)
Most Common Occupations - Farming, fishing, and forestry occupations (%)
Most Common Occupations - Construction and extraction occupations (%)
Most Common Occupations - Installation, maintenance, and repair occupations (%)
Most Common Occupations - Production, transportation, and material moving occupations (%)
Most Common Occupations - Production occupations (%)
Most Common Occupations - Transportation occupations (%)
Most Common Occupations - Material moving occupations (%)
People in Group quarters - Institutionalized population (%)
People in Group quarters - Correctional institutions (%)
People in Group quarters - Federal prisons and detention centers (%)
People in Group quarters - Halfway houses (%)
People in Group quarters - Local jails and other confinement facilities (including police lockups) (%)
People in Group quarters - Military disciplinary barracks (%)
People in Group quarters - State prisons (%)
People in Group quarters - Other types of correctional institutions (%)
People in Group quarters - Nursing homes (%)
People in Group quarters - Hospitals/wards, hospices, and schools for the handicapped (%)
People in Group quarters - Hospitals/wards and hospices for chronically ill (%)
People in Group quarters - Hospices or homes for chronically ill (%)
People in Group quarters - Military hospitals or wards for chronically ill (%)
People in Group quarters - Other hospitals or wards for chronically ill (%)
People in Group quarters - Hospitals or wards for drug/alcohol abuse (%)
People in Group quarters - Mental (Psychiatric) hospitals or wards (%)
People in Group quarters - Schools, hospitals, or wards for the mentally retarded (%)
People in Group quarters - Schools, hospitals, or wards for the physically handicapped (%)
People in Group quarters - Institutions for the deaf (%)
People in Group quarters - Institutions for the blind (%)
People in Group quarters - Orthopedic wards and institutions for the physically handicapped (%)
People in Group quarters - Wards in general hospitals for patients who have no usual home elsewhere (%)
People in Group quarters - Wards in military hospitals for patients who have no usual home elsewhere (%)
People in Group quarters - Juvenile institutions (%)
People in Group quarters - Long-term care (%)
People in Group quarters - Homes for abused, dependent, and neglected children (%)
People in Group quarters - Residential treatment centers for emotionally disturbed children (%)
People in Group quarters - Training schools for juvenile delinquents (%)
People in Group quarters - Short-term care, detention or diagnostic centers for delinquent children (%)
People in Group quarters - Type of juvenile institution unknown (%)
People in Group quarters - Noninstitutionalized population (%)
People in Group quarters - College dormitories (includes college quarters off campus) (%)
People in Group quarters - Military quarters (%)
People in Group quarters - On base (%)
People in Group quarters - Barracks, unaccompanied personnel housing (UPH), (Enlisted/Officer), ;and similar group living quarters for military personnel (%)
People in Group quarters - Transient quarters for temporary residents (%)
People in Group quarters - Military ships (%)
People in Group quarters - Group homes (%)
People in Group quarters - Homes or halfway houses for drug/alcohol abuse (%)
People in Group quarters - Homes for the mentally ill (%)
People in Group quarters - Homes for the mentally retarded (%)
People in Group quarters - Homes for the physically handicapped (%)
People in Group quarters - Other group homes (%)
People in Group quarters - Religious group quarters (%)
People in Group quarters - Dormitories (%)
People in Group quarters - Agriculture workers' dormitories on farms (%)
People in Group quarters - Job Corps and vocational training facilities (%)
People in Group quarters - Other workers' dormitories (%)
People in Group quarters - Crews of maritime vessels (%)
People in Group quarters - Other nonhousehold living situations (%)
People in Group quarters - Other noninstitutional group quarters (%)
Residents speaking English at home (%)
Residents speaking English at home - Born in the United States (%)
Residents speaking English at home - Native, born elsewhere (%)
Residents speaking English at home - Foreign born (%)
Residents speaking Spanish at home (%)
Residents speaking Spanish at home - Born in the United States (%)
Residents speaking Spanish at home - Native, born elsewhere (%)
Residents speaking Spanish at home - Foreign born (%)
Residents speaking other language at home (%)
Residents speaking other language at home - Born in the United States (%)
Residents speaking other language at home - Native, born elsewhere (%)
Residents speaking other language at home - Foreign born (%)
Class of Workers - Employee of private company (%)
Class of Workers - Self-employed in own incorporated business (%)
Class of Workers - Private not-for-profit wage and salary workers (%)
Class of Workers - Local government workers (%)
Class of Workers - State government workers (%)
Class of Workers - Federal government workers (%)
Class of Workers - Self-employed workers in own not incorporated business and Unpaid family workers (%)
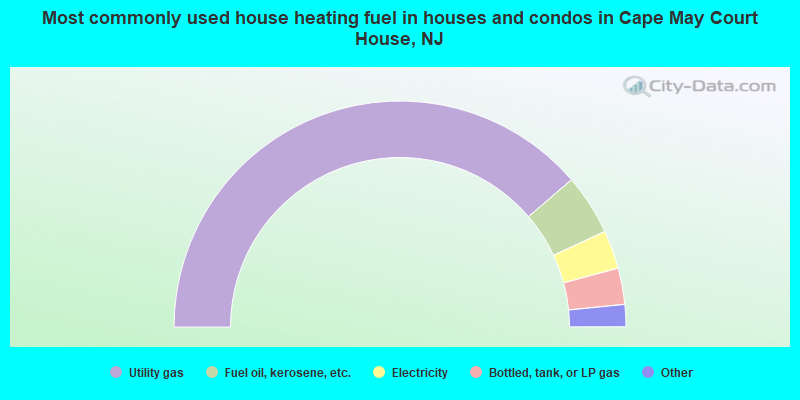
House heating fuel used in houses and condos - Utility gas (%)
House heating fuel used in houses and condos - Bottled, tank, or LP gas (%)
House heating fuel used in houses and condos - Electricity (%)
House heating fuel used in houses and condos - Fuel oil, kerosene, etc. (%)
House heating fuel used in houses and condos - Coal or coke (%)
House heating fuel used in houses and condos - Wood (%)
House heating fuel used in houses and condos - Solar energy (%)
House heating fuel used in houses and condos - Other fuel (%)
House heating fuel used in houses and condos - No fuel used (%)
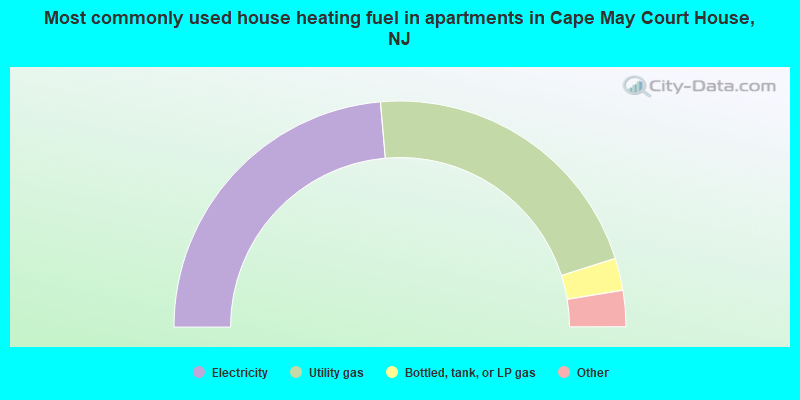
House heating fuel used in apartments - Utility gas (%)
House heating fuel used in apartments - Bottled, tank, or LP gas (%)
House heating fuel used in apartments - Electricity (%)
House heating fuel used in apartments - Fuel oil, kerosene, etc. (%)
House heating fuel used in apartments - Coal or coke (%)
House heating fuel used in apartments - Wood (%)
House heating fuel used in apartments - Solar energy (%)
House heating fuel used in apartments - Other fuel (%)
House heating fuel used in apartments - No fuel used (%)
Armed forces status - In Armed Forces (%)
Armed forces status - Civilian (%)
Armed forces status - Civilian - Veteran (%)
Armed forces status - Civilian - Nonveteran (%)
Fatal accidents locations in years 2005-2021
Fatal accidents locations in 2005
Fatal accidents locations in 2006
Fatal accidents locations in 2007
Fatal accidents locations in 2008
Fatal accidents locations in 2009
Fatal accidents locations in 2010
Fatal accidents locations in 2011
Fatal accidents locations in 2012
Fatal accidents locations in 2013
Fatal accidents locations in 2014
Fatal accidents locations in 2015
Fatal accidents locations in 2016
Fatal accidents locations in 2017
Fatal accidents locations in 2018
Fatal accidents locations in 2019
Fatal accidents locations in 2020
Fatal accidents locations in 2021
Alcohol use - People drinking some alcohol every month (%)
Alcohol use - People not drinking at all (%)
Alcohol use - Average days/month drinking alcohol
Alcohol use - Average drinks/week
Alcohol use - Average days/year people drink much
Audiometry - Average condition of hearing (%)
Audiometry - People that can hear a whisper from across a quiet room (%)
Audiometry - People that can hear normal voice from across a quiet room (%)
Audiometry - Ears ringing, roaring, buzzing (%)
Audiometry - Had a job exposure to loud noise (%)
Audiometry - Had off-work exposure to loud noise (%)
Blood Pressure & Cholesterol - Has high blood pressure (%)
Blood Pressure & Cholesterol - Checking blood pressure at home (%)
Blood Pressure & Cholesterol - Frequently checking blood cholesterol (%)
Blood Pressure & Cholesterol - Has high cholesterol level (%)
Consumer Behavior - Money monthly spent on food at supermarket/grocery store
Consumer Behavior - Money monthly spent on food at other stores
Consumer Behavior - Money monthly spent on eating out
Consumer Behavior - Money monthly spent on carryout/delivered foods
Consumer Behavior - Income spent on food at supermarket/grocery store (%)
Consumer Behavior - Income spent on food at other stores (%)
Consumer Behavior - Income spent on eating out (%)
Consumer Behavior - Income spent on carryout/delivered foods (%)
Current Health Status - General health condition (%)
Current Health Status - Blood donors (%)
Current Health Status - Has blood ever tested for HIV virus (%)
Current Health Status - Left-handed people (%)
Dermatology - People using sunscreen (%)
Diabetes - Diabetics (%)
Diabetes - Had a blood test for high blood sugar (%)
Diabetes - People taking insulin (%)
Diet Behavior & Nutrition - Diet health (%)
Diet Behavior & Nutrition - Milk product consumption (# of products/month)
Diet Behavior & Nutrition - Meals not home prepared (#/week)
Diet Behavior & Nutrition - Meals from fast food or pizza place (#/week)
Diet Behavior & Nutrition - Ready-to-eat foods (#/month)
Diet Behavior & Nutrition - Frozen meals/pizza (#/month)
Drug Use - People that ever used marijuana or hashish (%)
Drug Use - Ever used hard drugs (%)
Drug Use - Ever used any form of cocaine (%)
Drug Use - Ever used heroin (%)
Drug Use - Ever used methamphetamine (%)
Health Insurance - People covered by health insurance (%)
Kidney Conditions-Urology - Avg. # of times urinating at night
Medical Conditions - People with asthma (%)
Medical Conditions - People with anemia (%)
Medical Conditions - People with psoriasis (%)
Medical Conditions - People with overweight (%)
Medical Conditions - Elderly people having difficulties in thinking or remembering (%)
Medical Conditions - People who ever received blood transfusion (%)
Medical Conditions - People having trouble seeing even with glass/contacts (%)
Medical Conditions - People with arthritis (%)
Medical Conditions - People with gout (%)
Medical Conditions - People with congestive heart failure (%)
Medical Conditions - People with coronary heart disease (%)
Medical Conditions - People with angina pectoris (%)
Medical Conditions - People who ever had heart attack (%)
Medical Conditions - People who ever had stroke (%)
Medical Conditions - People with emphysema (%)
Medical Conditions - People with thyroid problem (%)
Medical Conditions - People with chronic bronchitis (%)
Medical Conditions - People with any liver condition (%)
Medical Conditions - People who ever had cancer or malignancy (%)
Mental Health - People who have little interest in doing things (%)
Mental Health - People feeling down, depressed, or hopeless (%)
Mental Health - People who have trouble sleeping or sleeping too much (%)
Mental Health - People feeling tired or having little energy (%)
Mental Health - People with poor appetite or overeating (%)
Mental Health - People feeling bad about themself (%)
Mental Health - People who have trouble concentrating on things (%)
Mental Health - People moving or speaking slowly or too fast (%)
Mental Health - People having thoughts they would be better off dead (%)
Oral Health - Average years since last visit a dentist
Oral Health - People embarrassed because of mouth (%)
Oral Health - People with gum disease (%)
Oral Health - General health of teeth and gums (%)
Oral Health - Average days a week using dental floss/device
Oral Health - Average days a week using mouthwash for dental problem
Oral Health - Average number of teeth
Pesticide Use - Households using pesticides to control insects (%)
Pesticide Use - Households using pesticides to kill weeds (%)
Physical Activity - People doing vigorous-intensity work activities (%)
Physical Activity - People doing moderate-intensity work activities (%)
Physical Activity - People walking or bicycling (%)
Physical Activity - People doing vigorous-intensity recreational activities (%)
Physical Activity - People doing moderate-intensity recreational activities (%)
Physical Activity - Average hours a day doing sedentary activities
Physical Activity - Average hours a day watching TV or videos
Physical Activity - Average hours a day using computer
Physical Functioning - People having limitations keeping them from working (%)
Physical Functioning - People limited in amount of work they can do (%)
Physical Functioning - People that need special equipment to walk (%)
Physical Functioning - People experiencing confusion/memory problems (%)
Physical Functioning - People requiring special healthcare equipment (%)
Prescription Medications - Average number of prescription medicines taking
Preventive Aspirin Use - Adults 40+ taking low-dose aspirin (%)
Reproductive Health - Vaginal deliveries (%)
Reproductive Health - Cesarean deliveries (%)
Reproductive Health - Deliveries resulted in a live birth (%)
Reproductive Health - Pregnancies resulted in a delivery (%)
Reproductive Health - Women breastfeeding newborns (%)
Reproductive Health - Women that had a hysterectomy (%)
Reproductive Health - Women that had both ovaries removed (%)
Reproductive Health - Women that have ever taken birth control pills (%)
Reproductive Health - Women taking birth control pills (%)
Reproductive Health - Women that have ever used Depo-Provera or injectables (%)
Reproductive Health - Women that have ever used female hormones (%)
Sexual Behavior - People 18+ that ever had sex (vaginal, anal, or oral) (%)
Sexual Behavior - Males 18+ that ever had vaginal sex with a woman (%)
Sexual Behavior - Males 18+ that ever performed oral sex on a woman (%)
Sexual Behavior - Males 18+ that ever had anal sex with a woman (%)
Sexual Behavior - Males 18+ that ever had any sex with a man (%)
Sexual Behavior - Females 18+ that ever had vaginal sex with a man (%)
Sexual Behavior - Females 18+ that ever performed oral sex on a man (%)
Sexual Behavior - Females 18+ that ever had anal sex with a man (%)
Sexual Behavior - Females 18+ that ever had any kind of sex with a woman (%)
Sexual Behavior - Average age people first had sex
Sexual Behavior - Average number of female sex partners in lifetime (males 18+)
Sexual Behavior - Average number of female vaginal sex partners in lifetime (males 18+)
Sexual Behavior - Average age people first performed oral sex on a woman (18+)
Sexual Behavior - Average number of woman performed oral sex on in lifetime (18+)
Sexual Behavior - Average number of male sex partners in lifetime (males 18+)
Sexual Behavior - Average number of male anal sex partners in lifetime (males 18+)
Sexual Behavior - Average age people first performed oral sex on a man (18+)
Sexual Behavior - Average number of male oral sex partners in lifetime (18+)
Sexual Behavior - People using protection when performing oral sex (%)
Sexual Behavior - Average number of times people have vaginal or anal sex a year
Sexual Behavior - People having sex without condom (%)
Sexual Behavior - Average number of male sex partners in lifetime (females 18+)
Sexual Behavior - Average number of male vaginal sex partners in lifetime (females 18+)
Sexual Behavior - Average number of female sex partners in lifetime (females 18+)
Sexual Behavior - Circumcised males 18+ (%)
Sleep Disorders - Average hours sleeping at night
Sleep Disorders - People that has trouble sleeping (%)
Smoking-Cigarette Use - People smoking cigarettes (%)
Taste & Smell - People 40+ having problems with smell (%)
Taste & Smell - People 40+ having problems with taste (%)
Taste & Smell - People 40+ that ever had wisdom teeth removed (%)
Taste & Smell - People 40+ that ever had tonsils teeth removed (%)
Taste & Smell - People 40+ that ever had a loss of consciousness because of a head injury (%)
Taste & Smell - People 40+ that ever had a broken nose or other serious injury to face or skull (%)
Taste & Smell - People 40+ that ever had two or more sinus infections (%)
Weight - Average height (inches)
Weight - Average weight (pounds)
Weight - Average BMI
Weight - People that are obese (%)
Weight - People that ever were obese (%)
Weight - People trying to lose weight (%)
Latest news from Cape May Court House, NJ collected exclusively by city-data.com from local newspapers, TV, and radio stations
Ancestries: Irish (16.8%), Italian (16.2%), English (11.0%), German (8.5%), Polish (4.7%), American (2.4%).
Current Local Time:
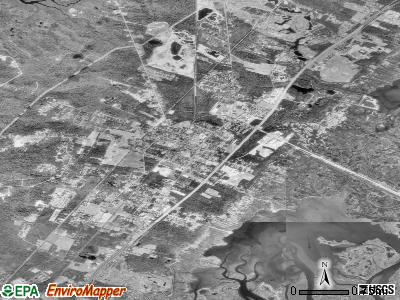
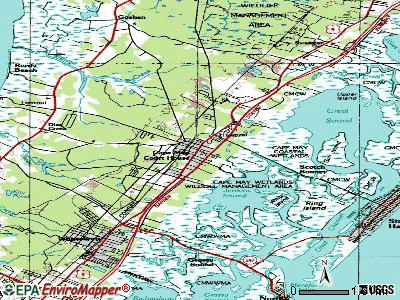
Land area: 8.98 square miles.
Population density: 595 people per square mile (low).
267 residents are foreign born (1.9% Asia , 1.8% Latin America , 1.0% Europe ).
This place:
4.8%New Jersey:
23.2%
Median real estate property taxes paid for housing units with mortgages in 2022: $5,525 (1.3%)Median real estate property taxes paid for housing units with no mortgage in 2022: $5,455 (1.3%)
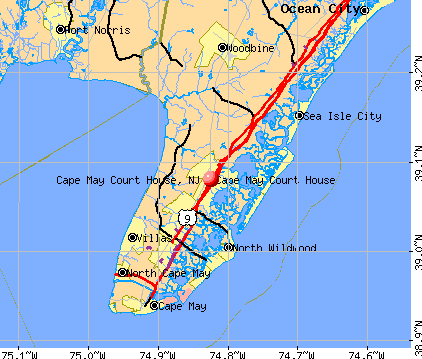
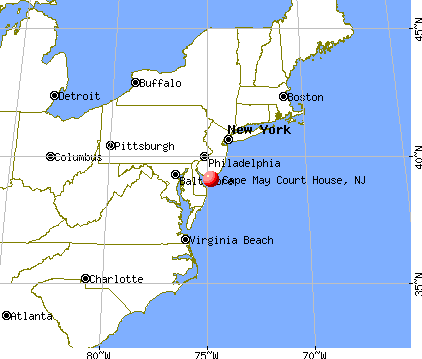
Nearest city with pop. 50,000+: Vineland, NJ
Nearest city with pop. 200,000+: Philadelphia, PA
Nearest cities:
Latitude: 39.08 N, Longitude: 74.82 W
Daytime population change due to commuting: +2,699 (+48.5%)Workers who live and work in this place: 896 (38.5%)
Unemployment in December 2023:
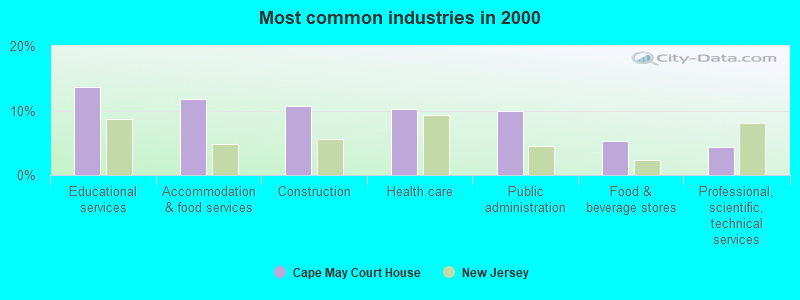
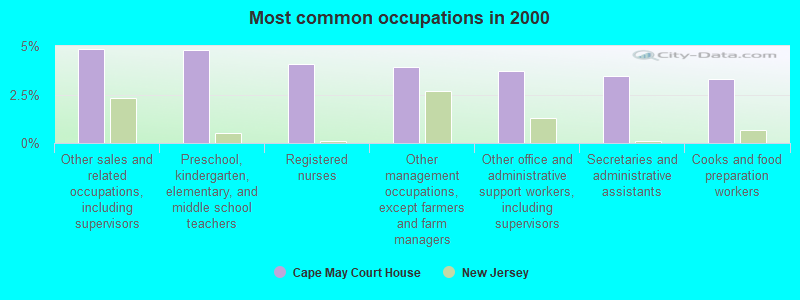
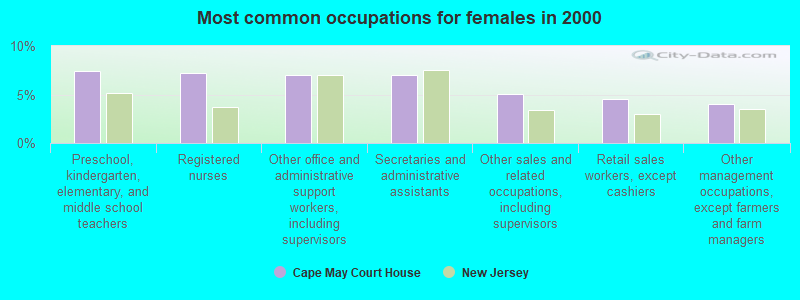
Most common occupations in Cape May Court House, NJ (%)
Both Males Females
Other sales and related occupations, including supervisors (4.8%)
Preschool, kindergarten, elementary, and middle school teachers (4.8%)
Registered nurses (4.1%)
Other management occupations, except farmers and farm managers (3.9%)
Other office and administrative support workers, including supervisors (3.7%)
Secretaries and administrative assistants (3.4%)
Cooks and food preparation workers (3.3%)
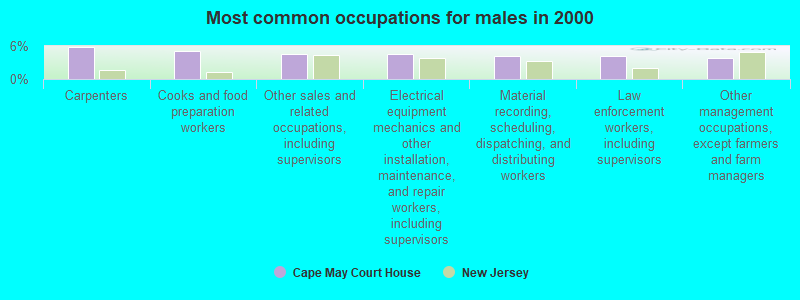
Carpenters (5.9%)
Cooks and food preparation workers (5.1%)
Other sales and related occupations, including supervisors (4.6%)
Electrical equipment mechanics and other installation, maintenance, and repair workers, including supervisors (4.5%)
Material recording, scheduling, dispatching, and distributing workers (4.2%)
Law enforcement workers, including supervisors (4.2%)
Other management occupations, except farmers and farm managers (3.8%)
Preschool, kindergarten, elementary, and middle school teachers (7.4%)
Registered nurses (7.2%)
Other office and administrative support workers, including supervisors (7.0%)
Secretaries and administrative assistants (7.0%)
Other sales and related occupations, including supervisors (5.0%)
Retail sales workers, except cashiers (4.6%)
Other management occupations, except farmers and farm managers (4.0%)
Tornado activity:
Cape May Court House-area historical tornado activity is below New Jersey state average. It is 56% smaller than the overall U.S. average.
On 5/6/1956, a category F2 (max. wind speeds 113-157 mph) tornado 11.7 miles away from the Cape May Court House place center caused between $5000 and $50,000 in damages.
On 7/21/1987, a category F2 tornado 22.8 miles away from the place center injured 3 people and caused between $500 and $5000 in damages.
Earthquake activity:
Cape May Court House-area historical earthquake activity is significantly above New Jersey state average. It is 68% smaller than the overall U.S. average. On 8/23/2011 at 17:51:04, a magnitude 5.8 (5.8 MW, Depth: 3.7 mi, Class: Moderate, Intensity: VI - VII) earthquake occurred 186.9 miles away from the city center On 1/16/1994 at 01:49:16, a magnitude 4.6 (4.6 MB, 4.6 LG, Depth: 3.1 mi, Class: Light, Intensity: IV - V) earthquake occurred 107.9 miles away from the city center On 11/30/2017 at 21:47:31, a magnitude 4.1 (4.1 MW, Depth: 6.1 mi) earthquake occurred 33.6 miles away from the city center On 1/15/2019 at 23:30:48, a magnitude 4.6 (4.6 MW, Depth: 6.2 mi) earthquake occurred 161.5 miles away from the city center On 1/16/1994 at 00:42:43, a magnitude 4.2 (4.2 MB, 4.0 LG, Depth: 3.1 mi) earthquake occurred 106.7 miles away from Cape May Court House center On 8/22/1992 at 12:20:32, a magnitude 4.8 (4.8 MB, 3.8 MS, 4.7 LG, Depth: 6.2 mi) earthquake occurred 241.8 miles away from Cape May Court House center Magnitude types: regional Lg-wave magnitude (LG), body-wave magnitude (MB), surface-wave magnitude (MS), moment magnitude (MW) Natural disasters: The number of natural disasters in Cape May County (29) is a lot greater than the US average (15).Major Disasters (Presidential) Declared: 19Emergencies Declared: 10Storms: 9, Hurricanes: 7, Floods: 6, Snowstorms: 4, Winter Storms: 3, Blizzards: 2, Heavy Rains: 2, Water Shortages: 2, Winds: 2, Tropical Depression: 1, Tropical Storm: 1, Other: 3 (Note: some incidents may be assigned to more than one category). Hospitals and medical centers in Cape May Court House: CAPE REGIONAL MEDICAL CENTER INC (Voluntary non-profit - Private, provides emergency services, TWO STONE HARBOR BLVD) COURTHOUSE CONV CENTER (144 MAGNOLIA DRIVE)
CREST HAVEN NURSING AND REHABILITATION CENTER (4 MOORE ROAD)
EASTERN SHORE NURSING/REHAB (1419 ROUTE 9 NORTH)
OCEANA REHABILITATION AND NC (502 ROUTE 9 NORTH)
SOUTH CAPE NH INC (STITES AVE)
RCG CAPE MAY DC (1259 SOUTH ROUTE 9)
CREST HAVEN HOME CARE (6 MOORE ROAD)
Colleges/universities with over 2000 students nearest to Cape May Court House:
Atlantic Cape Community College (about 28 miles; Mays Landing, NJ ; Full-time enrollment: 5,392)
Cumberland County College (about 28 miles; Vineland, NJ ; FT enrollment: 2,898)
The Richard Stockton College of New Jersey (about 33 miles; Galloway, NJ ; FT enrollment: 8,360)
Delaware State University (about 40 miles; Dover, DE ; FT enrollment: 4,087)
Delaware Technical Community College-Terry (about 41 miles; Dover, DE ; FT enrollment: 2,239)
Delaware Technical Community College-Owens (about 42 miles; Georgetown, DE ; FT enrollment: 3,159)
Rowan University (about 47 miles; Glassboro, NJ ; FT enrollment: 10,632)
Public high schools in Cape May Court House: CAPE MAY REGIONAL SCHOOL Location: 131 CREST HAVEN RD, Grades: 7-12)
CAPE MAY TRANSITIONAL EDUCATION CENTER Location: 131 CREST HAVEN ROAD, Grades: 10-12)
PROJECT TEACH - CAPE MAY Location: 131 CREST HAVEN ROAD, Grades: 10-12)
CAPE MAY COUNTY TECHNICAL HIGH SCHOOL Location: 188 CREST HAVEN RD, Grades: 9-12)CAPE MAY COUNTY HIGH SCHOOL Location: 148 CREST HAVEN ROAD, Grades: 9-12)MIDDLE TOWNSHIP HIGH SCHOOL Location: 300 EAST ATLANTIC AVENUE, Grades: 9-12)
Private high school in Cape May Court House: CAPE CHRISTIAN ACADEMY Students: 98, Location: 10 OYSTER RD, Grades: PK-12)
Public elementary/middle schools in Cape May Court House: OCEAN ACADEMY Location: 148 CREST HAVEN ROAD, Grades: PK-8)
DENNIS TOWNSHIP PRIMARY SCHOOL Location: 601 HAGAN ROAD, Grades: PK-3)
MIDDLE TOWNSHIP ELEMENTARY #2 Location: 101 WEST PACIFIC AVE, Grades: 3-5)
MIDDLE TOWNSHIP ELEMENTARY #1 Location: 215 ELDREDGE ROAD, Grades: PK-2)
MIDDLE TOWNSHIP ELEMENTARY #4 Location: 300 E PACIFIC AVE, Grades: 6-8)
Private elementary/middle school in Cape May Court House: BISHOP MCHUGH REGIONAL CATHOLIC Students: 219, Location: 2221 N ROUTE 9, Grades: PK-8)
See full list of schools located in Cape May Court House
Notable locations in Cape May Court House: (A) , Middle Township Ambulance Corps (B) , Middle Township Fire District 1 (C) . Display/hide their locations on the map
Churches in Cape May Court House include: (A) , Burleigh Church (B) . Display/hide their locations on the map
Cemetery: (1) . Display/hide its location on the map
Lakes and swamps: (A) , Halfmile Point Meadow (B) . Display/hide their locations on the map
Creeks: (A) , Shellbed Creek (B) . Display/hide their locations on the map
Tourist attractions:
Hotels:
Courts:
Birthplace of: Matt Szczur - Baseball player, Greg Fulginiti - Engineer.
Cape May County has a predicted average indoor radon screening level less than 2 pCi/L (pico curies per liter) - Low Potential Drinking water stations with addresses in Cape May Court House and their reported violations in the past:
WILDWOOD GOLF &CC CLUB H (Population served: 107, Groundwater):
Past monitoring violations:
One routine major monitoring violation
Population served: 103, Groundwater):
Past monitoring violations:
5 routine major monitoring violations
2 regular monitoring violations
Population served: 90, Groundwater):
Past monitoring violations:
Monitoring and Reporting (DBP) - Between JAN-2009 and DEC-2009, Contaminant: TTHM. Follow-up actions: St Public Notif requested (JUL-16-2010), St Formal NOV issued (JUL-16-2010), St Compliance achieved (AUG-23-2010)
Monitoring and Reporting (DBP) - Between JAN-2009 and DEC-2009, Contaminant: Total Haloacetic Acids (HAA5). Follow-up actions: St Public Notif requested (JUL-16-2010), St Formal NOV issued (JUL-16-2010), St Compliance achieved (AUG-23-2010)
Follow-up Or Routine LCR Tap M/R - In OCT-01-2004, Contaminant: Lead and Copper Rule. Follow-up actions: St Compliance achieved (AUG-05-2005)
6 routine major monitoring violations
One minor monitoring violation
42 regular monitoring violations
Serves PA, Population served: 50, Groundwater):
Past health violations:
OCCT/SOWT Study/Recommendation - In JUL-01-2013, Contaminant: Lead and Copper Rule. Follow-up actions: St Violation/Reminder Notice (AUG-02-2013)
Past monitoring violations:
Monitoring and Reporting (DBP) - Between JUL-2007 and SEP-2007, Contaminant: Total Haloacetic Acids (HAA5). Follow-up actions: St Public Notif requested (OCT-29-2007), St Formal NOV issued (OCT-29-2007), St BCA signed (FEB-25-2008), St Compliance achieved (FEB-25-2008), St Public Notif received (SEP-24-2008)
Monitoring and Reporting (DBP) - Between JUL-2007 and SEP-2007, Contaminant: TTHM. Follow-up actions: St Public Notif requested (OCT-29-2007), St Formal NOV issued (OCT-29-2007), St BCA signed (FEB-25-2008), St Compliance achieved (FEB-25-2008), St Public Notif received (SEP-24-2008)
9 regular monitoring violations
Drinking water stations with addresses in Cape May Court House that have no violations reported:
FAWN LAKE VILLAGE (Population served: 300, Primary Water Source Type: Groundwater)
EASTERN SHORE NURSING HO (Population served: 120, Primary Water Source Type: Groundwater)
UPPER TWP LIBRARY (Population served: 36, Primary Water Source Type: Groundwater)
WILDWOOD GOLF & CC MAINT (Population served: 27, Primary Water Source Type: Groundwater)
Average household size: This place:
2.4 peopleNew Jersey:
2.7 people
Percentage of family households: This place:
64.5%Whole state:
69.3%
Percentage of households with unmarried partners: This place:
6.6%Whole state:
5.9%
Likely homosexual households (counted as self-reported same-sex unmarried-partner households)
Lesbian couples: 0.3% of all households Gay men: 0.3% of all households
198 people in nursing facilities/skilled-nursing facilities in 2010people in nursing homes in 2000
Banks with branches in Cape May Court House (2011 data):
Sun National Bank: Cape May Court House Branch at 103 North Main Street, branch established on 1996/08/01. Info updated 2006/11/03: Bank assets: $3,180.3 mil, Deposits: $2,715.6 mil, headquarters in Vineland, NJ, negative income in the last year , Commercial Lending Specialization, 62 total offices , Holding Company: Sun Bancorp, Inc
Sturdy Savings Bank: Cape May Court House Branch at 17 S Main St, branch established on 1922/01/01. Info updated 2009/04/06: Bank assets: $542.0 mil, Deposits: $452.2 mil, headquarters in Stone Harbor, NJ, positive income , Commercial Lending Specialization, 8 total offices
PNC Bank, National Association: Cape May Court House Branch at 1 Court House South Dennis Road, branch established on 1978/06/06. Info updated 2012/03/20: Bank assets: $263,309.6 mil, Deposits: $197,343.0 mil, headquarters in Wilmington, DE, positive income , Commercial Lending Specialization, 3085 total offices , Holding Company: Pnc Financial Services Group, Inc., The
Cape Bank: at 225 North Main Street, branch established on 1923/01/01. Info updated 2010/06/23: Bank assets: $1,071.9 mil, Deposits: $778.0 mil, local headquarters , positive income , Commercial Lending Specialization, 15 total offices
1st Bank of Sea Isle City: Swainton Branch at 1615 Route 9 North, branch established on 2005/09/26. Info updated 2011/07/21: Bank assets: $240.9 mil, Deposits: $217.5 mil, headquarters in Sea Isle City, NJ, positive income , Mortgage Lending Specialization, 3 total offices
Bank of America, National Association: Cape May Court House Branch at 1 North Main Street, branch established on 1905/10/16. Info updated 2009/11/18: Bank assets: $1,451,969.3 mil, Deposits: $1,077,176.8 mil, headquarters in Charlotte, NC, positive income , 5782 total offices , Holding Company: Bank Of America Corporation
TD Bank, National Association: Cape May Court House Branch at 409 Route 9 North, branch established on 2001/03/31. Info updated 2010/10/04: Bank assets: $188,912.6 mil, Deposits: $153,149.8 mil, headquarters in Wilmington, DE, positive income , 1314 total offices , Holding Company: Toronto-Dominion Bank, The
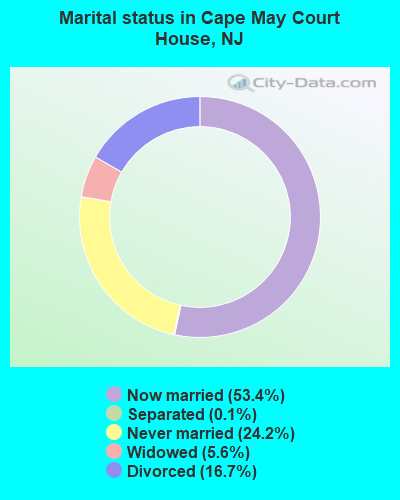
For population 15 years and over in Cape May Court House:
Never married: 24.2%Now married: 53.4%Separated: 0.1%Widowed: 5.6%Divorced: 16.7% For population 25 years and over in Cape May Court House:
High school or higher: 91.3%Bachelor's degree or higher: 28.7%Graduate or professional degree: 10.9%Unemployed: 5.3%Mean travel time to work (commute): 15.8 minutes
Education Gini index (Inequality in education) Here:
12.7New Jersey average:
12.8
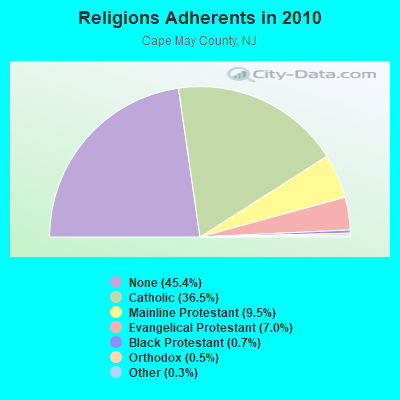
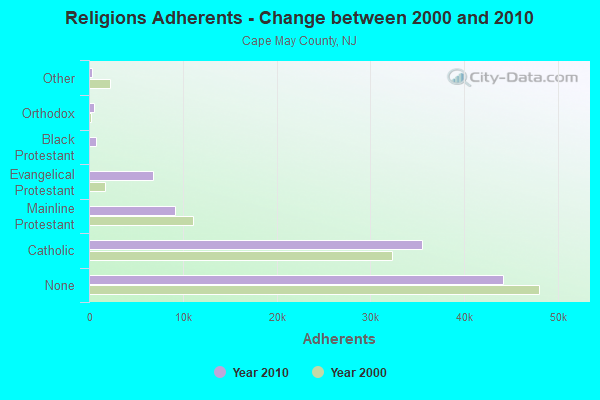
Religion statistics for Cape May Court House, NJ (based on Cape May County data)
Religion Adherents Congregations Catholic 35,541 14 Mainline Protestant 9,215 45 Evangelical Protestant 6,822 30 Black Protestant 719 7 Orthodox 500 1 Other 339 4 None 44,129 -
Source: Clifford Grammich, Kirk Hadaway, Richard Houseal, Dale E.Jones, Alexei Krindatch, Richie Stanley and Richard H.Taylor. 2012. 2010 U.S.Religion Census: Religious Congregations & Membership Study. Association of Statisticians of American Religious Bodies. Jones, Dale E., et al. 2002. Congregations and Membership in the United States 2000. Nashville, TN: Glenmary Research Center. Graphs represent county-level data
Food Environment Statistics: Number of grocery stores : 38Cape May County :
3.94 / 10,000 pop.State :
2.90 / 10,000 pop.
Number of convenience stores (no gas) : 29Here :
3.01 / 10,000 pop.State :
1.76 / 10,000 pop.
Number of convenience stores (with gas) : 11Cape May County :
1.14 / 10,000 pop.State :
0.81 / 10,000 pop.
Number of full-service restaurants : 238Here :
24.71 / 10,000 pop.State :
7.15 / 10,000 pop.
Adult diabetes rate : Cape May County :
10.0%New Jersey :
8.3%
Adult obesity rate : This county :
25.1%State :
23.3%
Low-income preschool obesity rate : Cape May County :
14.6%State :
18.0%
Health and Nutrition: Healthy diet rate : This city:
53.3%New Jersey:
50.6%
Average overall health of teeth and gums : This city:
51.5%State:
48.5%
Average BMI : Cape May Court House:
28.5New Jersey:
28.5
People feeling badly about themselves : This city:
22.0%State:
20.0%
People not drinking alcohol at all : This city:
9.6%New Jersey:
11.1%
Average hours sleeping at night : Cape May Court House:
6.9New Jersey:
6.8
Overweight people : Cape May Court House:
34.9%State:
33.6%
General health condition : Cape May Court House:
58.1%New Jersey:
56.9%
Average condition of hearing : Cape May Court House:
78.4%State:
80.0%
More about Health and Nutrition of Cape May Court House, NJ Residents
7.70% of this county's 2021 resident taxpayers lived in other counties in 2020 ($134,896 average adjusted gross income )
Here:
7.70%New Jersey average:
6.70%
0.05% of residents moved from foreign countries ($167 average AGI )Cape May County:
0.05%New Jersey average:
0.01%
Top counties from which taxpayers relocated into this county between 2020 and 2021:
6.46% of this county's 2020 resident taxpayers moved to other counties in 2021 ($115,622 average adjusted gross income )
Here:
6.46%New Jersey average:
7.02%
0.09% of residents moved to foreign countries ($203 average AGI )Cape May County:
0.09%New Jersey average:
0.02%
Top counties to which taxpayers relocated from this county between 2020 and 2021:
Businesses in Cape May Court House, NJ
Name Count Name Count
7-Eleven 1 McDonald's 1 Arby's 1 Payless 1 CVS 1 Penske 1 Chevrolet 1 Pier 1 Imports 1 Curves 1 Subaru 1 FedEx 1 Subway 1 Ford 1 U-Haul 2 H&R Block 1 UPS 8 Honda 1 Volkswagen 1 MasterBrand Cabinets 1
Strongest AM radio stations in Cape May Court House:
WCMC (1230 AM; 1 kW; WILDWOOD, NJ; Owner: EQUITY COMMUNICATIONS, L.P.)
WVCH (740 AM; 50 kW; CHESTER, PA; Owner: WVCH COMMUNICATIONS, INC.)
WPEN (950 AM; 50 kW; PHILADELPHIA, PA; Owner: GREATER PHILADELPHIA RADIO, INC.)
WIBG (1020 AM; daytime; 2 kW; OCEAN CITY/SOMERS PO, NJ; Owner: ENRICO S. BRANCADORA)
WPHT (1210 AM; 50 kW; PHILADELPHIA, PA; Owner: INFINITY BROADCASTING OPERATIONS, INC.)
WZZD (990 AM; 50 kW; PHILADELPHIA, PA; Owner: PENNSYLVANIA MEDIA ASSOCIATES, INC.)
KYW (1060 AM; 50 kW; PHILADELPHIA, PA; Owner: INFINITY BROADCASTING OPERATIONS, INC.)
WWJZ (640 AM; 50 kW; MOUNT HOLLY, NJ; Owner: ABC, INC.)
WJWL (900 AM; 10 kW; GEORGETOWN, DE; Owner: GREAT SCOTT BROADCASTING)
WNWR (1540 AM; 50 kW; PHILADELPHIA, PA)
WCBM (680 AM; 50 kW; BALTIMORE, MD; Owner: WCBM MARYLAND, INC.)
WMCA (570 AM; 50 kW; NEW YORK, NY; Owner: SALEM MEDIA OF NEW YORK, LLC)
WBIS (1190 AM; 50 kW; ANNAPOLIS, MD; Owner: NATIONS RADIO, LLC)
Strongest FM radio stations in Cape May Court House:
WNJZ (90.3 FM; CAPE MAY COURT HOUSE, NJ; Owner: NEW JERSEY PUBLIC BROADCASTING AUTHORITY)
WWCJ (89.1 FM; CAPE MAY, NJ; Owner: MERCER COUNTY COMMUNITY COLLEGE)
WGBZ (105.5 FM; CAPE MAY COURT HOUSE, NJ; Owner: EQUITY COMMUNICATIONS, L.P.)
WWZK (94.3 FM; AVALON, NJ; Owner: COASTAL BROADCASTING SYSTEMS, INC.)
WZXL (100.7 FM; WILDWOOD, NJ; Owner: EQUITY COMMUNICATIONS, L.P.)
WCZT (98.7 FM; VILLAS, NJ; Owner: WZK, LLC)
WBNJ (93.1 FM; WILDWOOD CREST, NJ; Owner: EQUITY COMMUNICATIONS, L.P.)
WDOX (106.7 FM; NORTH CAPE MAY, NJ; Owner: WJNN, INC.)
WTKU (98.3 FM; OCEAN CITY, NJ; Owner: SOUTH JERSEY RADIO, INC.)
WIXM (97.3 FM; MILLVILLE, NJ; Owner: MILLENNIUM ATLANTIC CITY II LICENSE HOLDCO, LLC)
WKOE (106.3 FM; OCEAN CITY, NJ; Owner: OCEAN COMMUNICATIONS)
WJSE (102.7 FM; PETERSBURG, NJ; Owner: PARINELLO ENTERPRISES, INC.)
WRTQ (91.3 FM; OCEAN CITY, NJ; Owner: TEMPLE U. OF THE COMMONWEALTH SYSTEM)
W220BT (91.9 FM; CAPE MAY, NJ; Owner: CALVARY CHAPEL OF TWIN FALLS, INC.)
WXGN (90.5 FM; EGG HARBOR TOWNSHIP, NJ; Owner: JOY BROADCASTING, INC.)
WTTH (96.1 FM; MARGATE CITY, NJ; Owner: EQUITY COMMUNICATIONS, L.P.)
WJPH (89.9 FM; WOODBINE, NJ; Owner: MARANATHA MINISTRIES/JOY COMMUNICATIONS, INC.)
W222AL (92.3 FM; CAPE MAY, NJ; Owner: FAMILY STATIONS, INC.)
TV broadcast stations around Cape May Court House:
WMGM-TV (Channel 40; WILDWOOD, NJ; Owner: SOUTH JERSEY RADIO, INC.)
W05AX (Channel 5; CAPE MAY, NJ; Owner: WILDWOOD FIVE TELEVISION)
WUVP (Channel 65; VINELAND, NJ; Owner: UNIVISION PHILADELPHIA LLC)
WMCN-TV (Channel 53; ATLANTIC CITY, NJ; Owner: LENFEST BROADCASTING, LLC)
WWSI (Channel 62; ATLANTIC CITY, NJ; Owner: HISPANIC BROADCASTERS OF PHILADELPHIA, L.L.C.)
WQAV-LP (Channel 34; ATLANTIC CITY, NJ; Owner: ASIAVISION, INC.)
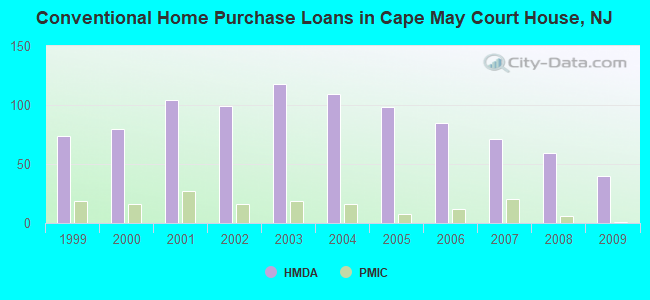
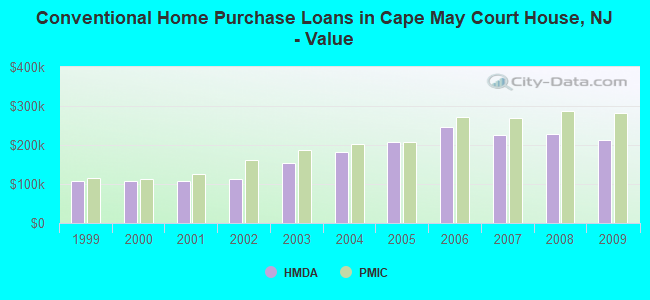
Home Mortgage Disclosure Act Aggregated Statistics For Year 2009(Based on 1 full tract) A) FHA, FSA/RHS & VA B) Conventional C) Refinancings D) Home Improvement Loans F) Non-occupant Loans on G) Loans On Manufactured Number Average Value Number Average Value Number Average Value Number Average Value Number Average Value Number Average Value
LOANS ORIGINATED 17 $222,235 40 $213,825 150 $206,133 11 $48,182 44 $212,136 2 $51,000 APPLICATIONS APPROVED, NOT ACCEPTED 1 $231,000 3 $201,000 12 $226,583 0 $0 3 $161,000 1 $38,000 APPLICATIONS DENIED 2 $219,000 2 $200,000 56 $233,893 8 $108,250 9 $282,111 2 $25,000 APPLICATIONS WITHDRAWN 1 $173,000 4 $209,750 45 $231,867 1 $100,000 11 $204,727 0 $0 FILES CLOSED FOR INCOMPLETENESS 0 $0 0 $0 9 $240,444 0 $0 1 $417,000 0 $0
Aggregated Statistics For Year 2008(Based on 1 full tract) A) FHA, FSA/RHS & VA B) Conventional C) Refinancings D) Home Improvement Loans F) Non-occupant Loans on G) Loans On Manufactured Number Average Value Number Average Value Number Average Value Number Average Value Number Average Value Number Average Value
LOANS ORIGINATED 5 $208,400 59 $227,932 96 $217,510 16 $70,812 42 $234,405 8 $63,625 APPLICATIONS APPROVED, NOT ACCEPTED 1 $136,000 3 $123,667 15 $203,600 0 $0 5 $144,000 1 $50,000 APPLICATIONS DENIED 2 $128,000 19 $263,947 46 $226,587 15 $81,933 10 $289,700 5 $43,000 APPLICATIONS WITHDRAWN 0 $0 11 $202,273 17 $204,118 2 $109,000 7 $142,000 1 $248,000 FILES CLOSED FOR INCOMPLETENESS 0 $0 2 $369,500 7 $228,714 0 $0 1 $166,000 0 $0
Aggregated Statistics For Year 2007(Based on 1 full tract) A) FHA, FSA/RHS & VA B) Conventional C) Refinancings D) Home Improvement Loans F) Non-occupant Loans on G) Loans On Manufactured Number Average Value Number Average Value Number Average Value Number Average Value Number Average Value Number Average Value
LOANS ORIGINATED 2 $215,000 71 $224,817 157 $206,299 37 $76,000 30 $247,600 11 $80,455 APPLICATIONS APPROVED, NOT ACCEPTED 0 $0 12 $224,250 32 $199,562 9 $130,111 7 $174,286 4 $56,500 APPLICATIONS DENIED 2 $244,500 10 $150,000 79 $210,405 27 $91,296 11 $199,000 3 $25,000 APPLICATIONS WITHDRAWN 0 $0 8 $214,000 35 $250,886 1 $25,000 6 $264,833 0 $0 FILES CLOSED FOR INCOMPLETENESS 2 $228,000 2 $303,000 16 $260,875 0 $0 2 $96,000 0 $0
Aggregated Statistics For Year 2006(Based on 1 full tract) A) FHA, FSA/RHS & VA B) Conventional C) Refinancings D) Home Improvement Loans F) Non-occupant Loans on G) Loans On Manufactured Number Average Value Number Average Value Number Average Value Number Average Value Number Average Value Number Average Value
LOANS ORIGINATED 3 $194,667 85 $246,459 144 $183,396 56 $80,518 40 $243,975 3 $86,000 APPLICATIONS APPROVED, NOT ACCEPTED 0 $0 5 $91,800 24 $175,750 14 $79,000 3 $153,667 1 $38,000 APPLICATIONS DENIED 2 $234,500 22 $182,500 71 $212,155 20 $92,050 11 $200,091 10 $78,300 APPLICATIONS WITHDRAWN 0 $0 11 $243,545 57 $161,246 1 $35,000 3 $116,667 1 $59,000 FILES CLOSED FOR INCOMPLETENESS 0 $0 4 $202,750 9 $155,333 2 $165,000 1 $191,000 0 $0
Aggregated Statistics For Year 2005(Based on 1 full tract) A) FHA, FSA/RHS & VA B) Conventional C) Refinancings D) Home Improvement Loans E) Loans on Dwellings For 5+ Families F) Non-occupant Loans on G) Loans On Manufactured Number Average Value Number Average Value Number Average Value Number Average Value Number Average Value Number Average Value Number Average Value
LOANS ORIGINATED 2 $259,000 98 $206,673 170 $176,441 49 $85,122 0 $0 39 $201,744 5 $53,800 APPLICATIONS APPROVED, NOT ACCEPTED 0 $0 10 $229,400 26 $168,846 3 $12,333 0 $0 4 $271,500 1 $50,000 APPLICATIONS DENIED 0 $0 15 $171,267 59 $169,661 19 $76,053 0 $0 12 $147,333 7 $42,000 APPLICATIONS WITHDRAWN 0 $0 10 $178,500 70 $181,614 6 $275,667 1 $10,000 7 $181,857 1 $40,000 FILES CLOSED FOR INCOMPLETENESS 1 $284,000 3 $175,000 13 $188,846 1 $40,000 0 $0 2 $191,000 0 $0
Aggregated Statistics For Year 2004(Based on 1 full tract) A) FHA, FSA/RHS & VA B) Conventional C) Refinancings D) Home Improvement Loans E) Loans on Dwellings For 5+ Families F) Non-occupant Loans on G) Loans On Manufactured Number Average Value Number Average Value Number Average Value Number Average Value Number Average Value Number Average Value Number Average Value
LOANS ORIGINATED 4 $142,750 109 $182,028 176 $163,261 38 $65,868 1 $7,623,000 59 $174,186 6 $64,333 APPLICATIONS APPROVED, NOT ACCEPTED 0 $0 12 $201,000 29 $183,931 4 $57,500 0 $0 5 $359,800 1 $35,000 APPLICATIONS DENIED 0 $0 19 $176,947 60 $136,617 28 $54,107 0 $0 12 $139,583 12 $43,583 APPLICATIONS WITHDRAWN 0 $0 10 $176,200 57 $145,982 3 $125,333 1 $110,000 6 $212,167 0 $0 FILES CLOSED FOR INCOMPLETENESS 0 $0 1 $132,000 9 $182,333 2 $100,000 0 $0 1 $70,000 0 $0
Aggregated Statistics For Year 2003(Based on 1 full tract) A) FHA, FSA/RHS & VA B) Conventional C) Refinancings D) Home Improvement Loans F) Non-occupant Loans on Number Average Value Number Average Value Number Average Value Number Average Value Number Average Value
LOANS ORIGINATED 5 $175,000 118 $154,585 297 $117,273 16 $55,938 55 $133,855 APPLICATIONS APPROVED, NOT ACCEPTED 0 $0 21 $179,286 39 $127,718 5 $41,800 5 $140,400 APPLICATIONS DENIED 0 $0 7 $103,857 77 $110,260 19 $30,789 5 $74,600 APPLICATIONS WITHDRAWN 1 $163,000 14 $167,286 60 $126,283 4 $85,500 8 $120,000 FILES CLOSED FOR INCOMPLETENESS 0 $0 2 $101,500 8 $98,875 1 $60,000 1 $80,000
Aggregated Statistics For Year 2002(Based on 1 full tract) A) FHA, FSA/RHS & VA B) Conventional C) Refinancings D) Home Improvement Loans E) Loans on Dwellings For 5+ Families F) Non-occupant Loans on Number Average Value Number Average Value Number Average Value Number Average Value Number Average Value Number Average Value
LOANS ORIGINATED 10 $139,600 99 $111,606 206 $113,621 35 $37,714 1 $124,000 43 $122,837 APPLICATIONS APPROVED, NOT ACCEPTED 0 $0 7 $83,571 41 $99,268 6 $42,500 0 $0 5 $96,400 APPLICATIONS DENIED 0 $0 13 $102,538 67 $87,597 16 $32,062 0 $0 8 $124,000 APPLICATIONS WITHDRAWN 2 $108,500 4 $69,250 39 $97,769 3 $30,000 0 $0 2 $104,000 FILES CLOSED FOR INCOMPLETENESS 1 $133,000 3 $99,667 10 $92,400 0 $0 0 $0 2 $109,000
Aggregated Statistics For Year 2001(Based on 1 full tract) A) FHA, FSA/RHS & VA B) Conventional C) Refinancings D) Home Improvement Loans F) Non-occupant Loans on Number Average Value Number Average Value Number Average Value Number Average Value Number Average Value
LOANS ORIGINATED 11 $116,545 104 $107,087 137 $89,088 34 $28,794 29 $103,241 APPLICATIONS APPROVED, NOT ACCEPTED 1 $78,000 13 $59,462 23 $73,913 6 $22,333 1 $44,000 APPLICATIONS DENIED 2 $86,500 16 $104,500 59 $69,119 22 $28,864 8 $116,000 APPLICATIONS WITHDRAWN 1 $197,000 7 $98,571 28 $96,179 4 $23,500 2 $107,000 FILES CLOSED FOR INCOMPLETENESS 0 $0 0 $0 5 $95,600 1 $120,000 1 $62,000
Aggregated Statistics For Year 2000(Based on 1 full tract) A) FHA, FSA/RHS & VA B) Conventional C) Refinancings D) Home Improvement Loans F) Non-occupant Loans on Number Average Value Number Average Value Number Average Value Number Average Value Number Average Value
LOANS ORIGINATED 15 $106,800 80 $107,625 49 $57,837 25 $22,120 15 $105,067 APPLICATIONS APPROVED, NOT ACCEPTED 1 $114,000 6 $218,500 24 $63,375 11 $24,364 4 $152,750 APPLICATIONS DENIED 5 $88,000 15 $61,267 38 $56,289 21 $20,190 0 $0 APPLICATIONS WITHDRAWN 2 $78,000 6 $59,667 33 $68,121 2 $45,000 3 $49,333 FILES CLOSED FOR INCOMPLETENESS 0 $0 0 $0 11 $81,909 0 $0 0 $0
Aggregated Statistics For Year 1999(Based on 1 full tract) A) FHA, FSA/RHS & VA B) Conventional C) Refinancings D) Home Improvement Loans F) Non-occupant Loans on Number Average Value Number Average Value Number Average Value Number Average Value Number Average Value
LOANS ORIGINATED 22 $84,018 74 $108,838 88 $81,260 31 $21,306 34 $123,320 APPLICATIONS APPROVED, NOT ACCEPTED 1 $142,860 6 $50,393 22 $62,135 7 $26,979 1 $110,570 APPLICATIONS DENIED 2 $85,130 19 $66,589 51 $69,531 14 $24,742 5 $62,232 APPLICATIONS WITHDRAWN 0 $0 12 $73,795 34 $86,684 4 $31,312 1 $38,160 FILES CLOSED FOR INCOMPLETENESS 0 $0 4 $170,260 8 $126,471 0 $0 0 $0
Detailed HMDA statistics for the following Tracts:
0211.00
Private Mortgage Insurance Companies Aggregated Statistics For Year 2009(Based on 1 full tract) A) Conventional B) Refinancings C) Non-occupant Loans on Number Average Value Number Average Value Number Average Value
LOANS ORIGINATED 1 $281,000 4 $234,000 0 $0 APPLICATIONS APPROVED, NOT ACCEPTED 3 $306,000 2 $346,500 0 $0 APPLICATIONS DENIED 2 $351,500 1 $344,000 1 $344,000 APPLICATIONS WITHDRAWN 0 $0 0 $0 0 $0 FILES CLOSED FOR INCOMPLETENESS 0 $0 0 $0 0 $0
Aggregated Statistics For Year 2008(Based on 1 full tract) A) Conventional B) Refinancings C) Non-occupant Loans on Number Average Value Number Average Value Number Average Value
LOANS ORIGINATED 6 $286,667 4 $269,750 2 $309,000 APPLICATIONS APPROVED, NOT ACCEPTED 0 $0 2 $269,500 0 $0 APPLICATIONS DENIED 0 $0 2 $197,000 1 $197,000 APPLICATIONS WITHDRAWN 2 $335,500 0 $0 2 $335,500 FILES CLOSED FOR INCOMPLETENESS 0 $0 1 $325,000 0 $0
Aggregated Statistics For Year 2007(Based on 1 full tract) A) Conventional B) Refinancings C) Non-occupant Loans on Number Average Value Number Average Value Number Average Value
LOANS ORIGINATED 20 $268,600 7 $338,714 3 $263,667 APPLICATIONS APPROVED, NOT ACCEPTED 2 $276,000 1 $338,000 0 $0 APPLICATIONS DENIED 0 $0 0 $0 0 $0 APPLICATIONS WITHDRAWN 2 $182,000 0 $0 2 $182,000 FILES CLOSED FOR INCOMPLETENESS 0 $0 0 $0 0 $0
Aggregated Statistics For Year 2006(Based on 1 full tract) A) Conventional B) Refinancings C) Non-occupant Loans on D) Loans On Manufactured Number Average Value Number Average Value Number Average Value Number Average Value
LOANS ORIGINATED 12 $271,250 5 $231,600 4 $227,750 1 $153,000 APPLICATIONS APPROVED, NOT ACCEPTED 1 $193,000 3 $321,333 0 $0 0 $0 APPLICATIONS DENIED 0 $0 0 $0 0 $0 0 $0 APPLICATIONS WITHDRAWN 0 $0 0 $0 0 $0 0 $0 FILES CLOSED FOR INCOMPLETENESS 0 $0 0 $0 0 $0 0 $0
Aggregated Statistics For Year 2005(Based on 1 full tract) A) Conventional B) Refinancings C) Non-occupant Loans on Number Average Value Number Average Value Number Average Value
LOANS ORIGINATED 8 $208,875 3 $266,667 1 $133,000 APPLICATIONS APPROVED, NOT ACCEPTED 4 $232,250 0 $0 0 $0 APPLICATIONS DENIED 0 $0 0 $0 0 $0 APPLICATIONS WITHDRAWN 0 $0 1 $175,000 0 $0 FILES CLOSED FOR INCOMPLETENESS 0 $0 0 $0 0 $0
Aggregated Statistics For Year 2004(Based on 1 full tract) A) Conventional B) Refinancings C) Non-occupant Loans on Number Average Value Number Average Value Number Average Value
LOANS ORIGINATED 16 $202,688 3 $284,333 4 $225,750 APPLICATIONS APPROVED, NOT ACCEPTED 0 $0 1 $83,000 0 $0 APPLICATIONS DENIED 1 $174,000 0 $0 0 $0 APPLICATIONS WITHDRAWN 1 $124,000 1 $83,000 0 $0 FILES CLOSED FOR INCOMPLETENESS 0 $0 1 $477,000 0 $0
Aggregated Statistics For Year 2003(Based on 1 full tract) A) Conventional B) Refinancings C) Non-occupant Loans on Number Average Value Number Average Value Number Average Value
LOANS ORIGINATED 19 $187,474 11 $147,364 3 $129,000 APPLICATIONS APPROVED, NOT ACCEPTED 3 $137,333 0 $0 0 $0 APPLICATIONS DENIED 0 $0 0 $0 0 $0 APPLICATIONS WITHDRAWN 0 $0 0 $0 0 $0 FILES CLOSED FOR INCOMPLETENESS 0 $0 0 $0 0 $0
Aggregated Statistics For Year 2002(Based on 1 full tract) A) Conventional B) Refinancings C) Non-occupant Loans on Number Average Value Number Average Value Number Average Value
LOANS ORIGINATED 16 $161,562 10 $140,200 7 $172,714 APPLICATIONS APPROVED, NOT ACCEPTED 1 $275,000 5 $157,000 0 $0 APPLICATIONS DENIED 0 $0 0 $0 0 $0 APPLICATIONS WITHDRAWN 4 $126,000 1 $95,000 2 $134,000 FILES CLOSED FOR INCOMPLETENESS 0 $0 0 $0 0 $0
Aggregated Statistics For Year 2001(Based on 1 full tract) A) Conventional B) Refinancings C) Non-occupant Loans on Number Average Value Number Average Value Number Average Value
LOANS ORIGINATED 27 $124,444 3 $131,000 3 $114,333 APPLICATIONS APPROVED, NOT ACCEPTED 3 $122,333 5 $153,400 0 $0 APPLICATIONS DENIED 0 $0 1 $220,000 0 $0 APPLICATIONS WITHDRAWN 1 $157,000 0 $0 0 $0 FILES CLOSED FOR INCOMPLETENESS 2 $155,500 0 $0 0 $0
Aggregated Statistics For Year 2000(Based on 1 full tract) A) Conventional B) Refinancings C) Non-occupant Loans on Number Average Value Number Average Value Number Average Value
LOANS ORIGINATED 16 $112,000 1 $78,000 3 $129,333 APPLICATIONS APPROVED, NOT ACCEPTED 3 $78,000 2 $139,000 1 $51,000 APPLICATIONS DENIED 0 $0 0 $0 0 $0 APPLICATIONS WITHDRAWN 0 $0 0 $0 0 $0 FILES CLOSED FOR INCOMPLETENESS 0 $0 0 $0 0 $0
Aggregated Statistics For Year 1999(Based on 1 full tract) A) Conventional B) Refinancings C) Non-occupant Loans on Number Average Value Number Average Value Number Average Value
LOANS ORIGINATED 19 $114,639 6 $105,842 5 $70,060 APPLICATIONS APPROVED, NOT ACCEPTED 0 $0 2 $168,300 0 $0 APPLICATIONS DENIED 1 $146,770 1 $81,220 0 $0 APPLICATIONS WITHDRAWN 1 $112,530 1 $168,300 1 $112,530 FILES CLOSED FOR INCOMPLETENESS 1 $101,760 0 $0 0 $0
Detailed PMIC statistics for the following Tracts:
0211.00
Cape May Court House compared to New Jersey state average:
Unemployed percentage below state average. Black race population percentage below state average. Median age above state average. Foreign-born population percentage significantly below state average. Institutionalized population percentage above state average. Cape May Court House on our top lists :
#49 on the list of "Top 101 cities with largest percentage of males in occupations: office and administrative support occupations (population 5,000+)"
#15 on the list of "Top 101 counties with the highest percentage of residents that smoked 100+ cigarettes in their lives"
#15 on the list of "Top 101 counties with the highest number of deaths per 1000 residents 2007-2013 (pop. 50,000+)"
#27 on the list of "Top 101 counties with the lowest number of births per 1000 residents 2007-2013"
#57 on the list of "Top 101 counties with the lowest average weight of females"
#77 on the list of "Top 101 counties with the highest percentage of residents that drank alcohol in the past 30 days"
Top Patent Applicants
Edmund S. Dubens (3)
Edward W. Obropta, Jr. (2)
Deborah Smith (1)
Gary S. Pogoda (1)
Inho Jung (1)
Raman Avetsisiants (1)
Joseph Edward Dougherty, Iv (1)
William Anthony Haryslak (1)
Stephen Smith (1)
Joseph Dicicco (1)
Total of 12 patent applications in 2008-2024.


 Recent articles from our blog. Our writers, many of them Ph.D. graduates or candidates, create easy-to-read articles on a wide variety of topics.


 (29.5 miles
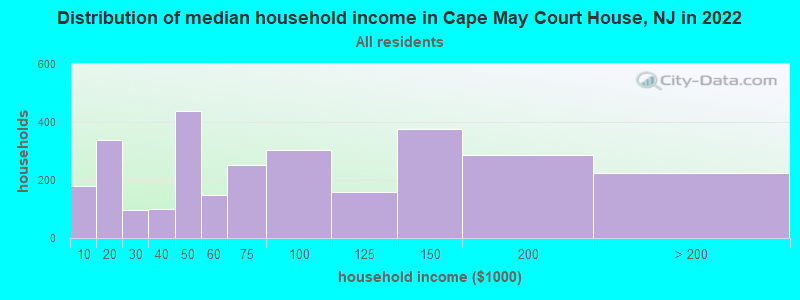


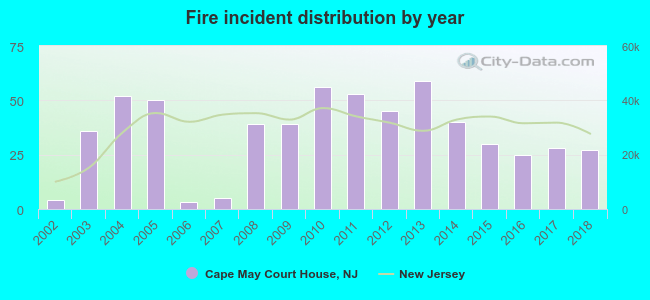 According to the data from the years 2002 - 2018 the average number of fires per year is 35. The highest number of fire incidents - 59 took place in 2013, and the least - 3 in 2006. The data has a growing trend.
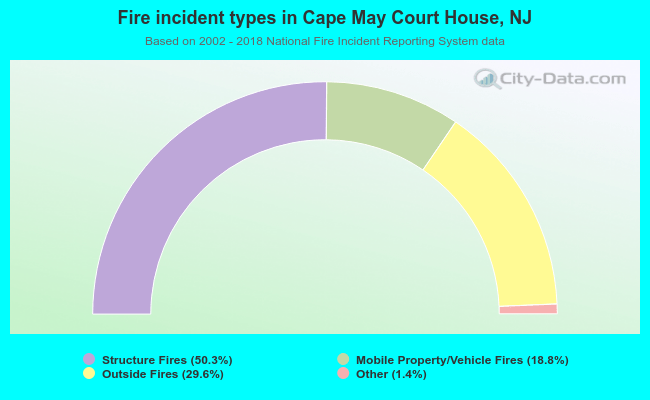 When looking into fire subcategories, the most reports belonged to: Structure Fires (50.3%), and Outside Fires (29.6%).