Percentage of residents living in poverty in 2022: 18.6%
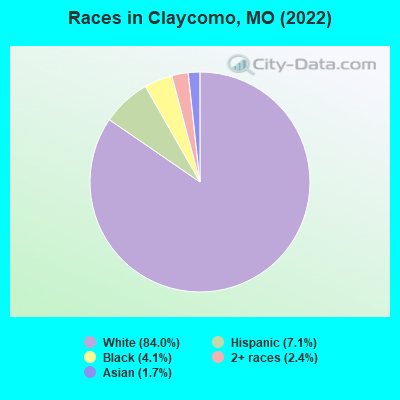
(12.4% for White Non-Hispanic residents, 15.5% for Black residents, 91.8% for Hispanic or Latino residents, 100.0% for American Indian residents, 95.4% for other race residents, 70.2% for two or more races residents)
According to our research of Missouri and other state lists, there were 2 registered sex offenders living in Claycomo, Missouri as of May 15, 2024. The ratio of all residents to sex offenders in Claycomo is 783 to 1. The ratio of registered sex offenders to all residents in this city is lower than the state average.
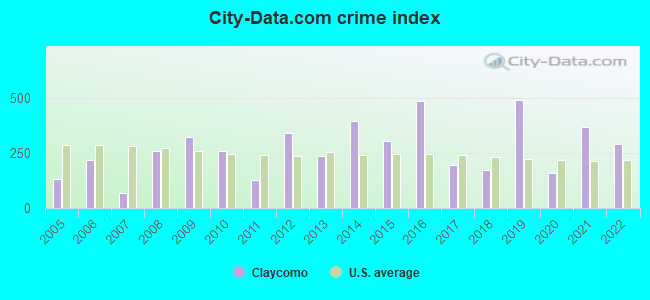
Crime rates in Claycomo by year
Type
2009
2010
2011
2012
2013
2014
2015
2016
2017
2018
2019
2020
2021
2022
Murders (per 100,000)
0 (0.0)
0 (0.0)
0 (0.0)
0 (0.0)
0 (0.0)
1 (68.3)
0 (0.0)
1 (67.8)
0 (0.0)
0 (0.0)
1 (66.6)
0 (0.0)
0 (0.0)
0 (0.0)
Rapes (per 100,000)
1 (76.0)
1 (69.9)
0 (0.0)
3 (206.3)
0 (0.0)
1 (68.3)
0 (0.0)
1 (67.8)
0 (0.0)
0 (0.0)
0 (0.0)
0 (0.0)
1 (65.0)
0 (0.0)
Robberies (per 100,000)
2 (152.0)
1 (69.9)
0 (0.0)
0 (0.0)
0 (0.0)
0 (0.0)
4 (270.5)
0 (0.0)
1 (67.7)
0 (0.0)
3 (199.9)
1 (65.5)
3 (195.1)
0 (0.0)
Assaults (per 100,000)
3 (228.0)
2 (139.9)
0 (0.0)
3 (206.3)
7 (478.8)
2 (136.5)
1 (67.6)
6 (406.8)
1 (67.7)
3 (200.5)
7 (466.4)
0 (0.0)
5 (325.1)
2 (145.6)
Burglaries (per 100,000)
6 (455.9)
11 (769.2)
8 (557.5)
4 (275.1)
2 (136.8)
8 (546.1)
12 (811.4)
8 (542.4)
4 (270.8)
6 (401.1)
7 (466.4)
5 (327.7)
4 (260.1)
5 (363.9)
Thefts (per 100,000)
31 (2,356)
33 (2,308)
27 (1,882)
36 (2,476)
35 (2,394)
33 (2,253)
42 (2,840)
42 (2,847)
37 (2,505)
31 (2,072)
32 (2,132)
22 (1,442)
24 (1,560)
33 (2,402)
Auto thefts (per 100,000)
7 (531.9)
1 (69.9)
2 (139.4)
3 (206.3)
6 (410.4)
9 (614.3)
7 (473.3)
11 (745.8)
8 (541.6)
4 (267.4)
16 (1,066)
11 (720.8)
21 (1,365)
24 (1,747)
Arson (per 100,000)
1 (76.0)
0 (0.0)
0 (0.0)
0 (0.0)
0 (0.0)
1 (68.3)
0 (0.0)
0 (0.0)
1 (67.7)
1 (66.8)
0 (0.0)
0 (0.0)
0 (0.0)
0 (0.0)
City-Data.com crime index
320.7
256.6
125.4
341.1
233.9
395.9
302.9
482.7
196.3
172.5
489.7
157.9
365.4
290.4
The City-Data.com crime index weighs serious crimes and violent crimes more heavily. Higher means more crime, U.S. average is 246.1. It adjusts for the number of visitors and daily workers commuting into cities.
Latest news from Claycomo, MO collected exclusively by city-data.com from local newspapers, TV, and radio stations
Ancestries: German (17.7%), American (16.5%), English (16.4%), Irish (5.8%), Belgian (3.6%), European (2.6%).
Current Local Time: CST time zone
Incorporated in 1946
Elevation: 835 feet
Land area: 2.50 square miles.
Population density: 541 people per square mile (low).
75 residents are foreign born (3.5% Latin America, 0.7% Asia).
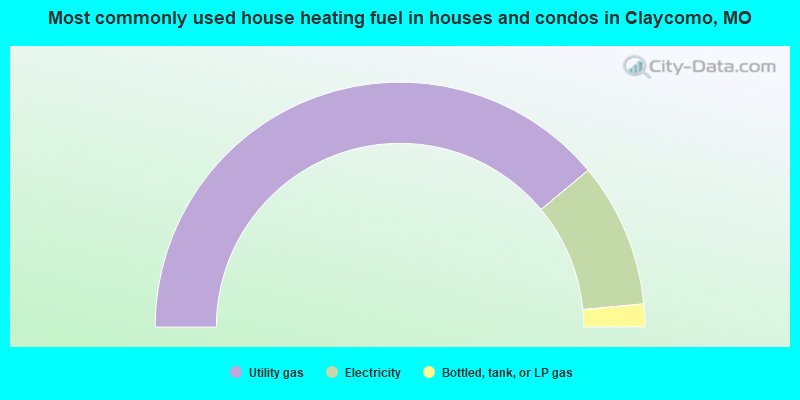
This village:
4.1%
Missouri:
4.2%
Median real estate property taxes paid for housing units with mortgages in 2022: $1,702 (1.0%) Median real estate property taxes paid for housing units with no mortgage in 2022: $1,477 (1.3%)
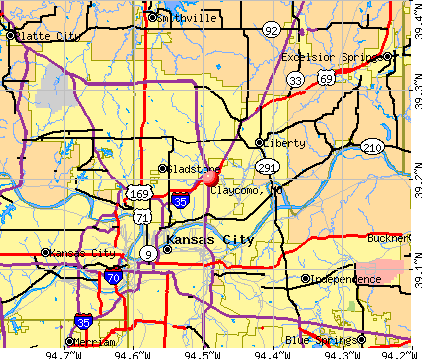
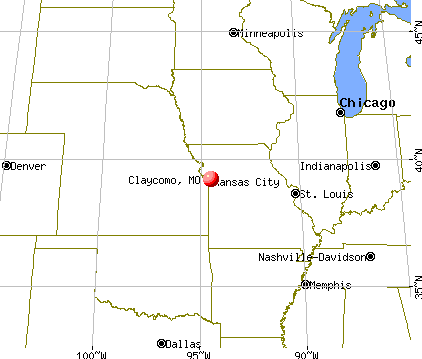
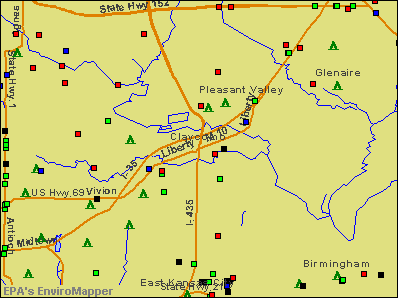
Nearest city with pop. 50,000+: Kansas City, MO (9.3 miles , pop. 441,545).
Nearest city with pop. 1,000,000+: Chicago, IL (401.8 miles , pop. 2,896,016).
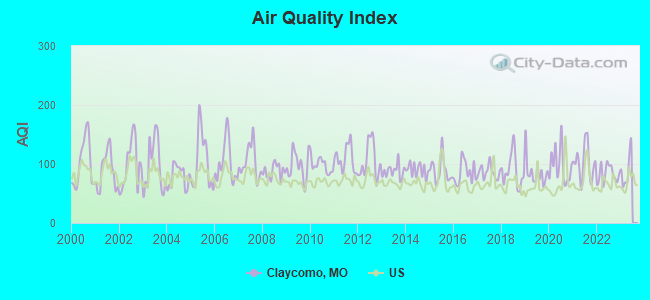
Air Quality Index (AQI) level in 2022 was 82.8. This is about average.
City:
82.8
U.S.:
72.6
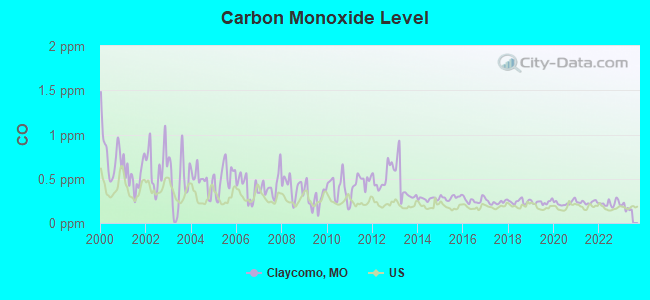
Carbon Monoxide (CO) [ppm] level in 2022 was 0.222. This is about average.Closest monitor was 4.0 miles away from the city center.
City:
0.222
U.S.:
0.251
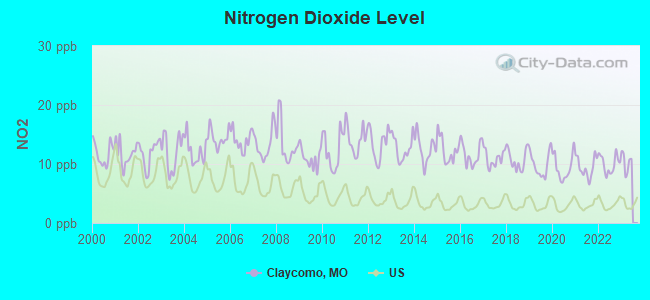
Nitrogen Dioxide (NO2) [ppb] level in 2022 was 9.99. This is significantly worse than average.Closest monitor was 5.0 miles away from the city center.
City:
9.99
U.S.:
5.11
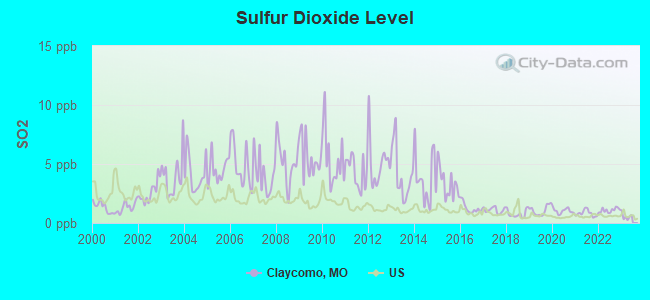
Sulfur Dioxide (SO2) [ppb] level in 2022 was 1.08. This is significantly better than average.Closest monitor was 1.2 miles away from the city center.
City:
1.08
U.S.:
1.51
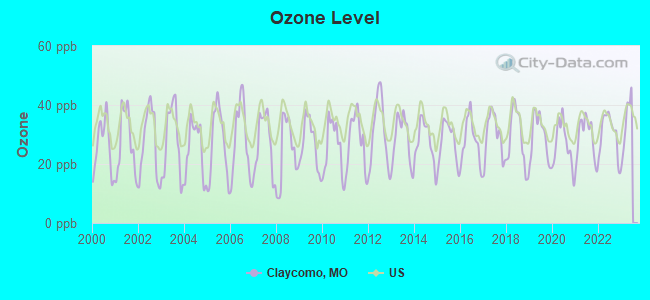
Ozone [ppb] level in 2022 was 30.2. This is about average.Closest monitor was 1.2 miles away from the city center.
City:
30.2
U.S.:
33.3
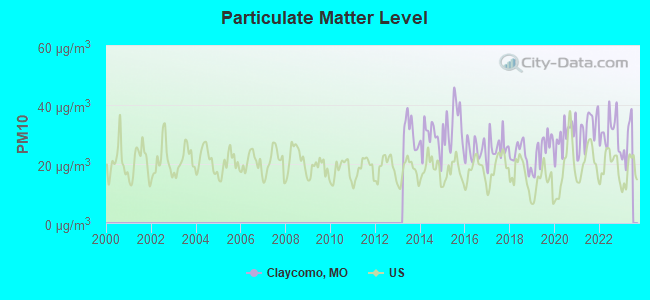
Particulate Matter (PM10) [µg/m3] level in 2022 was 30.7. This is significantly worse than average.Closest monitor was 5.2 miles away from the city center.
City:
30.7
U.S.:
19.2
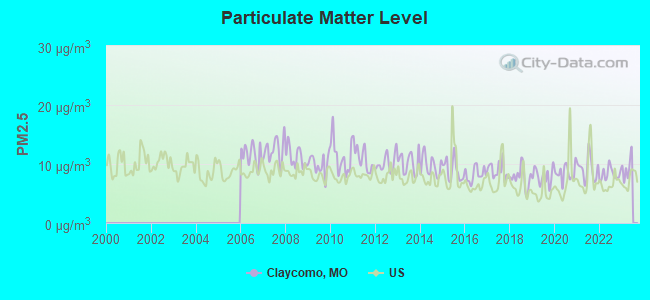
Particulate Matter (PM2.5) [µg/m3] level in 2022 was 8.27. This is about average.Closest monitor was 6.8 miles away from the city center.
City:
8.27
U.S.:
8.11
Tornado activity:
Claycomo-area historical tornado activity is slightly above Missouri state average. It is 99% greater than the overall U.S. average.
On 5/20/1957, a category F5 (max. wind speeds 261-318 mph) tornado 16.0 miles away from the Claycomo village center killed 44 peopleand injured 207 peopleand causedbetween $500,000 and $5,000,000 in damages.
On 5/4/2003, a category F4 (max. wind speeds 207-260 mph) tornado 2.1 miles away from the village center injured 13 peopleand caused $31 million in damages.
Earthquake activity:
Claycomo-area historical earthquake activity is significantly above Missouri state average. It is 483% greater than the overall U.S. average.
On 9/3/2016 at 12:02:44, a magnitude 5.8 (5.8 MW, Depth: 3.5 mi, Class: Moderate, Intensity: VI - VII) earthquake occurred 233.7 miles away from Claycomo center On 11/6/2011 at 03:53:10, a magnitude 5.7 (5.7 MW, Depth: 3.2 mi) earthquake occurred 282.9 miles away from the city center On 11/12/2014 at 21:40:00, a magnitude 4.9 (4.9 MW, Depth: 2.5 mi, Class: Light, Intensity: IV - V) earthquake occurred 216.2 miles away from Claycomo center On 11/7/2016 at 01:44:24, a magnitude 5.0 (5.0 MW, Depth: 2.8 mi) earthquake occurred 255.6 miles away from Claycomo center On 2/13/2016 at 17:07:06, a magnitude 5.1 (5.1 MW, Depth: 5.2 mi) earthquake occurred 297.0 miles away from the city center On 4/18/2008 at 09:36:59, a magnitude 5.4 (5.1 MB, 4.8 MS, 5.4 MW, 5.2 MW) earthquake occurred 359.5 miles away from the city center Magnitude types: body-wave magnitude (MB), surface-wave magnitude (MS), moment magnitude (MW)
Natural disasters:
The number of natural disasters in Clay County (24) is greater than the US average (15). Major Disasters (Presidential) Declared: 16 Emergencies Declared: 6
Causes of natural disasters: Floods: 17, Storms: 14, Tornadoes: 7, Winter Storms: 3, Drought: 1, Heavy Rain: 1, Hurricane: 1, Ice Storm: 1, Wind: 1, Other: 1 (Note: some incidents may be assigned to more than one category).
Hospitals and medical centers near Claycomo:
PLEASANT VALLEY MANOR CARE CENTER (Nursing Home, about 2 miles away; LIBERTY, MO)
CLAYVIEW HOME HEALTH SERVICES, INC (Home Health Center, about 3 miles away; KANSAS CITY, MO)
WOODBINE HEALTHCARE AND REHABILITATION CENTRE (Nursing Home, about 3 miles away; GLADSTONE, MO)
LIBERTY HOSPITAL HOSPICE (Hospital, about 5 miles away; LIBERTY, MO)
ASHTON COURT CARE AND REHABILITATION CENTRE (Nursing Home, about 5 miles away; LIBERTY, MO)
REGIONAL HOSPICE II (Hospital, about 5 miles away; LIBERTY, MO)
NORTHLAND DIALYSIS (Dialysis Facility, about 5 miles away; NORTH KANSAS CITY, MO)
Amtrak stations near Claycomo:
9 miles: INDEPENDENCE (600 S. GRAND AVE.) . Services: free short-term parking, call for taxi service.
10 miles: KANSAS CITY (2200 MAIN ST.) . Services: ticket office, fully wheelchair accessible, enclosed waiting area, public restrooms, public payphones, snack bar, free short-term parking, paid long-term parking, call for car rental service, taxi stand, public transit connection.
Colleges/universities with over 2000 students nearest to Claycomo:
Grantham University (about 10 miles; Kansas City, MO; Full-time enrollment: 8,385)
Park University (about 11 miles; Parkville, MO; FT enrollment: 9,131)
Metropolitan Community College-Kansas City (about 11 miles; Kansas City, MO; FT enrollment: 12,834)
University of Missouri-Kansas City (about 13 miles; Kansas City, MO; FT enrollment: 10,544)
Rockhurst University (about 13 miles; Kansas City, MO; FT enrollment: 2,013)
Kansas City Kansas Community College (about 15 miles; Kansas City, KS; FT enrollment: 4,718)
Wright Career College (about 21 miles; Overland Park, KS; FT enrollment: 3,107)
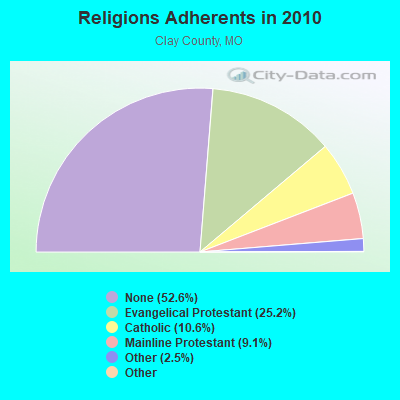
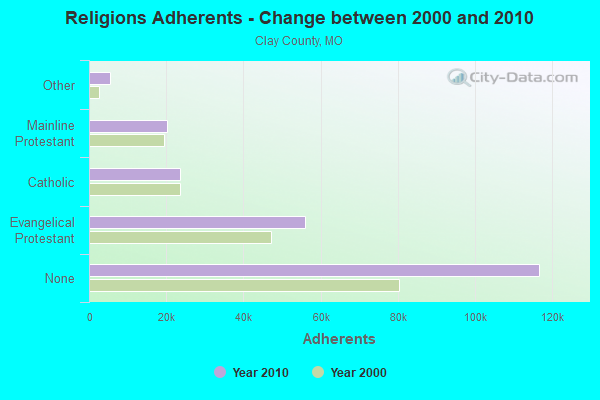
Religion statistics for Claycomo, MO (based on Clay County data)
Religion
Adherents
Congregations
Evangelical Protestant
55,953
140
Catholic
23,511
9
Mainline Protestant
20,193
41
Other
5,454
23
Black Protestant
125
1
Orthodox
44
1
None
116,659
-
Source: Clifford Grammich, Kirk Hadaway, Richard Houseal, Dale E.Jones, Alexei Krindatch, Richie Stanley and Richard H.Taylor. 2012. 2010 U.S.Religion Census: Religious Congregations & Membership Study. Association of Statisticians of American Religious Bodies. Jones, Dale E., et al. 2002. Congregations and Membership in the United States 2000. Nashville, TN: Glenmary Research Center. Graphs represent county-level data
Mikhail Raznobriadsev, Ne Vivion Road (Lat: 39.197889 Lon: -94.504500), Type: 38.1, Structure height: 29047 m, Overall height: 36.6 m, Registrant: Mo Network Utility Transport, LLC, Mraznobriadsev@mobilitie.Com, , Atlan-ta, Phone: (404) 978-2457
Mikhail Raznobriadsev, Ne Vivion Road, Type: 38.1, Structure height: 29047 m, Overall height: 36.6 m, Registrant: Mo Network Utility Transport, LLC, Mraznobriadsev@mobilitie.Com, , Atlan-ta, Phone: (404) 978-2457
Mikhail Raznobriadsev, Ne Vivion Road (Lat: 39.197889 Lon: -94.504500), Type: 38.1, Structure height: 29047 m, Overall height: 36.6 m, Registrant: Mo Network Utility Transport, LLC, Mraznobriadsev@mobilitie.Com, , Atlan-ta, Phone: (404) 978-2457
FCC Registered Broadcast Land Mobile Towers:
7
Us 69 Hwy N (Lat: 39.205556 Lon: -94.475222), Type: Building, Structure height: 18 m, Overall height: 21 m, Call Sign: KTL828, Assigned Frequencies: 465.000 MHz, Grant Date: 11/05/1996, Expiration Date: 11/05/2001, Cancellation Date: 04/14/2002, Certifier: David Berndt, Registrant: Motorola, 1270 Fairfield Rd, Gettysburg, PA 17325, Fax: (717) 334-9588
Us Hwy 69 & Mo Rt 10 (Lat: 39.200833 Lon: -94.484111), Type: Building, Structure height: 15 m, Overall height: 19 m, Call Sign: WPLW889, Assigned Frequencies: 452.250 MHz, Grant Date: 01/11/2003, Expiration Date: 03/26/2013, Cancellation Date: 03/13/2013, Certifier: Bruce Reichmann, Registrant: Ford Motor Company, 1333 Fairlane Circle Drive, Allen Park, MI 48195, Phone: (313) 323-1418, Fax: (313) 594-3886, Email:
Lat: 39.203889 Lon: -94.481889, Call Sign: WSU517, Assigned Frequencies: 467.350 MHz, Grant Date: 09/10/2003, Expiration Date: 11/18/2013, Cancellation Date: 05/15/2013, Registrant: Ford Motor Company, 1333 Fairlane Circle Drive, Allen Park, MI 48195, Phone: (313) 323-1418, Fax: (313) 594-3886, Email:
Us 69 Hwy N (Lat: 39.205556 Lon: -94.475222), Type: Bant, Structure height: 18 m, Overall height: 21 m, Call Sign: WPVA870, Assigned Frequencies: 465.000 MHz, Grant Date: 04/06/2022, Expiration Date: 06/10/2032, Certifier: Jeffrey Forrester, Registrant: Ford Motor Company, 1525 Fairlane Circle, Allen Park, MI 48101, Phone: (313) 621-7687, Email:
Us 69 Hwy N (Lat: 39.205556 Lon: -94.475222), Type: Bant, Structure height: 21 m, Call Sign: WPWL475, Assigned Frequencies: 465.000 MHz, Grant Date: 12/13/2002, Expiration Date: 12/13/2012, Cancellation Date: 02/16/2013, Certifier: Jeffrey S Forrester, Registrant: Ford Motor Company, 1333 Fairlane Circle Drive, Allen Park, MI 48195, Phone: (313) 323-1418, Fax: (313) 594-3886, Email:
290 E Highway 69 (Lat: 39.200000 Lon: -94.484167), Call Sign: WPWY720, Assigned Frequencies: 469.212 MHz, 469.037 MHz, 469.237 MHz, 469.062 MHz, 469.262 MHz, 469.087 MHz, 469.287 MHz, 469.112 MHz, 469.312 MHz, 469.137 MHz... (+21 more), Grant Date: 02/11/2003, Expiration Date: 02/11/2013, Cancellation Date: 04/13/2013, Certifier: Michael J Reichert, Registrant: Panasonic Information Systems Company, 1707 N Randall Road E1-D9, Elgin, IL 60123-7847, Phone: (847) 468-5318, Fax: (847) 468-5331, Email:
Call Sign: N0MVK, Licensee ID: L00171620, Grant Date: 09/12/1994, Expiration Date: 01/15/2001, Cancellation Date: 01/16/2003, Registrant: William C Goldberg, 37 N Emmerson, Claycomo, MO 64119
Call Sign: N0RAJ, Grant Date: 02/04/1992, Expiration Date: 02/04/2002, Cancellation Date: 02/05/2004, Registrant: David A Ruckel, 439 E Whittier, Claycomo, MO 64119
Call Sign: KC0OGH, Licensee ID: L00583568, Grant Date: 05/31/2013, Expiration Date: 05/31/2023, Cancellation Date: 02/07/2023, Certifier: Justin L Wildmon, Registrant: Justin L Wildmon, 451 E Park Ave, Claycomo, MO 64119
Call Sign: KC0RWD, Licensee ID: L00831399, Grant Date: 02/11/2014, Expiration Date: 03/16/2024, Certifier: Timothy L Cott, Registrant: Timothy L Cott, 17 N Drake Cir, Claycomo, MO 64119
Call Sign: KC0YZF, Licensee ID: L01217796, Grant Date: 11/11/2016, Expiration Date: 11/28/2026, Certifier: Arthur L Mack, Registrant: Arthur L Mack, 230 N Bryant St, Claycomo, MO 64119
Call Sign: N0AOA, Previous Call Sign: KC0OGH, Licensee ID: L00583568, Grant Date: 02/07/2023, Expiration Date: 02/07/2033, Certifier: Justin L Wildmon, Registrant: Justin L Wildmon, 451 E Park Ave, Claycomo, MO 64119
Home Mortgage Disclosure Act Aggregated Statistics For Year 2009 (Based on 2 partial tracts)
A) FHA, FSA/RHS & VA Home Purchase Loans
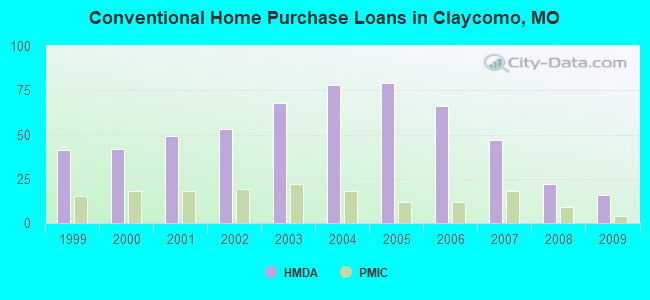
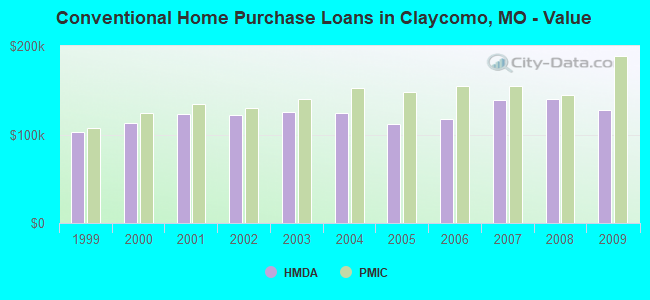
B) Conventional Home Purchase Loans
C) Refinancings
D) Home Improvement Loans
F) Non-occupant Loans on < 5 Family Dwellings (A B C & D)
G) Loans On Manufactured Home Dwelling (A B C & D)
Number
Average Value
Number
Average Value
Number
Average Value
Number
Average Value
Number
Average Value
Number
Average Value
LOANS ORIGINATED
20
$139,710
16
$127,898
87
$149,420
3
$42,423
5
$110,208
1
$21,490
APPLICATIONS APPROVED, NOT ACCEPTED
1
$71,370
2
$116,930
7
$161,090
1
$5,870
0
$0
0
$0
APPLICATIONS DENIED
3
$114,017
2
$114,115
21
$151,915
3
$22,620
1
$63,730
0
$0
APPLICATIONS WITHDRAWN
2
$135,420
1
$153,040
19
$150,843
1
$28,140
0
$0
0
$0
FILES CLOSED FOR INCOMPLETENESS
0
$0
0
$0
3
$142,493
0
$0
0
$0
0
$0
Aggregated Statistics For Year 2008 (Based on 2 partial tracts)
A) FHA, FSA/RHS & VA Home Purchase Loans
B) Conventional Home Purchase Loans
C) Refinancings
D) Home Improvement Loans
F) Non-occupant Loans on < 5 Family Dwellings (A B C & D)
Number
Average Value
Number
Average Value
Number
Average Value
Number
Average Value
Number
Average Value
LOANS ORIGINATED
13
$141,065
22
$140,223
45
$143,002
5
$35,222
6
$90,153
APPLICATIONS APPROVED, NOT ACCEPTED
0
$0
2
$120,065
5
$134,616
1
$52,050
0
$0
APPLICATIONS DENIED
2
$139,590
2
$136,330
31
$149,713
5
$31,126
1
$58,260
APPLICATIONS WITHDRAWN
1
$173,000
1
$156,490
10
$147,815
1
$55,150
0
$0
FILES CLOSED FOR INCOMPLETENESS
0
$0
0
$0
3
$148,023
0
$0
0
$0
Aggregated Statistics For Year 2007 (Based on 2 partial tracts)
A) FHA, FSA/RHS & VA Home Purchase Loans
B) Conventional Home Purchase Loans
C) Refinancings
D) Home Improvement Loans
F) Non-occupant Loans on < 5 Family Dwellings (A B C & D)
G) Loans On Manufactured Home Dwelling (A B C & D)
Number
Average Value
Number
Average Value
Number
Average Value
Number
Average Value
Number
Average Value
Number
Average Value
LOANS ORIGINATED
3
$147,267
47
$139,008
54
$124,480
9
$37,027
7
$115,320
1
$40,950
APPLICATIONS APPROVED, NOT ACCEPTED
1
$83,810
6
$100,472
15
$126,768
1
$28,630
1
$49,750
0
$0
APPLICATIONS DENIED
0
$0
5
$150,940
42
$138,014
8
$67,486
1
$80,610
0
$0
APPLICATIONS WITHDRAWN
0
$0
3
$131,223
20
$132,540
2
$144,495
1
$52,440
0
$0
FILES CLOSED FOR INCOMPLETENESS
0
$0
1
$184,280
3
$154,457
0
$0
0
$0
0
$0
Aggregated Statistics For Year 2006 (Based on 2 partial tracts)
A) FHA, FSA/RHS & VA Home Purchase Loans
B) Conventional Home Purchase Loans
C) Refinancings
D) Home Improvement Loans
F) Non-occupant Loans on < 5 Family Dwellings (A B C & D)
G) Loans On Manufactured Home Dwelling (A B C & D)
Number
Average Value
Number
Average Value
Number
Average Value
Number
Average Value
Number
Average Value
Number
Average Value
LOANS ORIGINATED
3
$140,040
66
$117,441
60
$115,130
9
$38,048
13
$101,335
1
$60,410
APPLICATIONS APPROVED, NOT ACCEPTED
0
$0
6
$117,333
15
$109,527
1
$47,390
2
$91,335
0
$0
APPLICATIONS DENIED
0
$0
9
$117,236
40
$121,068
9
$65,383
2
$94,630
1
$27,050
APPLICATIONS WITHDRAWN
1
$69,580
10
$122,191
32
$127,532
2
$76,135
1
$140,350
0
$0
FILES CLOSED FOR INCOMPLETENESS
0
$0
2
$113,350
9
$121,630
0
$0
1
$75,490
0
$0
Aggregated Statistics For Year 2005 (Based on 2 partial tracts)
A) FHA, FSA/RHS & VA Home Purchase Loans
B) Conventional Home Purchase Loans
C) Refinancings
D) Home Improvement Loans
F) Non-occupant Loans on < 5 Family Dwellings (A B C & D)
G) Loans On Manufactured Home Dwelling (A B C & D)
Number
Average Value
Number
Average Value
Number
Average Value
Number
Average Value
Number
Average Value
Number
Average Value
LOANS ORIGINATED
5
$158,240
79
$111,711
88
$117,545
6
$42,850
19
$100,836
1
$62,170
APPLICATIONS APPROVED, NOT ACCEPTED
0
$0
6
$109,380
11
$113,811
2
$28,830
0
$0
0
$0
APPLICATIONS DENIED
1
$75,940
12
$99,860
41
$129,514
10
$40,884
2
$110,605
2
$66,370
APPLICATIONS WITHDRAWN
0
$0
10
$121,145
38
$136,796
2
$97,905
4
$142,592
0
$0
FILES CLOSED FOR INCOMPLETENESS
0
$0
2
$90,015
7
$111,119
0
$0
0
$0
0
$0
Aggregated Statistics For Year 2004 (Based on 2 partial tracts)
A) FHA, FSA/RHS & VA Home Purchase Loans
B) Conventional Home Purchase Loans
C) Refinancings
D) Home Improvement Loans
F) Non-occupant Loans on < 5 Family Dwellings (A B C & D)
G) Loans On Manufactured Home Dwelling (A B C & D)
Number
Average Value
Number
Average Value
Number
Average Value
Number
Average Value
Number
Average Value
Number
Average Value
LOANS ORIGINATED
8
$132,108
78
$124,293
94
$118,083
9
$36,530
10
$92,323
0
$0
APPLICATIONS APPROVED, NOT ACCEPTED
0
$0
7
$112,380
17
$107,123
2
$13,345
1
$90,080
2
$23,790
APPLICATIONS DENIED
1
$145,290
9
$119,434
34
$131,196
6
$37,040
2
$131,225
1
$18,870
APPLICATIONS WITHDRAWN
0
$0
5
$118,306
32
$117,396
2
$48,015
2
$102,785
0
$0
FILES CLOSED FOR INCOMPLETENESS
0
$0
1
$76,220
7
$124,339
0
$0
0
$0
0
$0
Aggregated Statistics For Year 2003 (Based on 2 partial tracts)
A) FHA, FSA/RHS & VA Home Purchase Loans
B) Conventional Home Purchase Loans
C) Refinancings
D) Home Improvement Loans
E) Loans on Dwellings For 5+ Families
F) Non-occupant Loans on < 5 Family Dwellings (A B C & D)
Number
Average Value
Number
Average Value
Number
Average Value
Number
Average Value
Number
Average Value
Number
Average Value
LOANS ORIGINATED
10
$134,011
68
$125,232
198
$119,494
4
$22,030
1
$88,570
11
$89,379
APPLICATIONS APPROVED, NOT ACCEPTED
0
$0
3
$208,823
17
$116,614
1
$19,690
0
$0
0
$0
APPLICATIONS DENIED
0
$0
7
$103,793
48
$111,050
3
$32,357
0
$0
3
$72,633
APPLICATIONS WITHDRAWN
1
$114,920
6
$125,850
32
$120,365
1
$12,970
0
$0
1
$101,740
FILES CLOSED FOR INCOMPLETENESS
0
$0
2
$94,755
7
$117,353
0
$0
0
$0
0
$0
Aggregated Statistics For Year 2002 (Based on 2 partial tracts)
A) FHA, FSA/RHS & VA Home Purchase Loans
B) Conventional Home Purchase Loans
C) Refinancings
D) Home Improvement Loans
F) Non-occupant Loans on < 5 Family Dwellings (A B C & D)
Number
Average Value
Number
Average Value
Number
Average Value
Number
Average Value
Number
Average Value
LOANS ORIGINATED
11
$121,068
53
$121,951
156
$117,824
3
$19,590
10
$103,850
APPLICATIONS APPROVED, NOT ACCEPTED
0
$0
4
$79,895
15
$110,839
1
$22,230
1
$104,700
APPLICATIONS DENIED
0
$0
4
$87,812
35
$97,914
3
$19,263
1
$83,430
APPLICATIONS WITHDRAWN
1
$83,550
4
$124,535
27
$104,257
2
$33,935
1
$72,980
FILES CLOSED FOR INCOMPLETENESS
0
$0
1
$75,530
8
$122,575
0
$0
0
$0
Aggregated Statistics For Year 2001 (Based on 2 partial tracts)
A) FHA, FSA/RHS & VA Home Purchase Loans
B) Conventional Home Purchase Loans
C) Refinancings
D) Home Improvement Loans
F) Non-occupant Loans on < 5 Family Dwellings (A B C & D)
Number
Average Value
Number
Average Value
Number
Average Value
Number
Average Value
Number
Average Value
LOANS ORIGINATED
14
$115,802
49
$122,694
113
$112,272
9
$35,922
8
$87,048
APPLICATIONS APPROVED, NOT ACCEPTED
0
$0
3
$84,810
9
$94,111
2
$9,195
0
$0
APPLICATIONS DENIED
1
$70,170
4
$89,065
30
$92,336
4
$19,000
1
$91,440
APPLICATIONS WITHDRAWN
1
$70,490
4
$131,968
24
$98,437
1
$26,470
1
$101,800
FILES CLOSED FOR INCOMPLETENESS
0
$0
1
$128,690
7
$100,824
1
$22,610
0
$0
Aggregated Statistics For Year 2000 (Based on 2 partial tracts)
A) FHA, FSA/RHS & VA Home Purchase Loans
B) Conventional Home Purchase Loans
C) Refinancings
D) Home Improvement Loans
F) Non-occupant Loans on < 5 Family Dwellings (A B C & D)
Number
Average Value
Number
Average Value
Number
Average Value
Number
Average Value
Number
Average Value
LOANS ORIGINATED
14
$111,059
42
$112,469
25
$83,827
6
$20,300
4
$87,972
APPLICATIONS APPROVED, NOT ACCEPTED
0
$0
3
$93,943
6
$67,132
3
$14,487
0
$0
APPLICATIONS DENIED
1
$95,180
6
$77,045
12
$82,092
3
$18,547
0
$0
APPLICATIONS WITHDRAWN
1
$102,330
3
$135,897
8
$78,408
0
$0
0
$0
FILES CLOSED FOR INCOMPLETENESS
0
$0
1
$173,850
4
$117,265
0
$0
0
$0
Aggregated Statistics For Year 1999 (Based on 2 partial tracts)
A) FHA, FSA/RHS & VA Home Purchase Loans
B) Conventional Home Purchase Loans
C) Refinancings
D) Home Improvement Loans
F) Non-occupant Loans on < 5 Family Dwellings (A B C & D)
Detailed PMIC statistics for the following Tracts:0208.01
, 0208.02
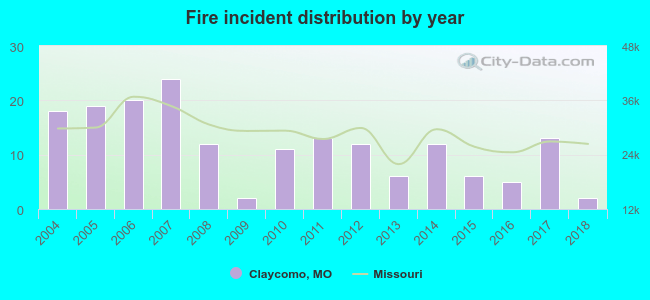
2004 - 2018 National Fire Incident Reporting System (NFIRS) incidents
According to the data from the years 2004 - 2018 the average number of fire incidents per year is 12. The highest number of reported fire incidents - 24 took place in 2007, and the least - 2 in 2009. The data has a declining trend.
When looking into fire subcategories, the most reports belonged to: Structure Fires (37.7%), and Outside Fires (29.1%).
Fire incident types reported to NFIRS in Claycomo, MO
#60 on the list of "Top 101 cities with the largest percentage of people in schools, hospitals, or wards for the mentally retarded (population 1,000+)"
#19 on the list of "Top 101 counties with the lowest percentage of residents relocating from foreign countries between 2010 and 2011"
#41 on the list of "Top 101 counties with the highest surface withdrawal of fresh water for public supply"
#48 on the list of "Top 101 counties with the highest total withdrawal of fresh water for public supply"
#60 on the list of "Top 101 counties with the highest Ozone (1-hour) air pollution readings in 2012 (ppm)"
#91 on the list of "Top 101 counties with the highest ground withdrawal of fresh water for public supply (pop. 50,000+)"


 Recent articles from our blog. Our writers, many of them Ph.D. graduates or candidates, create easy-to-read articles on a wide variety of topics.

 (9.3 miles


 According to the data from the years 2004 - 2018 the average number of fire incidents per year is 12. The highest number of reported fire incidents - 24 took place in 2007, and the least - 2 in 2009. The data has a declining trend.
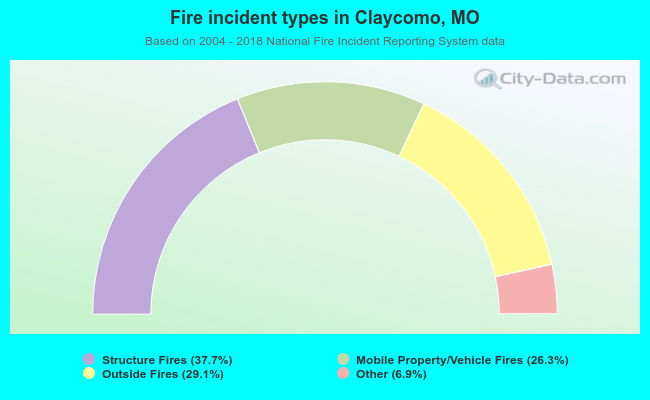 When looking into fire subcategories, the most reports belonged to: Structure Fires (37.7%), and Outside Fires (29.1%).