Percentage of residents living in poverty in 2022: 1.4%
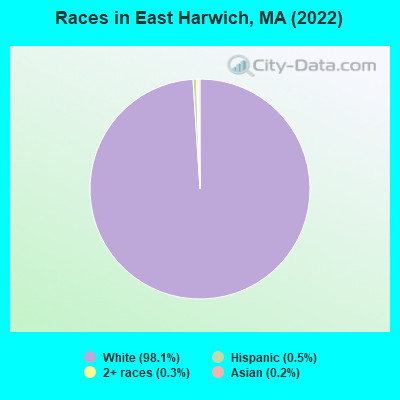
(1.4% for White Non-Hispanic residents, 100.0% for Black residents, 11.1% for Hispanic or Latino residents)
Ancestries: Irish (22.3%), English (16.9%), German (12.8%), American (9.5%), Italian (4.7%), Swedish (4.1%).
Current Local Time: EST time zone
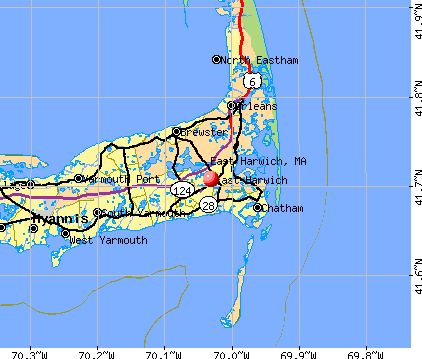
Elevation: 69 feet
Land area: 8.04 square miles.
Population density: 606 people per square mile (low).
410 residents are foreign born (4.7% Europe, 1.1% Asia).
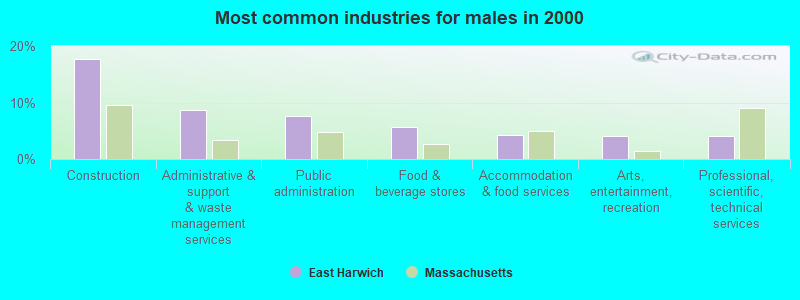
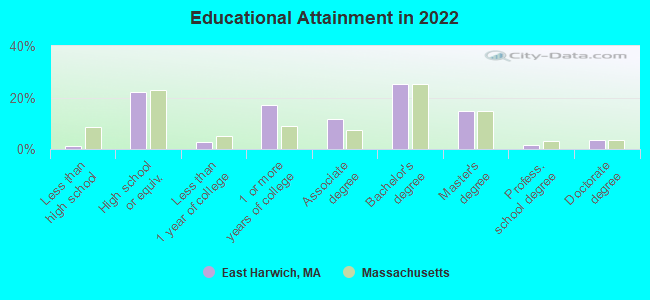
This place:
7.1%
Massachusetts:
17.6%
Median real estate property taxes paid for housing units with mortgages in 2022: $3,703 (0.5%) Median real estate property taxes paid for housing units with no mortgage in 2022: $4,423 (0.6%)
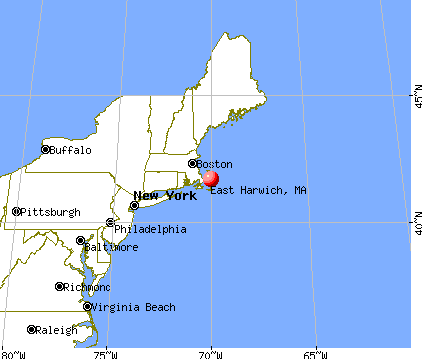
Nearest city with pop. 50,000+: New Bedford, MA (46.8 miles , pop. 93,768).
Nearest city with pop. 200,000+: Boston, MA (69.0 miles , pop. 589,141).
Nearest city with pop. 1,000,000+: Bronx, NY (208.4 miles , pop. 1,332,650).
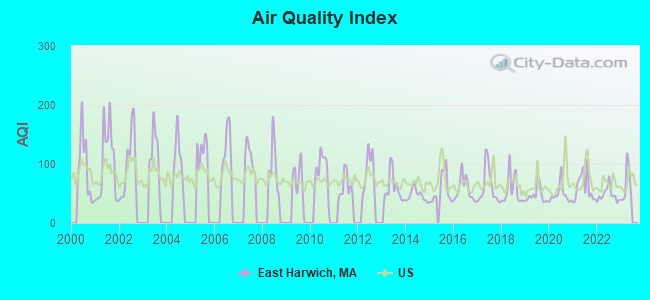
Air Quality Index (AQI) level in 2022 was 48.0. This is significantly better than average.
City:
48.0
U.S.:
72.6
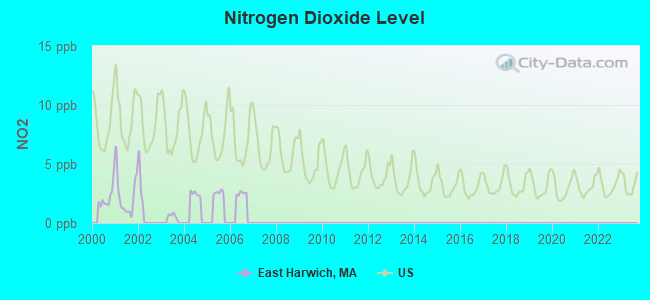
Nitrogen Dioxide (NO2) [ppb] level in 2001 was 2.30. This is significantly better than average.Closest monitor was 18.5 miles away from the city center.
City:
2.30
U.S.:
5.11
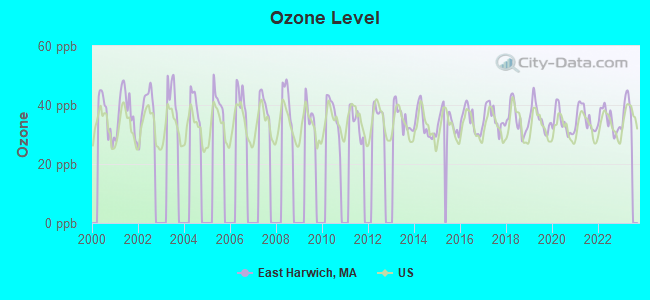
Ozone [ppb] level in 2022 was 34.8. This is about average.Closest monitor was 18.5 miles away from the city center.
City:
34.8
U.S.:
33.3
Earthquake activity:
East Harwich-area historical earthquake activity is significantly above Massachusetts state average. It is 78% smaller than the overall U.S. average.
On 10/16/2012 at 23:12:25, a magnitude 4.7 (4.7 ML, Depth: 10.0 mi, Class: Light, Intensity: IV - V) earthquake occurred 134.5 miles away from East Harwich center On 1/19/1982 at 00:14:42, a magnitude 4.7 (4.5 MB, 4.7 MD, 4.5 LG) earthquake occurred 147.4 miles away from East Harwich center On 4/20/2002 at 10:50:47, a magnitude 5.3 (5.3 ML, Depth: 3.0 mi, Class: Moderate, Intensity: VI - VII) earthquake occurred 268.1 miles away from the city center On 10/7/1983 at 10:18:46, a magnitude 5.3 (5.1 MB, 5.3 LG, 5.1 ML) earthquake occurred 268.1 miles away from the city center On 8/22/1992 at 12:20:32, a magnitude 4.8 (4.8 MB, 3.8 MS, 4.7 LG, Depth: 6.2 mi) earthquake occurred 180.6 miles away from East Harwich center On 4/20/2002 at 10:50:47, a magnitude 5.2 (5.2 MB, 4.2 MS, 5.2 MW, 5.0 MW) earthquake occurred 267.6 miles away from the city center Magnitude types: regional Lg-wave magnitude (LG), body-wave magnitude (MB), duration magnitude (MD), local magnitude (ML), surface-wave magnitude (MS), moment magnitude (MW)
Natural disasters:
The number of natural disasters in Barnstable County (21) is greater than the US average (15). Major Disasters (Presidential) Declared: 11 Emergencies Declared: 8
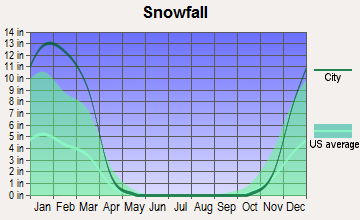
Causes of natural disasters: Hurricanes: 7, Floods: 5, Storms: 4, Snows: 3, Snowstorms: 3, Winter Storms: 3, Blizzards: 2, Snowfall: 1, Tropical Storm: 1, Wind: 1, Other: 1 (Note: some incidents may be assigned to more than one category).
Hospitals and medical centers near East Harwich:
PLEASANT BAY NURSING AND REHABILITATION (Nursing Home, about 3 miles away; BREWSTER, MA)
EPOCH SENIOR HEALTHCARE OF HARWICH (Nursing Home, about 3 miles away; HARWICH, MA)
BREWSTER MANOR NURSING RET HOME (Nursing Home, about 4 miles away; BREWSTER, MA)
EPOCH SENIOR HEALTHCARE OF BREWSTER (Nursing Home, about 4 miles away; BREWSTER, MA)
BROAD REACH HOSPICE (Hospital, about 4 miles away; NORTH CHATHAM, MA)
LIBERTY COMMONS (Nursing Home, about 4 miles away; NORTH CHATHAM, MA)
HOSPICE OF VNA OF CEN AND OUTER CAPE COD (Hospital, about 7 miles away; SOUTH DENNIS, MA)
Colleges/universities with over 2000 students nearest to East Harwich:
Cape Cod Community College (about 16 miles; West Barnstable, MA; Full-time enrollment: 2,491)
University of Massachusetts-Dartmouth (about 51 miles; North Dartmouth, MA; FT enrollment: 7,545)
Bridgewater State University (about 52 miles; Bridgewater, MA; FT enrollment: 9,802)
Massasoit Community College (about 56 miles; Brockton, MA; FT enrollment: 5,442)
Bristol Community College (about 57 miles; Fall River, MA; FT enrollment: 5,707)
Stonehill College (about 60 miles; Easton, MA; FT enrollment: 2,563)
Quincy College (about 63 miles; Quincy, MA; FT enrollment: 3,184)
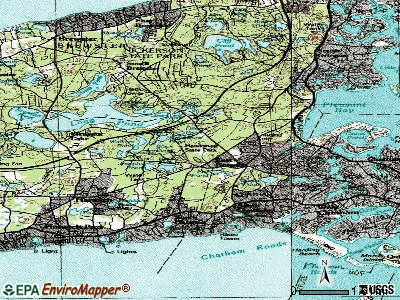
Notable locations in East Harwich: Harwich Fire Department Station 2 (A), Cape Cod Regional Technical High School Library (B), Bay Path Regional Vocational Technical High School Media Center (C). Display/hide their locations on the map
Barnstable County has a predicted average indoor radon screening level between 2 and 4 pCi/L (pico curies per liter) - Moderate Potential
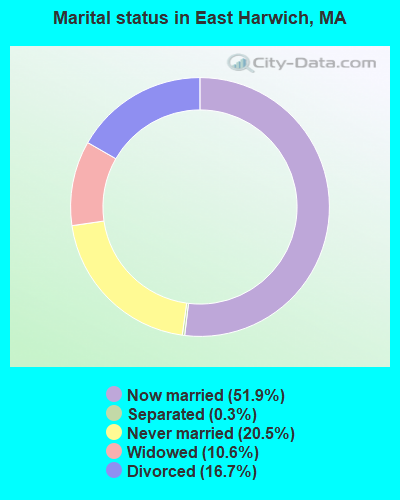
Average household size:
This place:
2.3 people
Massachusetts:
2.5 people
Percentage of family households:
This place:
68.0%
Whole state:
63.0%
Percentage of households with unmarried partners:
This place:
5.5%
Whole state:
7.0%
Likely homosexual households (counted as self-reported same-sex unmarried-partner households)
Lesbian couples: 1.1% of all households
Gay men: 0.7% of all households
9 people in residential treatment centers for adults in 2010
4 people in group homes intended for adults in 2010
6 people in schools, hospitals, or wards for the intellectually disabled in 2000
3 people in other nonhousehold living situations in 2000
Banks with branches in East Harwich (2011 data):
RBS Citizens, National Association: East Harwich Stop & Shop at 500 Chatham Rd., Rt 39 And 137, branch established on 2003/10/03. Info updated 2007/09/19: Bank assets: $106,940.6 mil, Deposits: $75,690.2 mil, headquarters in Providence, RI, positive income, 1135 total offices, Holding Company: Uk Financial Investments Limited
Cape Cod Co-operative Bank: Orleans Road Branch at 1470 Orleans Road, branch established on 2007/08/06. Info updated 2007/05/18: Bank assets: $642.6 mil, Deposits: $484.0 mil, headquarters in Yarmouth Port, MA, positive income, Mortgage Lending Specialization, 8 total offices, Holding Company: Coastal Affiliates, Mhc
The Cape Cod Five Cents Savings Bank: East Harwich Branch at 129 Route 137, branch established on 1993/04/17. Info updated 2006/11/03: Bank assets: $2,106.5 mil, Deposits: $1,831.3 mil, headquarters in Harwich Port, MA, positive income, Mortgage Lending Specialization, 17 total offices
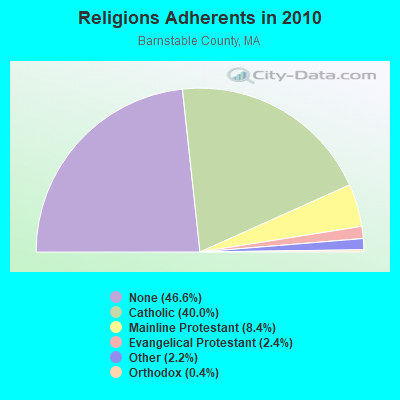
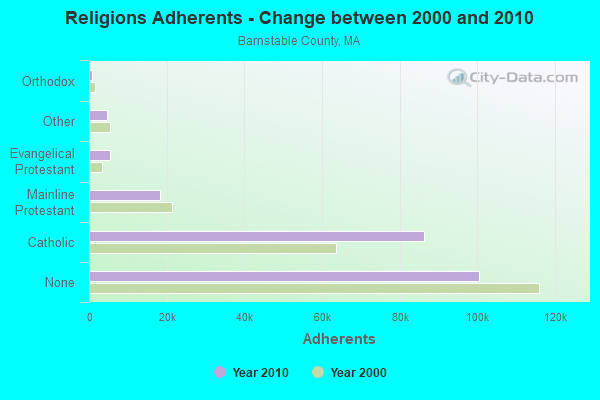
Religion statistics for East Harwich, MA (based on Barnstable County data)
Religion
Adherents
Congregations
Catholic
86,370
18
Mainline Protestant
18,165
68
Evangelical Protestant
5,281
46
Other
4,734
32
Orthodox
810
3
None
100,528
-
Source: Clifford Grammich, Kirk Hadaway, Richard Houseal, Dale E.Jones, Alexei Krindatch, Richie Stanley and Richard H.Taylor. 2012. 2010 U.S.Religion Census: Religious Congregations & Membership Study. Association of Statisticians of American Religious Bodies. Jones, Dale E., et al. 2002. Congregations and Membership in the United States 2000. Nashville, TN: Glenmary Research Center. Graphs represent county-level data
23,216Total future (year 2032) average daily traffic
FCC Registered Microwave Towers:
1
HARWICH WT, Orleans Harwich Rd. (Lat: 41.695028 Lon: -70.049917), Type: Tank, Structure height: 42.7 m, Overall height: 45 m, Call Sign: WPNH800, Assigned Frequencies: 6783.75 MHz, 6853.75 MHz, Grant Date: 03/17/2023, Expiration Date: 06/10/2033, Registrant: Massachusetts, Commonwealth Of Department Of State Police, 470 Worcester Rd, Framingham, MA 01702, Phone: (774) 462-3767, Email:
FCC Registered Amateur Radio Licenses:
7
Call Sign: KA1IR, Licensee ID: L00915322, Grant Date: 09/09/2004, Expiration Date: 12/06/2014, Cancellation Date: 12/07/2016, Certifier: John J Petersen, Registrant: John J Petersen, 20 Sugar Hill Dr, East Harwich, MA 02645
Call Sign: N1ECN, Grant Date: 01/30/1996, Expiration Date: 01/30/2006, Cancellation Date: 01/31/2008, Registrant: Arthur Heaton, 1 Stevens Way, East Harwich, MA 02645
Call Sign: N1EJZ, Licensee ID: L01158517, Grant Date: 06/02/2006, Expiration Date: 08/29/2016, Cancellation Date: 08/30/2018, Certifier: Thomas A Currie Sr, Registrant: Thomas A Currie Sr, 153 Clearwater Dr, East Harwich, MA 02645
Call Sign: W1BMW, Grant Date: 01/17/1989, Expiration Date: 01/17/1999, Cancellation Date: 01/18/2001, Registrant: Albert L Chesbro, 1661 Orleans Rd, East Harwich, MA 02645
Call Sign: W1JTL, Licensee ID: L00464614, Grant Date: 01/20/1999, Expiration Date: 01/20/2009, Cancellation Date: 01/21/2011, Certifier: Robert G Armstrong, Registrant: Robert G Armstrong, 26 Standish Woods Cir, East Harwich, MA 02645
Call Sign: W1VTX, Licensee ID: L00374712, Grant Date: 09/12/1997, Expiration Date: 09/12/2007, Cancellation Date: 09/15/2009, Registrant: Anthony Ross, 1685 Orleans Rd, East Harwich, MA 02645
Call Sign: W6DGD, Grant Date: 06/07/1988, Expiration Date: 06/07/1998, Cancellation Date: 06/09/2000, Registrant: John Wardell, 303 Route 137, East Harwich, MA 02645
FAA Registered Aircraft:
2
Aircraft: CESSNA 172M (Category: Land, Seats: 4, Weight: Up to 12,499 Pounds, Speed: 108 mph), Engine: LYCOMING 0-320 SERIES (180 HP) (4 Cycle) N-Number: 12849, N12849, N-12849, Serial Number: 17262311, Year manufactured: 1973, Airworthiness Date: 10/02/1973, Certificate Issue Date: 01/24/2020 Registrant (Partnership): Christopher J Ripa, Po Box 67, East Harwich, MA 02645, Other Owners: Pierre Norman L St
Aircraft: ONEGLIA FRANK G AIRDROME AEROPLANE (Category: Land, Weight: Up to 12,499 Pounds), Engine: ROTAX SEE BOMBADIER (Reciprocating) N-Number: 1653L, N1653L, N-1653L, Serial Number: AA02, Year manufactured: 2007, Airworthiness Date: 02/02/2008, Certificate Issue Date: 05/01/2007 Registrant (Individual): Frank G Oneglia, 66 Bay Rd, East Harwich, MA 02645 Deregistered:Cancel Date: 05/15/2017
Home Mortgage Disclosure Act Aggregated Statistics For Year 2009 (Based on 2 partial tracts)
A) FHA, FSA/RHS & VA Home Purchase Loans
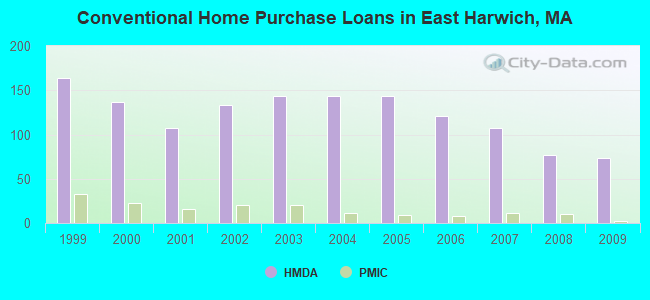
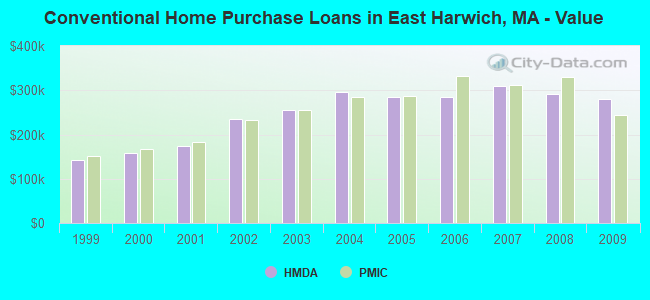
B) Conventional Home Purchase Loans
C) Refinancings
D) Home Improvement Loans
F) Non-occupant Loans on < 5 Family Dwellings (A B C & D)
Number
Average Value
Number
Average Value
Number
Average Value
Number
Average Value
Number
Average Value
LOANS ORIGINATED
8
$266,594
74
$280,410
308
$246,789
20
$166,853
150
$293,511
APPLICATIONS APPROVED, NOT ACCEPTED
0
$0
5
$315,008
13
$186,639
3
$41,097
7
$243,529
APPLICATIONS DENIED
1
$295,170
9
$327,001
57
$311,169
7
$143,396
25
$313,375
APPLICATIONS WITHDRAWN
2
$177,230
5
$254,952
31
$238,709
2
$133,970
14
$284,934
FILES CLOSED FOR INCOMPLETENESS
0
$0
3
$293,867
8
$295,495
0
$0
2
$346,930
Aggregated Statistics For Year 2008 (Based on 2 partial tracts)
A) FHA, FSA/RHS & VA Home Purchase Loans
B) Conventional Home Purchase Loans
C) Refinancings
D) Home Improvement Loans
F) Non-occupant Loans on < 5 Family Dwellings (A B C & D)
Number
Average Value
Number
Average Value
Number
Average Value
Number
Average Value
Number
Average Value
LOANS ORIGINATED
3
$266,757
77
$292,470
119
$291,540
21
$190,511
85
$352,808
APPLICATIONS APPROVED, NOT ACCEPTED
1
$187,790
9
$316,920
12
$385,998
2
$128,450
11
$436,675
APPLICATIONS DENIED
1
$266,560
7
$216,273
48
$323,307
7
$154,507
10
$327,271
APPLICATIONS WITHDRAWN
0
$0
5
$404,932
16
$303,100
2
$16,710
5
$435,030
FILES CLOSED FOR INCOMPLETENESS
0
$0
3
$388,893
6
$266,287
0
$0
3
$359,390
Aggregated Statistics For Year 2007 (Based on 2 partial tracts)
A) FHA, FSA/RHS & VA Home Purchase Loans
B) Conventional Home Purchase Loans
C) Refinancings
D) Home Improvement Loans
F) Non-occupant Loans on < 5 Family Dwellings (A B C & D)
Number
Average Value
Number
Average Value
Number
Average Value
Number
Average Value
Number
Average Value
LOANS ORIGINATED
1
$369,910
107
$309,414
154
$268,045
36
$162,627
91
$323,948
APPLICATIONS APPROVED, NOT ACCEPTED
0
$0
7
$267,069
22
$313,795
2
$97,070
5
$552,046
APPLICATIONS DENIED
1
$171,870
10
$281,578
69
$304,589
13
$169,468
15
$311,779
APPLICATIONS WITHDRAWN
0
$0
8
$344,696
33
$297,593
4
$108,825
8
$356,031
FILES CLOSED FOR INCOMPLETENESS
0
$0
2
$146,930
17
$236,714
0
$0
0
$0
Aggregated Statistics For Year 2006 (Based on 2 partial tracts)
A) FHA, FSA/RHS & VA Home Purchase Loans
B) Conventional Home Purchase Loans
C) Refinancings
D) Home Improvement Loans
F) Non-occupant Loans on < 5 Family Dwellings (A B C & D)
G) Loans On Manufactured Home Dwelling (A B C & D)
Number
Average Value
Number
Average Value
Number
Average Value
Number
Average Value
Number
Average Value
Number
Average Value
LOANS ORIGINATED
1
$339,510
121
$285,269
203
$245,736
50
$116,551
85
$318,683
1
$87,530
APPLICATIONS APPROVED, NOT ACCEPTED
0
$0
11
$254,702
20
$251,647
7
$120,889
12
$237,216
0
$0
APPLICATIONS DENIED
0
$0
13
$328,893
70
$266,233
23
$154,731
15
$350,633
0
$0
APPLICATIONS WITHDRAWN
0
$0
13
$332,063
50
$280,529
4
$64,660
10
$358,926
0
$0
FILES CLOSED FOR INCOMPLETENESS
0
$0
1
$263,380
7
$306,441
0
$0
0
$0
0
$0
Aggregated Statistics For Year 2005 (Based on 2 partial tracts)
A) FHA, FSA/RHS & VA Home Purchase Loans
B) Conventional Home Purchase Loans
C) Refinancings
D) Home Improvement Loans
E) Loans on Dwellings For 5+ Families
F) Non-occupant Loans on < 5 Family Dwellings (A B C & D)
Number
Average Value
Number
Average Value
Number
Average Value
Number
Average Value
Number
Average Value
Number
Average Value
LOANS ORIGINATED
1
$234,730
144
$284,476
222
$248,136
39
$144,515
1
$499,740
106
$300,920
APPLICATIONS APPROVED, NOT ACCEPTED
0
$0
10
$275,153
18
$257,983
4
$117,980
0
$0
8
$281,398
APPLICATIONS DENIED
0
$0
14
$297,666
69
$264,016
15
$146,699
0
$0
12
$353,728
APPLICATIONS WITHDRAWN
0
$0
12
$223,524
80
$241,513
16
$177,729
0
$0
9
$242,150
FILES CLOSED FOR INCOMPLETENESS
0
$0
1
$218,500
14
$450,829
0
$0
0
$0
2
$210,725
Aggregated Statistics For Year 2004 (Based on 2 partial tracts)
A) FHA, FSA/RHS & VA Home Purchase Loans
B) Conventional Home Purchase Loans
C) Refinancings
D) Home Improvement Loans
F) Non-occupant Loans on < 5 Family Dwellings (A B C & D)
Number
Average Value
Number
Average Value
Number
Average Value
Number
Average Value
Number
Average Value
LOANS ORIGINATED
0
$0
143
$295,559
277
$211,448
44
$141,101
140
$268,326
APPLICATIONS APPROVED, NOT ACCEPTED
0
$0
16
$255,716
27
$185,487
6
$54,143
14
$236,949
APPLICATIONS DENIED
1
$194,150
12
$209,524
48
$272,867
24
$70,948
8
$314,441
APPLICATIONS WITHDRAWN
0
$0
8
$208,632
90
$225,550
6
$143,223
5
$321,178
FILES CLOSED FOR INCOMPLETENESS
0
$0
4
$222,412
8
$368,045
0
$0
3
$337,353
Aggregated Statistics For Year 2003 (Based on 2 partial tracts)
A) FHA, FSA/RHS & VA Home Purchase Loans
B) Conventional Home Purchase Loans
C) Refinancings
D) Home Improvement Loans
E) Loans on Dwellings For 5+ Families
F) Non-occupant Loans on < 5 Family Dwellings (A B C & D)
Number
Average Value
Number
Average Value
Number
Average Value
Number
Average Value
Number
Average Value
Number
Average Value
LOANS ORIGINATED
1
$161,530
143
$255,086
710
$179,515
11
$108,713
1
$716,130
229
$221,263
APPLICATIONS APPROVED, NOT ACCEPTED
0
$0
12
$208,188
53
$169,556
2
$187,785
0
$0
18
$186,981
APPLICATIONS DENIED
1
$145,610
13
$228,727
64
$175,778
6
$81,238
0
$0
13
$249,045
APPLICATIONS WITHDRAWN
0
$0
8
$252,939
74
$187,563
1
$133,260
0
$0
12
$202,722
FILES CLOSED FOR INCOMPLETENESS
0
$0
2
$247,320
11
$181,052
0
$0
0
$0
2
$127,055
Aggregated Statistics For Year 2002 (Based on 2 partial tracts)
A) FHA, FSA/RHS & VA Home Purchase Loans
B) Conventional Home Purchase Loans
C) Refinancings
D) Home Improvement Loans
F) Non-occupant Loans on < 5 Family Dwellings (A B C & D)
Number
Average Value
Number
Average Value
Number
Average Value
Number
Average Value
Number
Average Value
LOANS ORIGINATED
1
$110,600
133
$234,478
500
$164,020
17
$42,685
173
$218,047
APPLICATIONS APPROVED, NOT ACCEPTED
0
$0
15
$275,655
32
$184,820
5
$40,334
16
$221,862
APPLICATIONS DENIED
0
$0
9
$169,976
46
$171,487
11
$34,793
9
$188,519
APPLICATIONS WITHDRAWN
0
$0
9
$223,439
53
$168,359
5
$44,560
10
$259,201
FILES CLOSED FOR INCOMPLETENESS
0
$0
1
$326,440
4
$243,555
0
$0
0
$0
Aggregated Statistics For Year 2001 (Based on 2 partial tracts)
A) FHA, FSA/RHS & VA Home Purchase Loans
B) Conventional Home Purchase Loans
C) Refinancings
D) Home Improvement Loans
E) Loans on Dwellings For 5+ Families
F) Non-occupant Loans on < 5 Family Dwellings (A B C & D)
Number
Average Value
Number
Average Value
Number
Average Value
Number
Average Value
Number
Average Value
Number
Average Value
LOANS ORIGINATED
1
$113,790
107
$174,619
325
$157,796
21
$41,974
1
$1,241,290
96
$198,920
APPLICATIONS APPROVED, NOT ACCEPTED
0
$0
7
$141,309
28
$154,459
7
$48,433
0
$0
7
$179,081
APPLICATIONS DENIED
0
$0
8
$158,670
42
$137,001
12
$39,249
0
$0
8
$164,438
APPLICATIONS WITHDRAWN
0
$0
10
$208,916
38
$129,942
5
$41,574
0
$0
3
$154,070
FILES CLOSED FOR INCOMPLETENESS
0
$0
1
$314,880
6
$195,640
0
$0
0
$0
0
$0
Aggregated Statistics For Year 2000 (Based on 2 partial tracts)
A) FHA, FSA/RHS & VA Home Purchase Loans
B) Conventional Home Purchase Loans
C) Refinancings
D) Home Improvement Loans
F) Non-occupant Loans on < 5 Family Dwellings (A B C & D)
Number
Average Value
Number
Average Value
Number
Average Value
Number
Average Value
Number
Average Value
LOANS ORIGINATED
6
$152,025
137
$158,059
99
$122,176
17
$29,406
61
$170,467
APPLICATIONS APPROVED, NOT ACCEPTED
0
$0
11
$187,577
14
$94,087
5
$26,824
4
$123,410
APPLICATIONS DENIED
2
$83,105
8
$152,860
40
$101,290
10
$36,424
4
$179,328
APPLICATIONS WITHDRAWN
0
$0
5
$229,312
31
$90,144
3
$68,393
2
$132,935
FILES CLOSED FOR INCOMPLETENESS
0
$0
0
$0
4
$80,010
1
$19,890
1
$193,160
Aggregated Statistics For Year 1999 (Based on 2 partial tracts)
A) FHA, FSA/RHS & VA Home Purchase Loans
B) Conventional Home Purchase Loans
C) Refinancings
D) Home Improvement Loans
F) Non-occupant Loans on < 5 Family Dwellings (A B C & D)


 Recent articles from our blog. Our writers, many of them Ph.D. graduates or candidates, create easy-to-read articles on a wide variety of topics.

 (46.8 miles