Fallon, Nevada
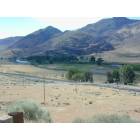
Fallon: Truckee River West of Fallon
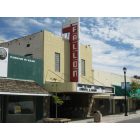
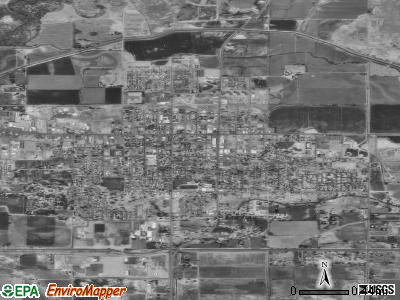
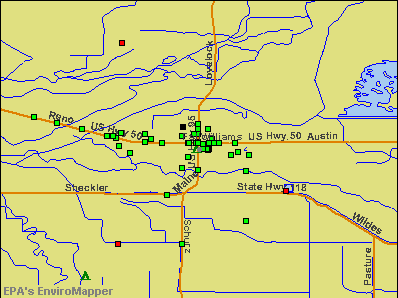
Fallon: Fallon, NV
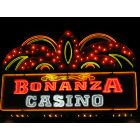
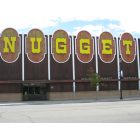
Fallon: Fallon, NV - Bonanza Casino
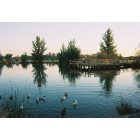
Fallon: Liberty Pond
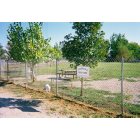
Fallon: Churchill County Dog Park
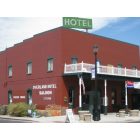
Fallon: Fallon, NV
Fallon: Fallon, NV
Fallon: Fallon, NV
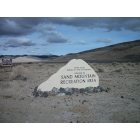
Fallon: Sand Mountain Park
Fallon: Fallon, NV - Depot Casino
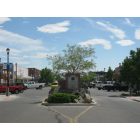
Fallon: W. Williams Ave (Hwy 50)
- see
14
more - add
your
Submit your own pictures of this city and show them to the world
- OSM Map
- General Map
- Google Map
- MSN Map
Population change since 2000: +25.3%
 |
| Males: 4,929 | |
| Females: 4,516 |
| Median resident age: | 37.8 years |
| Nevada median age: | 39.0 years |
Zip codes: 89406.
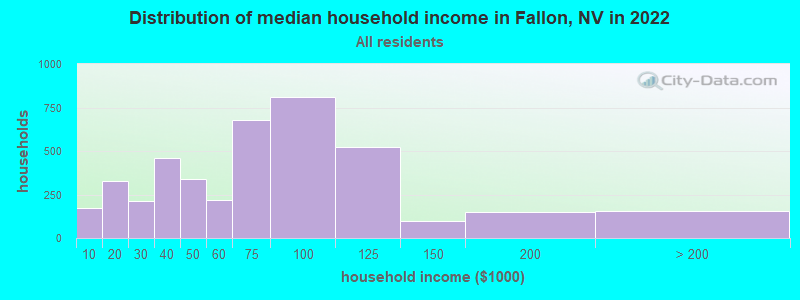
| Fallon: | $64,099 |
| NV: | $72,333 |
Estimated per capita income in 2022: $35,029 (it was $16,919 in 2000)
Fallon city income, earnings, and wages data
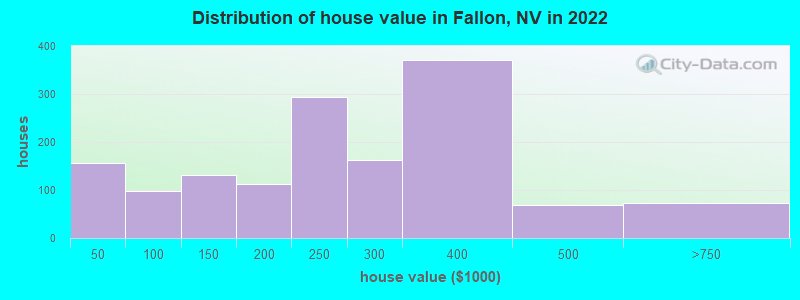
Estimated median house or condo value in 2022: $272,124 (it was $94,300 in 2000)
| Fallon: | $272,124 |
| NV: | $434,700 |
Mean prices in 2022: all housing units: $262,044; detached houses: $282,145; townhouses or other attached units: $187,852; mobile homes: $54,645
Median gross rent in 2022: $1,228.
(11.7% for White Non-Hispanic residents, 12.6% for Hispanic or Latino residents, 38.3% for American Indian residents, 10.4% for other race residents, 13.7% for two or more races residents)
Detailed information about poverty and poor residents in Fallon, NV


- 6,69070.7%White alone
- 1,06211.2%Hispanic
- 6266.6%Two or more races
- 4534.8%Asian alone
- 2592.7%Black alone
- 1061.1%American Indian alone
- 460.5%Other race alone
- 310.3%Native Hawaiian and Other
Pacific Islander alone
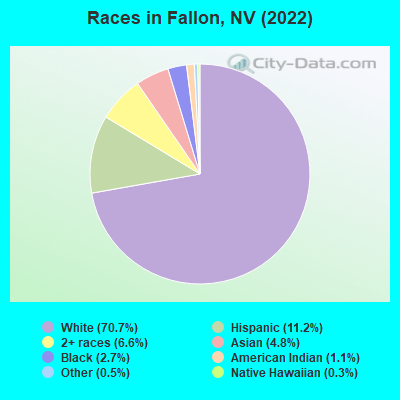
Races in Fallon detailed stats: ancestries, foreign born residents, place of birth
According to our research of Nevada and other state lists, there were 94 registered sex offenders living in Fallon, Nevada as of May 05, 2024.
The ratio of all residents to sex offenders in Fallon is 93 to 1.
Type |
2009 |
2010 |
2011 |
2012 |
2013 |
2014 |
2015 |
2016 |
2017 |
2018 |
2019 |
2020 |
2021 |
2022 |
|---|---|---|---|---|---|---|---|---|---|---|---|---|---|---|
| Murders (per 100,000) | 0 (0.0) | 0 (0.0) | 0 (0.0) | 0 (0.0) | 0 (0.0) | 0 (0.0) | 0 (0.0) | 0 (0.0) | 1 (11.8) | 1 (11.9) | 0 (0.0) | 0 (0.0) | 0 (0.0) | 1 (10.7) |
| Rapes (per 100,000) | 1 (11.6) | 2 (23.2) | 1 (11.5) | 1 (11.6) | 2 (23.8) | 10 (119.9) | 5 (60.3) | 0 (0.0) | 2 (23.7) | 2 (23.9) | 2 (23.6) | 2 (23.1) | 1 (11.4) | 1 (10.7) |
| Robberies (per 100,000) | 3 (34.9) | 8 (93.0) | 1 (11.5) | 6 (69.5) | 0 (0.0) | 1 (12.0) | 4 (48.2) | 2 (23.7) | 1 (11.8) | 2 (23.9) | 1 (11.8) | 5 (57.8) | 0 (0.0) | 0 (0.0) |
| Assaults (per 100,000) | 25 (291.1) | 19 (220.8) | 9 (103.7) | 16 (185.3) | 21 (249.7) | 21 (251.7) | 29 (349.7) | 15 (177.9) | 19 (224.9) | 15 (178.9) | 13 (153.3) | 15 (173.5) | 10 (114.1) | 14 (149.6) |
| Burglaries (per 100,000) | 64 (745.1) | 54 (627.5) | 53 (610.7) | 60 (695.0) | 63 (749.0) | 107 (1,283) | 39 (470.3) | 13 (154.2) | 9 (106.5) | 13 (155.1) | 10 (118.0) | 6 (69.4) | 10 (114.1) | 10 (106.8) |
| Thefts (per 100,000) | 268 (3,120) | 256 (2,975) | 281 (3,238) | 278 (3,220) | 285 (3,388) | 384 (4,603) | 288 (3,473) | 208 (2,467) | 271 (3,207) | 189 (2,255) | 223 (2,630) | 129 (1,492) | 130 (1,483) | 110 (1,175) |
| Auto thefts (per 100,000) | 8 (93.1) | 4 (46.5) | 19 (218.9) | 24 (278.0) | 17 (202.1) | 20 (239.8) | 10 (120.6) | 9 (106.7) | 13 (153.8) | 12 (143.1) | 8 (94.4) | 12 (138.8) | 10 (114.1) | 15 (160.3) |
| Arson (per 100,000) | 1 (11.6) | 2 (23.2) | 0 (0.0) | 0 (0.0) | 1 (11.9) | 2 (24.0) | 1 (12.1) | 0 (0.0) | 1 (11.8) | 3 (35.8) | 1 (11.8) | 1 (11.6) | 0 (0.0) | 0 (0.0) |
| City-Data.com crime index | 262.4 | 257.3 | 223.2 | 266.9 | 273.1 | 442.9 | 314.2 | 160.7 | 239.2 | 198.4 | 174.1 | 146.2 | 108.4 | 127.2 |
The City-Data.com crime index weighs serious crimes and violent crimes more heavily. Higher means more crime, U.S. average is 246.1. It adjusts for the number of visitors and daily workers commuting into cities.
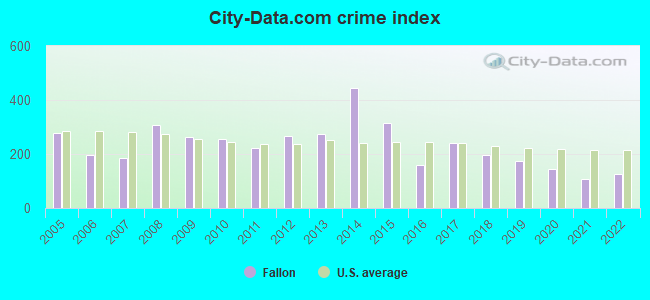
Crime rate in Fallon detailed stats: murders, rapes, robberies, assaults, burglaries, thefts, arson
Full-time law enforcement employees in 2021, including police officers: 37 (25 officers - 24 male; 1 female).
| Officers per 1,000 residents here: | 2.85 |
| Nevada average: | 2.61 |
 Recent articles from our blog. Our writers, many of them Ph.D. graduates or candidates, create easy-to-read articles on a wide variety of topics.

 | Northwest Bound! (282 replies) |
| Retiree moving to Reno/Sparks area (19 replies) |
| Breakdown of areas in Reno (45 replies) |
| "The lonelinest highway in the USA" (70 replies) |
| Fernley, NV livability (30 replies) |
| The Courtyard Cafe in Fallon (1 reply) |
Latest news from Fallon, NV collected exclusively by city-data.com from local newspapers, TV, and radio stations
Fallon, NV City Guides:
Ancestries: German (13.1%), American (10.7%), Irish (5.5%), English (5.4%), European (5.0%), Polish (3.0%).
Current Local Time: PST time zone
Incorporated in 1908
Elevation: 3963 feet
Land area: 3.05 square miles.
Population density: 3,101 people per square mile (average).
755 residents are foreign born (3.9% Latin America, 3.8% Asia).
| This city: | 8.0% |
| Nevada: | 19.1% |
Median real estate property taxes paid for housing units with mortgages in 2022: $1,744 (0.6%)
Median real estate property taxes paid for housing units with no mortgage in 2022: $1,571 (0.6%)
Nearest city with pop. 50,000+: Sparks, NV  (51.4 miles , pop. 66,346).
Nearest city with pop. 200,000+: Sacramento, CA (157.9 miles , pop. 407,018).
Nearest city with pop. 1,000,000+: Los Angeles, CA (373.2 miles , pop. 3,694,820).
Nearest cities:
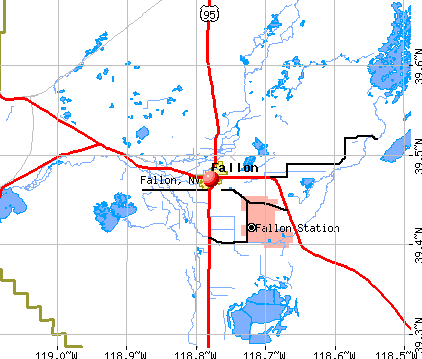
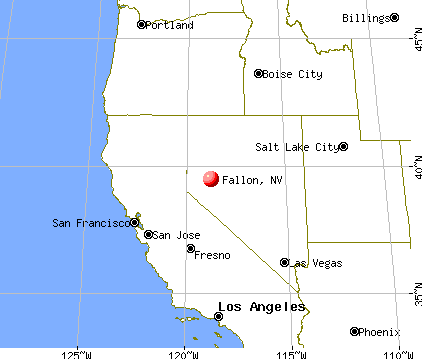
), ), ), )Latitude: 39.47 N, Longitude: 118.78 W
Daytime population change due to commuting: +1,459 (+15.4%)
Workers who live and work in this city: 3,178 (63.4%)
Area code: 775
Fallon, Nevada accommodation & food services, waste management - Economy and Business Data
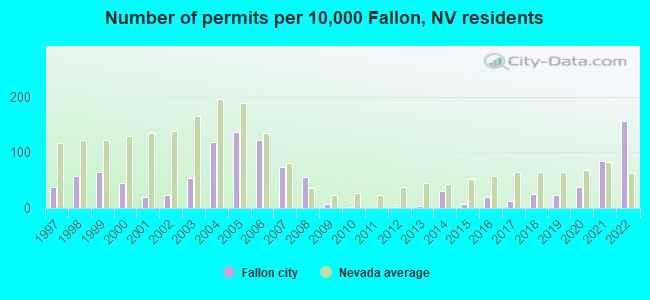
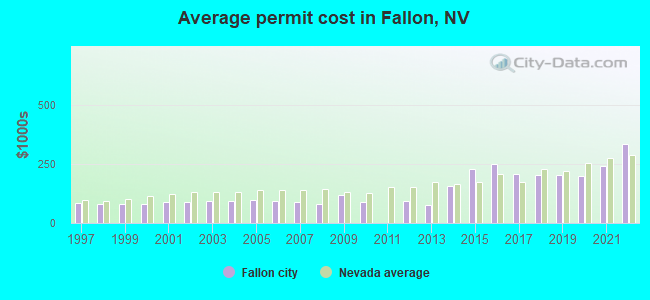
Single-family new house construction building permits:
- 2022: 118 buildings, average cost: $332,100
- 2021: 63 buildings, average cost: $239,500
- 2020: 28 buildings, average cost: $197,300
- 2019: 18 buildings, average cost: $202,900
- 2018: 19 buildings, average cost: $202,300
- 2017: 9 buildings, average cost: $206,400
- 2016: 15 buildings, average cost: $247,500
- 2015: 6 buildings, average cost: $226,100
- 2014: 23 buildings, average cost: $158,400
- 2013: 2 buildings, average cost: $77,300
- 2012: 1 building, cost: $91,400
- 2010: 1 building, cost: $90,400
- 2009: 5 buildings, average cost: $116,700
- 2008: 42 buildings, average cost: $79,500
- 2007: 56 buildings, average cost: $89,500
- 2006: 93 buildings, average cost: $93,400
- 2005: 103 buildings, average cost: $99,000
- 2004: 90 buildings, average cost: $93,900
- 2003: 40 buildings, average cost: $90,600
- 2002: 18 buildings, average cost: $87,300
- 2001: 15 buildings, average cost: $88,600
- 2000: 34 buildings, average cost: $79,700
- 1999: 49 buildings, average cost: $80,400
- 1998: 43 buildings, average cost: $79,400
- 1997: 28 buildings, average cost: $85,400
| Here: | 4.1% |
| Nevada: | 5.0% |
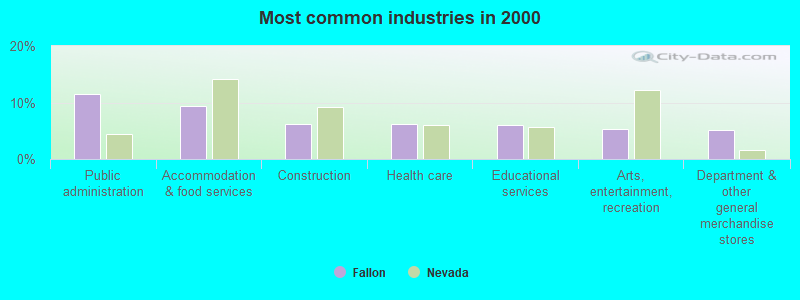
- Public administration (11.5%)
- Accommodation & food services (9.4%)
- Construction (6.3%)
- Health care (6.3%)
- Educational services (5.9%)
- Arts, entertainment, recreation (5.3%)
- Department & other general merchandise stores (5.1%)
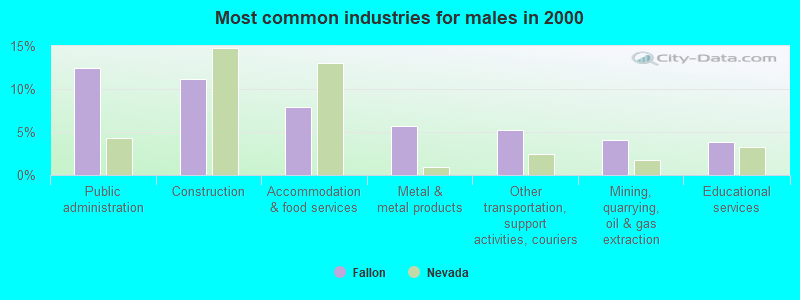
- Public administration (12.4%)
- Construction (11.1%)
- Accommodation & food services (7.9%)
- Metal & metal products (5.7%)
- Other transportation, support activities, couriers (5.2%)
- Mining, quarrying, oil & gas extraction (4.1%)
- Educational services (3.8%)
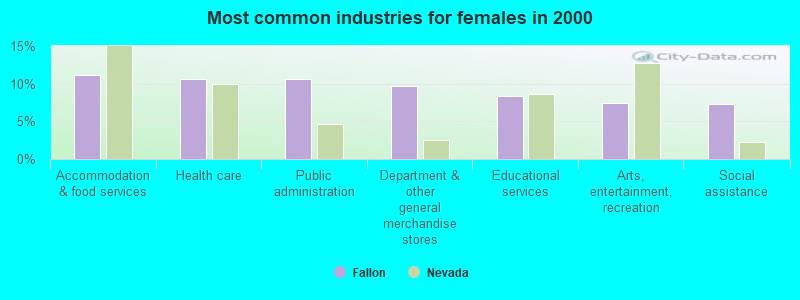
- Accommodation & food services (11.1%)
- Health care (10.7%)
- Public administration (10.6%)
- Department & other general merchandise stores (9.7%)
- Educational services (8.4%)
- Arts, entertainment, recreation (7.5%)
- Social assistance (7.3%)
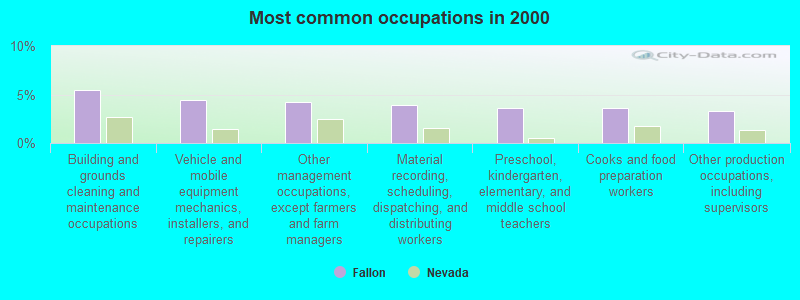
- Building and grounds cleaning and maintenance occupations (5.5%)
- Vehicle and mobile equipment mechanics, installers, and repairers (4.5%)
- Other management occupations, except farmers and farm managers (4.2%)
- Material recording, scheduling, dispatching, and distributing workers (3.9%)
- Preschool, kindergarten, elementary, and middle school teachers (3.6%)
- Cooks and food preparation workers (3.6%)
- Other production occupations, including supervisors (3.3%)
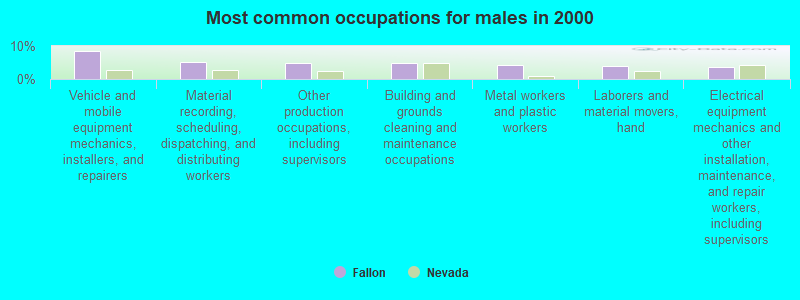
- Vehicle and mobile equipment mechanics, installers, and repairers (8.4%)
- Material recording, scheduling, dispatching, and distributing workers (5.1%)
- Other production occupations, including supervisors (4.7%)
- Building and grounds cleaning and maintenance occupations (4.7%)
- Metal workers and plastic workers (4.3%)
- Laborers and material movers, hand (3.9%)
- Electrical equipment mechanics and other installation, maintenance, and repair workers, including supervisors (3.8%)
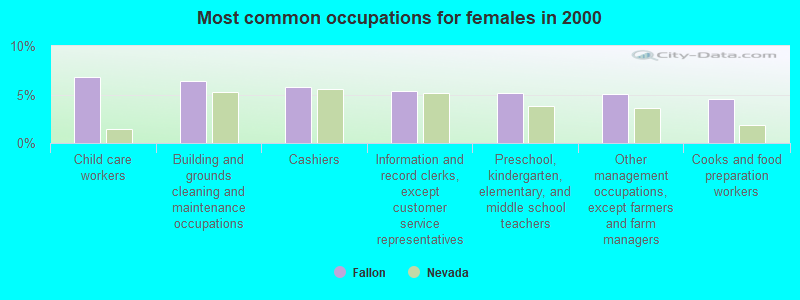
- Child care workers (6.8%)
- Building and grounds cleaning and maintenance occupations (6.4%)
- Cashiers (5.8%)
- Information and record clerks, except customer service representatives (5.3%)
- Preschool, kindergarten, elementary, and middle school teachers (5.2%)
- Other management occupations, except farmers and farm managers (5.0%)
- Cooks and food preparation workers (4.6%)
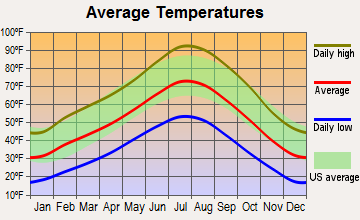
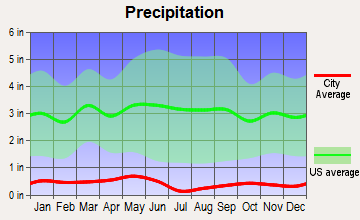
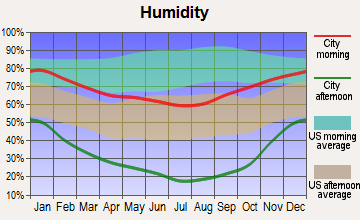
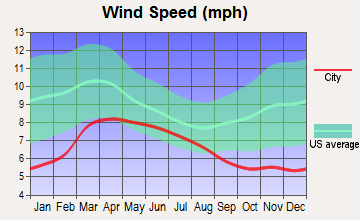
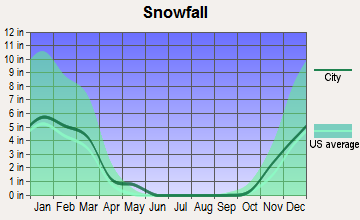
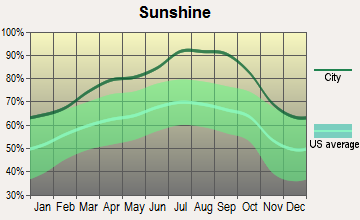
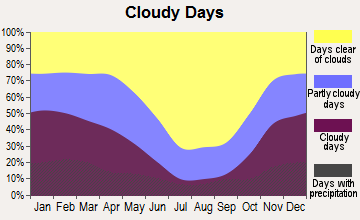
Average climate in Fallon, Nevada
Based on data reported by over 4,000 weather stations
|
|

(lower is better)
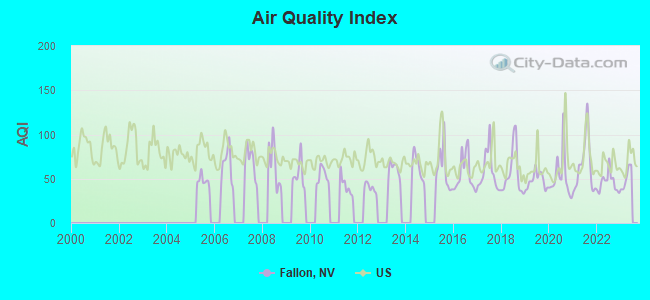
Air Quality Index (AQI) level in 2022 was 45.4. This is significantly better than average.
| City: | 45.4 |
| U.S.: | 72.6 |
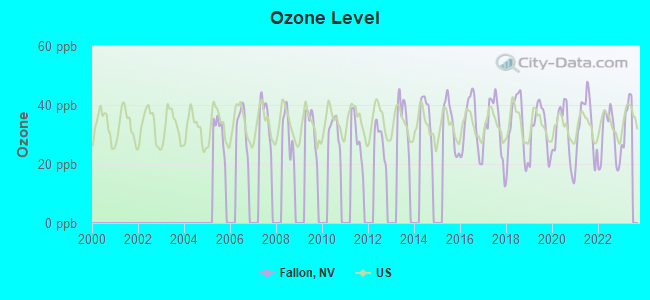
Ozone [ppb] level in 2022 was 28.7. This is about average. Closest monitor was 0.3 miles away from the city center.
| City: | 28.7 |
| U.S.: | 33.3 |
Earthquake activity:
Fallon-area historical earthquake activity is significantly above Nevada state average. It is 6517% greater than the overall U.S. average.Natural disasters:
The number of natural disasters in Churchill County (6) is a lot smaller than the US average (15).Major Disasters (Presidential) Declared: 1
Emergencies Declared: 3
Causes of natural disasters: Floods: 2, Snows: 2, Hurricane: 1, Mudslide: 1, Storm: 1, Winter Storm: 1, Other: 1 (Note: some incidents may be assigned to more than one category).

Hospitals and medical centers in Fallon:
Airports located in Fallon:
- Fallon Municipal Airport (FLX) (Runways: 2, Air Taxi Ops: 2,000, Itinerant Ops: 1,000, Local Ops: 3,200, Military Ops: 100)
- Darrow Field Airport (26NV) (Runways: 1)
- Dixie Valley Airport (NV30) (Runways: 1)
- Fallon Nas (Van Voorhis Fld) Airport (NFL) (Runways: 3)
- Fallon Southwest Airpark Airport (1NV1) (Runways: 1)
Colleges/universities with over 2000 students nearest to Fallon:
- Truckee Meadows Community College (about 55 miles; Reno, NV; Full-time enrollment: 6,919)
- University of Nevada-Reno (about 56 miles; Reno, NV; FT enrollment: 15,092)
- Western Nevada College (about 58 miles; Carson City, NV; FT enrollment: 2,338)
- Folsom Lake College (about 138 miles; Folsom, CA; FT enrollment: 5,308)
- Sierra College (about 139 miles; Rocklin, CA; FT enrollment: 11,488)
- American River College (about 150 miles; Sacramento, CA; FT enrollment: 20,452)
- Yuba College (about 150 miles; Marysville, CA; FT enrollment: 4,737)
Public high school in Fallon:
- CHURCHILL COUNTY HIGH SCHOOL (Location: 1222 SOUTH TAYLOR ST, Grades: 9-12)
Public elementary/middle schools in Fallon:
- OASIS ACADEMY (Location: 920 WEST WILLIAMS AVE STE 100, Grades: KG-8, Charter school)
- CHURCHILL COUNTY MIDDLE SCHOOL (Location: 650 SOUTH MAINE ST, Grades: 6-8)
- E C BEST ELEMENTARY SCHOOL (Location: 750 EAST WILLIAMS AVENUE, Grades: 1-5)
- LAHONTAN ELEMENTARY SCHOOL (Location: 1099 MERTON DRIVE, Grades: 1-5)
- NUMA ELEMENTARY (Location: 601 DISCOVERY DRIVE, Grades: 1-5)
Private elementary/middle schools in Fallon:
Points of interest:
Notable locations in Fallon: Fallon City Hall (A), Fallon / Churchill Volunteer Fire Department Station 1 (B), Churchill County Courthouse (C). Display/hide their locations on the map
Shopping Center: Frontier Village Shopping Center (1). Display/hide its location on the map
Park in Fallon: Oats Park (1). Display/hide its location on the map
Tourist attractions: Churchill County Museum (1050 South Maine Street), Babe Ruth Ball Park (Amusement & Theme Parks; 965 East Richards Street), R & R Limited (Amusement & Theme Parks; 1001 West Center Street), Churchill County Youth Softball (Amusement & Theme Parks; 376 North Maine Street), J & L Trailer Sales (Tours & Charters; 5030 Reno Highway).
Hotels: Comfort Inn Fallon (1830 West Williams Avenue), Fallon Lodge & Suites (390 West Williams Avenue), Oxbow Motor Inn (60 Allen Road), Comfort Inn (1830 West Williams Avenue), Overland Hotel (125 East Center Street), Best Western Fallon Inn (1035 West Williams Avenue), Motel 6 (1705 South Taylor Street), Value Inn (180 W Williams Ave), Econo Lodge Fallon (70 East Williams Avenue).
Courts: Churchill County Offices - District Court (73 North Maine Street Suite B), Churchill County Offices - Justice Court (71 North Maine Street).
Birthplace of: Martin Heinrich - Politician, Charles B. Fulton - Judge, Mike McGinness - Politician.
Drinking water stations with addresses in Fallon and their reported violations in the past:
FALLON CITY OF (Population served: 9,258, Groundwater):Past health violations:WASHOE LAKE STATE PARK (Address: STATE PARKS DIVISION , Population served: 467, Groundwater):Past monitoring violations:
- MCL, Monthly (TCR) - In DEC-2006, Contaminant: Coliform. Follow-up actions: St Public Notif requested (DEC-08-2006), St Violation/Reminder Notice (DEC-08-2006), St Compliance achieved (DEC-22-2006), St Public Notif received (DEC-22-2006)
- Initial Tap Sampling for Pb and Cu - In JAN-01-1993, Contaminant: Lead and Copper Rule
- 21 regular monitoring violations
Past health violations:OLD RIVER WATER COMPANY (Population served: 300, Groundwater):Past monitoring violations:
- MCL, Monthly (TCR) - In SEP-2006, Contaminant: Coliform. Follow-up actions: St Violation/Reminder Notice (NOV-17-2006), St Public Notif requested (NOV-17-2006)
- Monitoring, Repeat Major (TCR) - In SEP-2007, Contaminant: Coliform (TCR). Follow-up actions: St Violation/Reminder Notice (OCT-25-2007), St Public Notif requested (OCT-25-2007)
- One routine major monitoring violation
- 3 minor monitoring violations
- One regular monitoring violation
Past health violations:FORT CHURCHILL HISTORIC STATE PARK (Address: STATE PARKS DIVISION , Population served: 207, Groundwater):Past monitoring violations:
- MCL, Average - Between APR-2014 and JUN-2014, Contaminant: Arsenic. Follow-up actions: St Violation/Reminder Notice (JUL-24-2014), St Public Notif requested (JUL-24-2014)
- MCL, Average - Between JAN-2014 and MAR-2014, Contaminant: Arsenic. Follow-up actions: St Violation/Reminder Notice (MAY-20-2014), St Public Notif requested (MAY-20-2014)
- MCL, Average - Between OCT-2013 and DEC-2013, Contaminant: Arsenic. Follow-up actions: St AO (w/o penalty) issued (APR-29-2013), St Public Notif requested (FEB-13-2014), St Violation/Reminder Notice (FEB-13-2014)
- MCL, Average - Between JUL-2013 and SEP-2013, Contaminant: Arsenic. Follow-up actions: St AO (w/o penalty) issued (APR-29-2013), St Public Notif requested (NOV-05-2013), St Violation/Reminder Notice (NOV-05-2013)
- MCL, Average - Between APR-2013 and JUN-2013, Contaminant: Arsenic. Follow-up actions: St AO (w/o penalty) issued (APR-29-2013), St Public Notif requested (AUG-12-2013), St Violation/Reminder Notice (AUG-12-2013)
- MCL, Average - Between JAN-2013 and MAR-2013, Contaminant: Arsenic. Follow-up actions: St AO (w/o penalty) issued (APR-29-2013), St Public Notif requested (APR-30-2013), St Violation/Reminder Notice (APR-30-2013)
- 16 other older health violations
- Follow-up Or Routine LCR Tap M/R - In OCT-01-2000, Contaminant: Lead and Copper Rule. Follow-up actions: St Compliance achieved (JUN-06-2005)
- One routine major monitoring violation
- 2 regular monitoring violations
Past health violations:RYE PATCH STATE PARK (Population served: 199, Groundwater):Past monitoring violations:
- MCL, Monthly (TCR) - Between OCT-2006 and DEC-2006, Contaminant: Coliform. Follow-up actions: St Public Notif requested (DEC-21-2006), St Violation/Reminder Notice (DEC-21-2006), St Public Notif requested (JAN-24-2007), St Violation/Reminder Notice (JAN-24-2007)
- One regular monitoring violation
Past health violations:R AND M MOBILE HOME PARK (Population served: 130, Groundwater):Past monitoring violations:
- MCL, Monthly (TCR) - In FEB-2010, Contaminant: Coliform. Follow-up actions: St Public Notif requested (FEB-12-2010), St Violation/Reminder Notice (FEB-12-2010), St Compliance achieved (MAR-18-2010)
- MCL, Monthly (TCR) - In JAN-2010, Contaminant: Coliform. Follow-up actions: St Public Notif received (JAN-13-2010), St Compliance achieved (MAR-18-2010)
- One regular monitoring violation
Past health violations:FALLEN LEAF MUTUAL WATER CO (Serves CA, Population served: 100, Surface water):
- MCL, Monthly (TCR) - In JUN-2010, Contaminant: Coliform. Follow-up actions: St Public Notif requested (JUN-19-2010), St Violation/Reminder Notice (JUN-19-2010), St Compliance achieved (JUL-08-2010)
Past monitoring violations:CARSON RIVER ESTATES (Population served: 90, Groundwater):
- One routine major monitoring violation
Past health violations:Past monitoring violations:
- MCL, Average - Between JUL-2011 and SEP-2011, Contaminant: Arsenic. Follow-up actions: St Public Notif requested (NOV-14-2011), St Violation/Reminder Notice (NOV-14-2011), St Compliance achieved (JAN-01-2012)
- MCL, Average - Between APR-2011 and JUN-2011, Contaminant: Arsenic. Follow-up actions: St Compliance achieved (JAN-01-2012)
- MCL, Average - Between JAN-2011 and MAR-2011, Contaminant: Arsenic. Follow-up actions: St Compliance achieved (JAN-01-2012)
- MCL, Monthly (TCR) - In JUL-2006, Contaminant: Coliform. Follow-up actions: St Public Notif requested (AUG-04-2006), St Violation/Reminder Notice (AUG-04-2006), St Compliance achieved (AUG-09-2006)
- Monitoring and Reporting (DBP) - Between APR-2012 and JUN-2012, Contaminant: Chlorine. Follow-up actions: St Public Notif requested (SEP-20-2012), St Violation/Reminder Notice (SEP-20-2012), St Compliance achieved (2 times from SEP-27-2012 to SEP-27-2012)
- Follow-up Or Routine LCR Tap M/R - In OCT-01-2010, Contaminant: Lead and Copper Rule. Follow-up actions: St Public Notif requested (JUN-10-2011), St Violation/Reminder Notice (JUN-10-2011), St Compliance achieved (SEP-19-2011)
- Monitoring and Reporting (DBP) - Between JAN-2010 and DEC-2010, Contaminant: TTHM. Follow-up actions: St Public Notif requested (MAY-27-2011), St Violation/Reminder Notice (MAY-27-2011), St Compliance achieved (OCT-01-2011)
- Monitoring and Reporting (DBP) - Between JAN-2010 and DEC-2010, Contaminant: Total Haloacetic Acids (HAA5). Follow-up actions: St Public Notif requested (MAY-27-2011), St Violation/Reminder Notice (MAY-27-2011), St Compliance achieved (OCT-01-2011)
- Monitoring and Reporting (DBP) - Between APR-2009 and JUN-2009, Contaminant: Chlorine. Follow-up actions: St Compliance achieved (MAY-30-2010), St Public Notif requested (JUN-15-2010), St Violation/Reminder Notice (JUN-15-2010)
- 219 regular monitoring violations
- 6 other older monitoring violations
Drinking water stations with addresses in Fallon that have no violations reported:
- FALLON NAVAL AIR STATION (Address: NAVAL AIR STATION FALLON , Population served: 3,000, Primary Water Source Type: Groundwater)
- SAND CREEK (Population served: 953, Primary Water Source Type: Groundwater)
- LAHONTAN DAM STATE PARK BEACH 3 (Address: STATE PARKS DIVISION , Population served: 681, Primary Water Source Type: Groundwater)
- LAHONTAN DAM STATE PARK BEACH 7 (Address: STATE PARKS DIVISION , Population served: 305, Primary Water Source Type: Groundwater)
- BERLIN ICHTHYOSAUR STATE PARK (Address: STATE PARKS DIVISION , Population served: 67, Primary Water Source Type: Groundwater)
- WILDHORSE STATE PARK AND RECREATION AREA (Address: STATE PARKS DIVISION , Population served: 25, Primary Water Source Type: Groundwater)
| This city: | 2.4 people |
| Nevada: | 2.6 people |
| This city: | 60.0% |
| Whole state: | 65.3% |
| This city: | 8.9% |
| Whole state: | 8.7% |
Likely homosexual households (counted as self-reported same-sex unmarried-partner households)
- Lesbian couples: 0.3% of all households
- Gay men: 0.1% of all households
People in group quarters in Fallon in 2010:
- 71 people in nursing facilities/skilled-nursing facilities
- 40 people in local jails and other municipal confinement facilities
- 32 people in emergency and transitional shelters (with sleeping facilities) for people experiencing homelessness
- 16 people in residential treatment centers for adults
- 9 people in other noninstitutional facilities
People in group quarters in Fallon in 2000:
- 116 people in nursing homes
- 48 people in local jails and other confinement facilities (including police lockups)
- 4 people in homes or halfway houses for drug/alcohol abuse
Banks with branches in Fallon (2011 data):
- Wells Fargo Bank, National Association: Fallon Branch at 2211 W. Williams Avenue, branch established on 1889/01/01; West Williams & Venturacci Branch at 890 West Williams Avenue, branch established on 1997/05/09. Info updated 2011/04/05: Bank assets: $1,161,490.0 mil, Deposits: $905,653.0 mil, headquarters in Sioux Falls, SD, positive income, 6395 total offices, Holding Company: Wells Fargo & Company
- Nevada State Bank: Fallon Branch at 498 West Williams Avenue, branch established on 2005/05/02. Info updated 2009/04/21: Bank assets: $4,101.1 mil, Deposits: $3,546.3 mil, headquarters in Las Vegas, NV, positive income, Commercial Lending Specialization, 53 total offices, Holding Company: Zions Bancorporation
- U.S. Bank National Association: Fallon Branch at 2397 Casey Road, branch established on 1975/12/15. Info updated 2012/01/30: Bank assets: $330,470.8 mil, Deposits: $236,091.5 mil, headquarters in Cincinnati, OH, positive income, 3121 total offices, Holding Company: U.S. Bancorp
- Western Alliance Bank: Fallon Office Branch at 2061 West Williams Avenue, branch established on 2005/04/04. Info updated 2011/01/05: Bank assets: $2,234.7 mil, Deposits: $1,877.5 mil, headquarters in Phoenix, AZ, positive income, Commercial Lending Specialization, 17 total offices, Holding Company: Western Alliance Bancorporation
- Bank of America, National Association: Fallon Branch at 940 W. Williams Avenue, branch established on 1962/12/03. Info updated 2009/11/18: Bank assets: $1,451,969.3 mil, Deposits: $1,077,176.8 mil, headquarters in Charlotte, NC, positive income, 5782 total offices, Holding Company: Bank Of America Corporation
For population 15 years and over in Fallon:
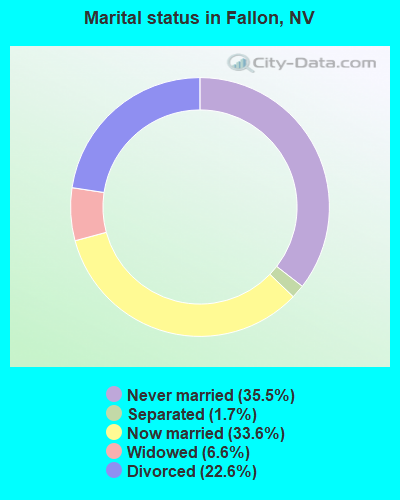
- Never married: 35.5%
- Now married: 33.6%
- Separated: 1.7%
- Widowed: 6.6%
- Divorced: 22.6%
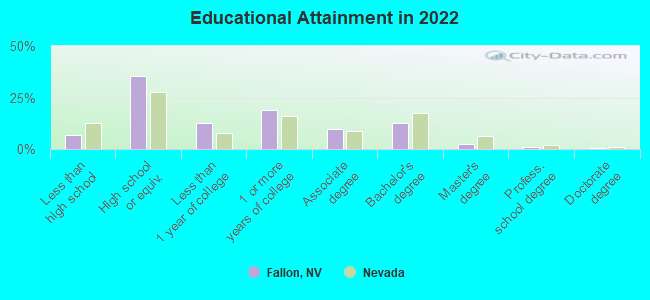
For population 25 years and over in Fallon:
- High school or higher: 92.9%
- Bachelor's degree or higher: 16.4%
- Graduate or professional degree: 3.8%
- Unemployed: 4.5%
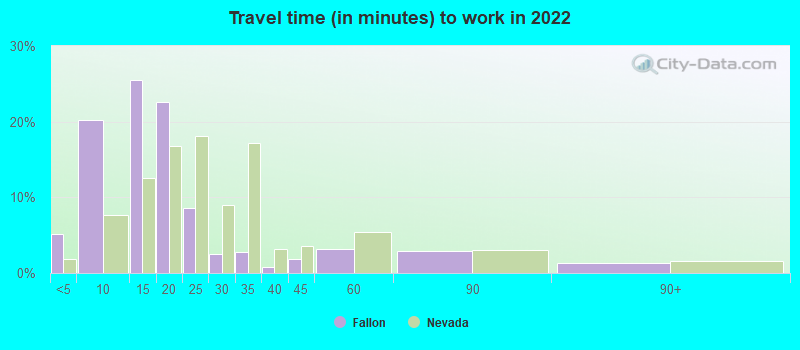
- Mean travel time to work (commute): 13.2 minutes
| Here: | 9.2 |
| Nevada average: | 12.5 |
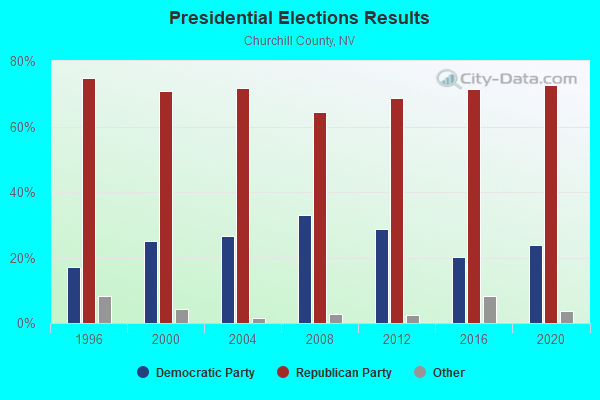
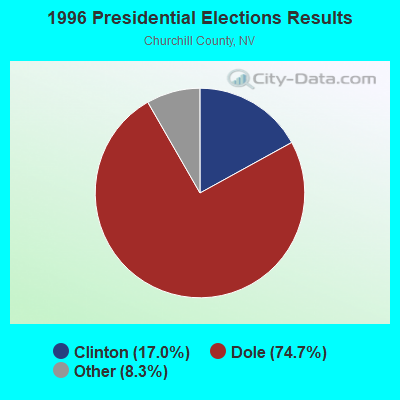
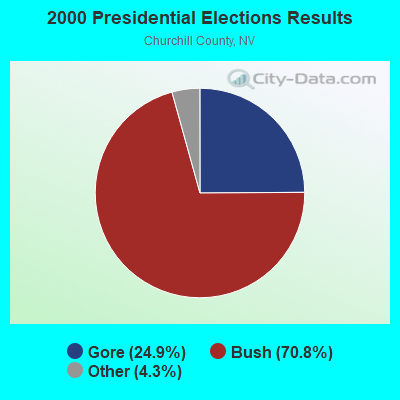
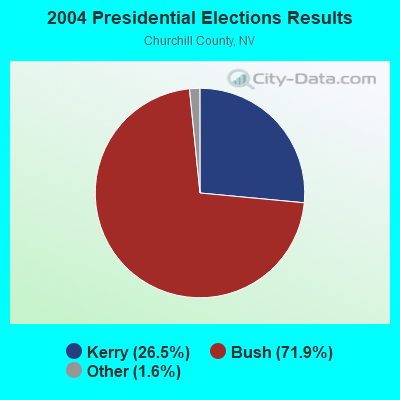
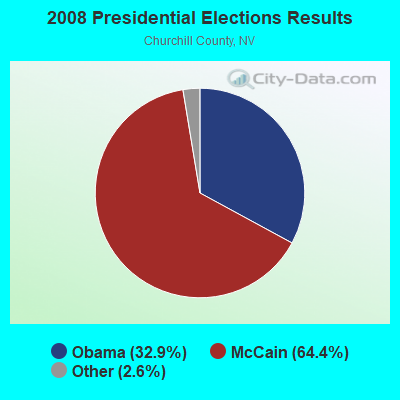

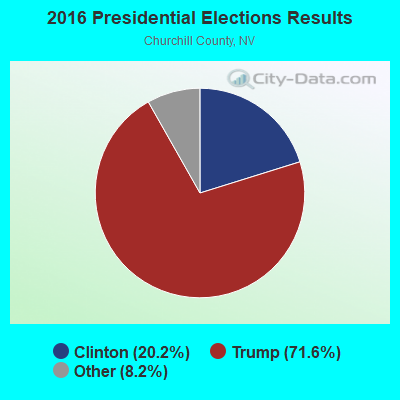

Graphs represent county-level data. Detailed 2008 Election Results
Religion statistics for Fallon, NV (based on Churchill County data)
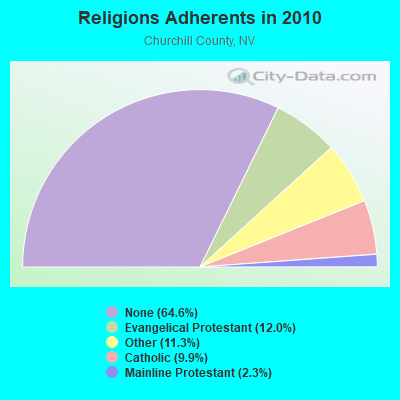
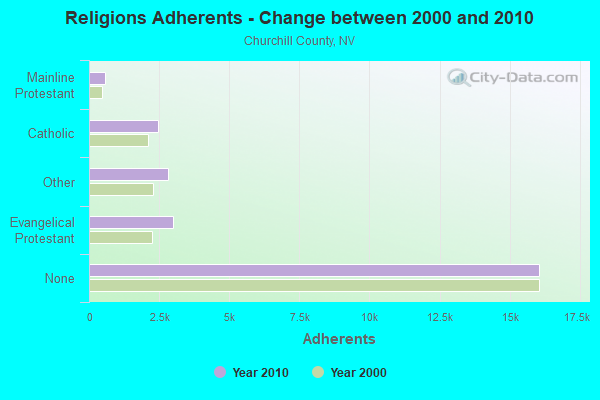
| Religion | Adherents | Congregations |
|---|---|---|
| Evangelical Protestant | 2,985 | 19 |
| Other | 2,803 | 9 |
| Catholic | 2,460 | 1 |
| Mainline Protestant | 568 | 2 |
| None | 16,061 | - |
Food Environment Statistics:
| Churchill County: | 0.81 / 10,000 pop. |
| Nevada: | 1.50 / 10,000 pop. |
| This county: | 2.42 / 10,000 pop. |
| Nevada: | 1.00 / 10,000 pop. |
| Churchill County: | 3.23 / 10,000 pop. |
| Nevada: | 2.56 / 10,000 pop. |
| This county: | 5.65 / 10,000 pop. |
| State: | 6.14 / 10,000 pop. |
| Churchill County: | 8.7% |
| State: | 8.2% |
| Here: | 26.8% |
| Nevada: | 24.5% |
| Churchill County: | 11.4% |
| State: | 13.2% |
Health and Nutrition:
| Here: | 49.8% |
| State: | 48.6% |
| This city: | 47.3% |
| Nevada: | 45.9% |
| Fallon: | 28.7 |
| Nevada: | 28.6 |
| This city: | 19.9% |
| Nevada: | 21.3% |
| This city: | 11.7% |
| Nevada: | 10.7% |
| Here: | 6.8 |
| State: | 6.8 |
| Fallon: | 33.2% |
| Nevada: | 33.1% |
| This city: | 57.1% |
| Nevada: | 55.6% |
| This city: | 79.5% |
| State: | 79.4% |
More about Health and Nutrition of Fallon, NV Residents
| Local government employment and payroll (March 2022) | |||||
| Function | Full-time employees | Monthly full-time payroll | Average yearly full-time wage | Part-time employees | Monthly part-time payroll |
|---|---|---|---|---|---|
| Police Protection - Officers | 22 | $182,716 | $99,663 | 0 | $0 |
| Other Government Administration | 15 | $90,230 | $72,184 | 3 | $3,189 |
| Parks and Recreation | 15 | $58,402 | $46,722 | 10 | $6,762 |
| Solid Waste Management | 10 | $46,828 | $56,194 | 0 | $0 |
| Water Supply | 9 | $64,316 | $85,755 | 0 | $0 |
| Other and Unallocable | 8 | $48,555 | $72,833 | 1 | $4,204 |
| Judicial and Legal | 6 | $65,888 | $131,776 | 1 | $784 |
| Police - Other | 6 | $28,243 | $56,486 | 1 | $651 |
| Fire - Other | 5 | $25,834 | $62,002 | 0 | $0 |
| Electric Power | 4 | $39,804 | $119,412 | 0 | $0 |
| Sewerage | 2 | $16,594 | $99,564 | 0 | $0 |
| Financial Administration | 2 | $19,782 | $118,692 | 0 | $0 |
| Totals for Government | 104 | $687,193 | $79,292 | 16 | $15,590 |
Fallon government finances - Expenditure in 2021 (per resident):
- Construction - Electric Utilities: $7,115,000 ($753.31)
Sewerage: $955,000 ($101.11)
Air Transportation: $754,000 ($79.83)
General - Other: $40,000 ($4.24)
- Current Operations - Electric Utilities: $8,271,000 ($875.70)
Police Protection: $5,209,000 ($551.51)
Sewerage: $2,302,000 ($243.73)
Solid Waste Management: $2,215,000 ($234.52)
Parks and Recreation: $1,778,000 ($188.25)
Water Utilities: $1,335,000 ($141.34)
General - Other: $1,269,000 ($134.36)
Judicial and Legal Services: $1,099,000 ($116.36)
Local Fire Protection: $828,000 ($87.67)
Central Staff Services: $771,000 ($81.63)
Financial Administration: $535,000 ($56.64)
General Public Buildings: $123,000 ($13.02)
Regular Highways: $69,000 ($7.31)
Air Transportation: $43,000 ($4.55)
- Electric Utilities - Interest on Debt: $152,000 ($16.09)
- General - Interest on Debt: $256,000 ($27.10)
- Other Capital Outlay - Sewerage: $568,000 ($60.14)
Solid Waste Management: $423,000 ($44.79)
Water Utilities: $183,000 ($19.38)
Police Protection: $148,000 ($15.67)
Regular Highways: $84,000 ($8.89)
Local Fire Protection: $42,000 ($4.45)
Parks and Recreation: $31,000 ($3.28)
- Water Utilities - Interest on Debt: $30,000 ($3.18)
Fallon government finances - Revenue in 2021 (per resident):
- Charges - Sewerage: $3,913,000 ($414.29)
Solid Waste Management: $2,901,000 ($307.15)
Parks and Recreation: $85,000 ($9.00)
Other: $70,000 ($7.41)
Air Transportation: $35,000 ($3.71)
- Federal Intergovernmental - Air Transportation: $1,765,000 ($186.87)
- Local Intergovernmental - Other: $253,000 ($26.79)
General Local Government Support: $104,000 ($11.01)
- Miscellaneous - Interest Earnings: $299,000 ($31.66)
Special Assessments: $241,000 ($25.52)
Fines and Forfeits: $114,000 ($12.07)
General Revenue - Other: $111,000 ($11.75)
Rents: $31,000 ($3.28)
- Revenue - Electric Utilities: $11,289,000 ($1195.24)
Water Utilities: $1,640,000 ($173.64)
- State Intergovernmental - Electric Utilities: $3,626,000 ($383.91)
General Local Government Support: $2,999,000 ($317.52)
Highways: $233,000 ($24.67)
Other: $160,000 ($16.94)
Housing and Community Development: $104,000 ($11.01)
Water Utilities: $8,000 ($0.85)
- Tax - Property: $1,686,000 ($178.51)
Other Selective Sales: $666,000 ($70.51)
Public Utilities Sales: $314,000 ($33.25)
Occupation and Business License - Other: $297,000 ($31.45)
Other License: $124,000 ($13.13)
Alcoholic Beverage License: $39,000 ($4.13)
General Sales and Gross Receipts: $35,000 ($3.71)
Amusements License: $31,000 ($3.28)
Fallon government finances - Debt in 2021 (per resident):
- Long Term Debt - Beginning Outstanding - Unspecified Public Purpose: $13,547,000 ($1434.30)
Outstanding Unspecified Public Purpose: $12,630,000 ($1337.22)
Retired Unspecified Public Purpose: $917,000 ($97.09)
Fallon government finances - Cash and Securities in 2021 (per resident):
- Other Funds - Cash and Securities: $8,405,000 ($889.89)
- Sinking Funds - Cash and Securities: $4,301,000 ($455.37)
10.16% of this county's 2021 resident taxpayers lived in other counties in 2020 ($50,550 average adjusted gross income)
| Here: | 10.16% |
| Nevada average: | 6.67% |
0.26% of residents moved from foreign countries ($1,407 average AGI)
Churchill County: 0.26% Nevada average: 0.05%
Top counties from which taxpayers relocated into this county between 2020 and 2021:
| from Washoe County, NV | |
| from Lyon County, NV | |
| from Clark County, NV |
| Businesses in Fallon, NV | ||||
| Name | Count | Name | Count | |
|---|---|---|---|---|
| Ace Hardware | 1 | Long John Silver's | 1 | |
| AutoZone | 1 | McDonald's | 2 | |
| Best Western | 1 | Motel 6 | 1 | |
| Burger King | 1 | Payless | 1 | |
| CVS | 1 | Penske | 1 | |
| DHL | 1 | RadioShack | 1 | |
| Dairy Queen | 1 | SONIC Drive-In | 1 | |
| Domino's Pizza | 1 | Sears | 1 | |
| Econo Lodge | 1 | Starbucks | 1 | |
| FedEx | 5 | Super 8 | 1 | |
| Ford | 1 | T-Mobile | 1 | |
| GameStop | 1 | Toyota | 1 | |
| H&R Block | 1 | U-Haul | 2 | |
| Holiday Inn | 1 | UPS | 7 | |
| Jack In The Box | 1 | Verizon Wireless | 1 | |
| KFC | 1 | Vons | 1 | |
| La-Z-Boy | 1 | Walmart | 1 | |
| Lane Furniture | 2 | |||
Strongest AM radio stations in Fallon:
- KVLV (980 AM; daytime; 5 kW; FALLON, NV; Owner: LAHONTAN VALLEY BROADCASTING COMPANY, LLC)
- KKOH (780 AM; 50 kW; RENO, NV; Owner: CITADEL BROADCASTING COMPANY)
- KBZZ (1270 AM; 13 kW; SPARKS, NV; Owner: AMERICOM LAS VEGAS LIMITED PARTNERSHIP)
- KCBC (770 AM; 50 kW; RIVERBANK, CA; Owner: KIERTRON, INC.)
- KPTT (630 AM; 5 kW; RENO, NV; Owner: LOTUS RADIO CORP.)
- KMJ (580 AM; 50 kW; FRESNO, CA; Owner: INFINITY RADIO OPERATIONS INC.)
- KIHM (920 AM; 5 kW; RENO, NV; Owner: IHR EDUCATIONAL BROADCASTING)
- KHTK (1140 AM; 50 kW; SACRAMENTO, CA; Owner: INFINITY RADIO SUBSIDIARY OPERATIONS INC.)
- KFIA (710 AM; 25 kW; CARMICHAEL, CA; Owner: VISTA BROADCASTING INC.)
- KSTE (650 AM; 25 kW; RANCHO CORDOVA, CA; Owner: AMFM RADIO LICENSES, L.L.C.)
- KFBK (1530 AM; 50 kW; SACRAMENTO, CA; Owner: AMFM RADIO LICENSES, L.L.C.)
- KNBR (680 AM; 50 kW; SAN FRANCISCO, CA; Owner: KNBR LICO, INC.)
- KCBS (740 AM; 50 kW; SAN FRANCISCO, CA; Owner: INFINITY BROADCASTING OPERATIONS, INC.)
Strongest FM radio stations in Fallon:
- KRNG (101.3 FM; FALLON, NV; Owner: SIERRA NV CHRISTIAN MUSIC ASSOC, INC)
- KNHK (92.9 FM; RENO, NV; Owner: CITADEL BROADCASTING COMPANY)
- KRNG-FM1 (101.3 FM; RENO, NV; Owner: SIERRA NV CHRISTIAN MUSIC ASSN INC)
- KSVL (92.3 FM; SMITH, NV; Owner: DONEGAL ENTERPRISES)
- KSRN (107.7 FM; KINGS BEACH, CA; Owner: NM LICENSING, LLC)
- KRNO (106.9 FM; INCLINE VILLAGE, NV; Owner: AMERICOM LAS VEGAS LIMITED PARTNERSHIP)
- KTHX-FM (100.1 FM; DAYTON, NV; Owner: NM LICENSING, LLC)
- KODS (103.7 FM; CARNELIAN BAY, CA; Owner: AMERICOM, A CALIFORNIA LIMITED PARTNERSHIP)
- KLCA (96.5 FM; TAHOE CITY, CA; Owner: AMERICOM LAS VEGAS LIMITED PARTNERSHIP)
- KKTO (90.5 FM; TAHOE CITY, CA; Owner: CALIFORNIA STATE UNIVERSITY)
- KDOT (104.5 FM; RENO, NV; Owner: LOTUS RADIO CORP.)
- KOZZ-FM (105.7 FM; RENO, NV; Owner: LOTUS RADIO CORP.)
- KBUL-FM (98.1 FM; CARSON CITY, NV; Owner: CITADEL BROADCASTING COMPANY)
- KNEV (95.5 FM; RENO, NV; Owner: CITADEL BROADCASTING COMPANY)
- KUNR (88.7 FM; RENO, NV; Owner: UNIVERSITY OF NEVADA, RENO)
- KNIS (91.3 FM; CARSON CITY, NV; Owner: WESTERN INSPIRATIONAL BROADCASTERS, INC)
- KWNZ (97.3 FM; CARSON CITY, NV; Owner: AMERICOM LAS VEGAS LIMITED PARTNERSHIP)
- KSSJ (94.7 FM; FAIR OAKS, CA; Owner: ENTERCOM SACRAMENTO LICENSE, LLC)
- K273AF (102.5 FM; CARSON CITY, NV; Owner: EDDIE FLOYD)
- K286AG (105.1 FM; CARSON CITY, NV; Owner: NM LICENSING, LLC)
TV broadcast stations around Fallon:
- K25AK (Channel 25; FALLON, NV; Owner: FALLON COMMUNITY TELEVISION, INC.)
- K44BE (Channel 44; FALLON, NV; Owner: BROADCAST DEVELOPMENT CORPORATION)
- K13QV (Channel 13; FALLON, NV; Owner: SIERRA BROADCASTING COMPANY)
- National Bridge Inventory (NBI) Statistics
- 43Number of bridges
- 197ft / 59.6mTotal length
- $2,482,000Total costs
- 100,259Total average daily traffic
- 5,679Total average daily truck traffic
- 203,843Total future (year 2037) average daily traffic
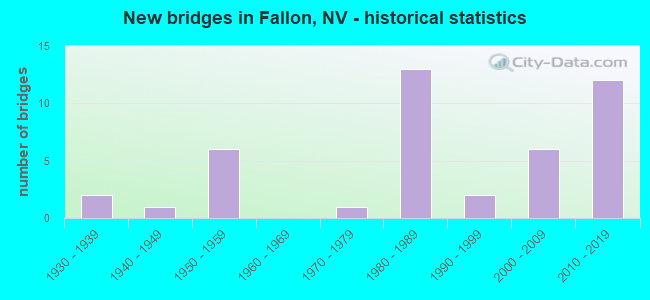
- New bridges - historical statistics
- 21930-1939
- 11940-1949
- 61950-1959
- 11970-1979
- 131980-1989
- 21990-1999
- 62000-2009
- 122010-2019
FCC Registered Antenna Towers: 121 (See the full list of FCC Registered Antenna Towers)
FCC Registered Private Land Mobile Towers: 4 (See the full list of FCC Registered Private Land Mobile Towers in Fallon, NV)
FCC Registered Broadcast Land Mobile Towers: 33 (See the full list of FCC Registered Broadcast Land Mobile Towers)
FCC Registered Microwave Towers: 49 (See the full list of FCC Registered Microwave Towers in this town)
FCC Registered Paging Towers: 4 (See the full list of FCC Registered Paging Towers)
FCC Registered Maritime Coast & Aviation Ground Towers: 5 (See the full list of FCC Registered Maritime Coast & Aviation Ground Towers)
FCC Registered Amateur Radio Licenses: 305 (See the full list of FCC Registered Amateur Radio Licenses in Fallon)
FAA Registered Aircraft Manufacturers and Dealers: 1 (See the full list of FAA Registered Manufacturers and Dealers in Fallon)
FAA Registered Aircraft: 119 (See the full list of FAA Registered Aircraft)
2005 - 2018 National Fire Incident Reporting System (NFIRS) incidents
- Fire incident types reported to NFIRS in Fallon, NV
- 1,03858.0%Outside Fires
- 26614.9%Other
- 26114.6%Structure Fires
- 22612.6%Mobile Property/Vehicle Fires
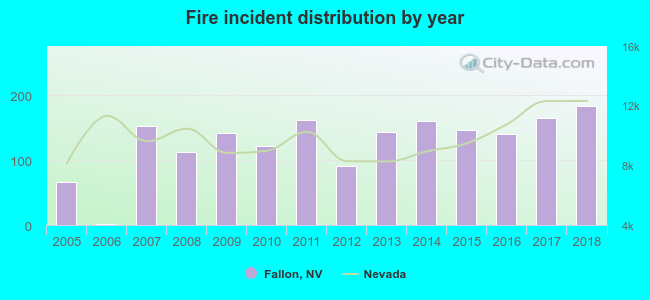 According to the data from the years 2005 - 2018 the average number of fire incidents per year is 128. The highest number of fire incidents - 184 took place in 2018, and the least - 2 in 2006. The data has a rising trend.
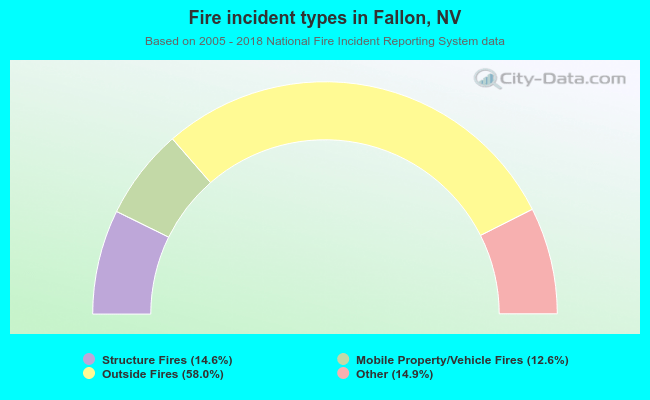 When looking into fire subcategories, the most reports belonged to: Outside Fires (58.0%), and Other (14.9%).
Fire-safe hotels and motels in Fallon, Nevada:
- Rodeway Inn & Suites Fallon Naval Air Station, 1051 W Williams, Fallon, Nevada 89406 , Phone: (775) 428-0300, Fax: (775) 428-0301
- Navy Lodge Fallon, 1000 Cottonwood Dr Bldg 1002, Fallon, Nevada 89496 , Phone: (800) 628-9466, Fax: (775) 426-3398
| Most common first names in Fallon, NV among deceased individuals | ||
| Name | Count | Lived (average) |
|---|---|---|
| Robert | 126 | 71.4 years |
| John | 126 | 73.1 years |
| William | 120 | 75.8 years |
| James | 100 | 72.4 years |
| Mary | 98 | 77.6 years |
| Charles | 82 | 76.2 years |
| George | 79 | 77.2 years |
| Dorothy | 56 | 77.7 years |
| Frank | 51 | 78.8 years |
| Thomas | 51 | 70.7 years |
| Most common last names in Fallon, NV among deceased individuals | ||
| Last name | Count | Lived (average) |
|---|---|---|
| Smith | 68 | 74.2 years |
| Williams | 46 | 73.2 years |
| Miller | 43 | 79.1 years |
| Johnson | 42 | 76.1 years |
| Jones | 37 | 73.1 years |
| Brown | 36 | 73.5 years |
| Martin | 31 | 75.0 years |
| Anderson | 23 | 71.1 years |
| Allen | 22 | 75.1 years |
| Wilson | 22 | 67.8 years |
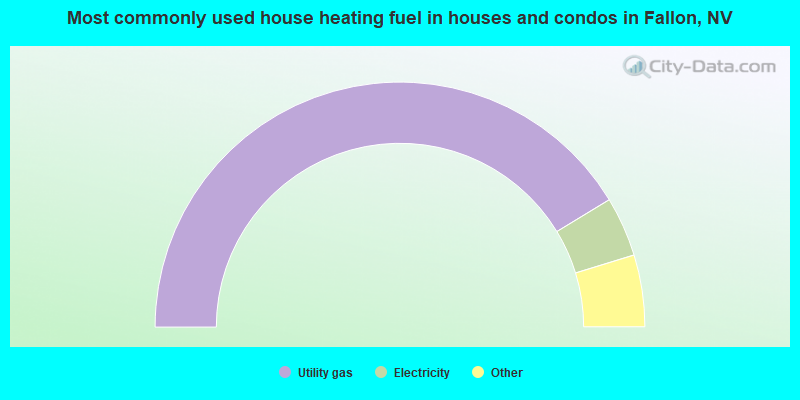
- 82.7%Utility gas
- 7.9%Electricity
- 3.6%Wood
- 3.0%Bottled, tank, or LP gas
- 2.9%Solar energy
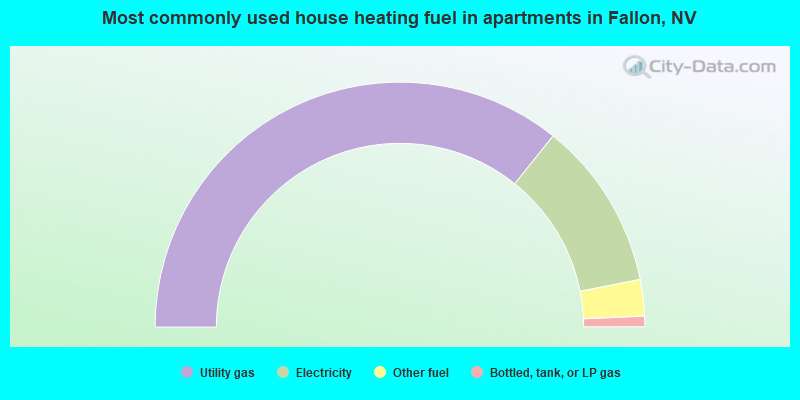
- 71.5%Utility gas
- 22.3%Electricity
- 4.8%Other fuel
- 1.4%Bottled, tank, or LP gas
Fallon compared to Nevada state average:
- Median house value below state average.
- Unemployed percentage significantly below state average.
- Black race population percentage below state average.
- Hispanic race population percentage below state average.
- Median age significantly below state average.
- Foreign-born population percentage below state average.
- Length of stay since moving in significantly above state average.
Fallon on our top lists:
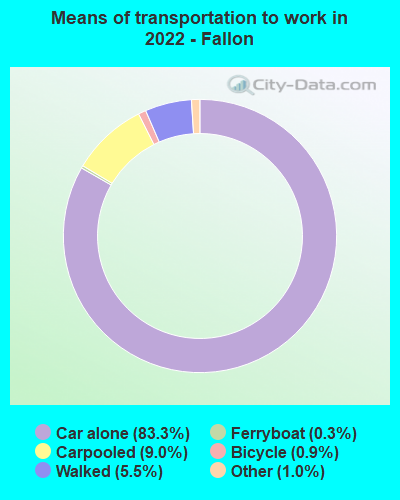
- #60 on the list of "Top 101 cities with the most people driving a car to work alone (population 5,000+)"
- #82 on the list of "Top 101 cities with the least people living the same house as 1 year ago (population 5,000+))"
- #91 on the list of "Top 101 cities with largest percentage of females in occupations: material moving occupations (population 5,000+)"
- #20 (89406) on the list of "Top 101 zip codes with the most casinos in 2005"
- #31 on the list of "Top 101 counties with the highest percentage of residents relocating from foreign countries between 2010 and 2011"
- #60 on the list of "Top 101 counties with the highest percentage of residents relocating to foreign countries in 2011"

|
|
Total of 19 patent applications in 2008-2024.