Flatwoods, Kentucky Submit your own pictures of this city and show them to the world
OSM Map
General Map
Google Map
MSN Map
OSM Map
General Map
Google Map
MSN Map
OSM Map
General Map
Google Map
MSN Map
OSM Map
General Map
Google Map
MSN Map
Please wait while loading the map...
Population in 2022: 7,243 (100% urban, 0% rural). Population change since 2000: -4.8%Males: 3,568 Females: 3,675
March 2022 cost of living index in Flatwoods: 81.9 (low, U.S. average is 100) Percentage of residents living in poverty in 2022: 18.0%for White Non-Hispanic residents , 2.4% for two or more races residents )
Profiles of local businesses
Business Search - 14 Million verified businesses
Data:
Median household income ($)
Median household income (% change since 2000)
Household income diversity
Ratio of average income to average house value (%)
Ratio of average income to average rent
Median household income ($) - White
Median household income ($) - Black or African American
Median household income ($) - Asian
Median household income ($) - Hispanic or Latino
Median household income ($) - American Indian and Alaska Native
Median household income ($) - Multirace
Median household income ($) - Other Race
Median household income for houses/condos with a mortgage ($)
Median household income for apartments without a mortgage ($)
Races - White alone (%)
Races - White alone (% change since 2000)
Races - Black alone (%)
Races - Black alone (% change since 2000)
Races - American Indian alone (%)
Races - American Indian alone (% change since 2000)
Races - Asian alone (%)
Races - Asian alone (% change since 2000)
Races - Hispanic (%)
Races - Hispanic (% change since 2000)
Races - Native Hawaiian and Other Pacific Islander alone (%)
Races - Native Hawaiian and Other Pacific Islander alone (% change since 2000)
Races - Two or more races (%)
Races - Two or more races (% change since 2000)
Races - Other race alone (%)
Races - Other race alone (% change since 2000)
Racial diversity
Unemployment (%)
Unemployment (% change since 2000)
Unemployment (%) - White
Unemployment (%) - Black or African American
Unemployment (%) - Asian
Unemployment (%) - Hispanic or Latino
Unemployment (%) - American Indian and Alaska Native
Unemployment (%) - Multirace
Unemployment (%) - Other Race
Population density (people per square mile)
Population - Males (%)
Population - Females (%)
Population - Males (%) - White
Population - Males (%) - Black or African American
Population - Males (%) - Asian
Population - Males (%) - Hispanic or Latino
Population - Males (%) - American Indian and Alaska Native
Population - Males (%) - Multirace
Population - Males (%) - Other Race
Population - Females (%) - White
Population - Females (%) - Black or African American
Population - Females (%) - Asian
Population - Females (%) - Hispanic or Latino
Population - Females (%) - American Indian and Alaska Native
Population - Females (%) - Multirace
Population - Females (%) - Other Race
Coronavirus confirmed cases (May 05, 2024)
Deaths caused by coronavirus (May 05, 2024)
Coronavirus confirmed cases (per 100k population) (May 05, 2024)
Deaths caused by coronavirus (per 100k population) (May 05, 2024)
Daily increase in number of cases (May 05, 2024)
Weekly increase in number of cases (May 05, 2024)
Cases doubled (in days) (May 05, 2024)
Hospitalized patients (Apr 18, 2022)
Negative test results (Apr 18, 2022)
Total test results (Apr 18, 2022)
COVID Vaccine doses distributed (per 100k population) (Sep 19, 2023)
COVID Vaccine doses administered (per 100k population) (Sep 19, 2023)
COVID Vaccine doses distributed (Sep 19, 2023)
COVID Vaccine doses administered (Sep 19, 2023)
Likely homosexual households (%)
Likely homosexual households (% change since 2000)
Likely homosexual households - Lesbian couples (%)
Likely homosexual households - Lesbian couples (% change since 2000)
Likely homosexual households - Gay men (%)
Likely homosexual households - Gay men (% change since 2000)
Cost of living index
Median gross rent ($)
Median contract rent ($)
Median monthly housing costs ($)
Median house or condo value ($)
Median house or condo value ($ change since 2000)
Mean house or condo value by units in structure - 1, detached ($)
Mean house or condo value by units in structure - 1, attached ($)
Mean house or condo value by units in structure - 2 ($)
Mean house or condo value by units in structure by units in structure - 3 or 4 ($)
Mean house or condo value by units in structure - 5 or more ($)
Mean house or condo value by units in structure - Boat, RV, van, etc. ($)
Mean house or condo value by units in structure - Mobile home ($)
Median house or condo value ($) - White
Median house or condo value ($) - Black or African American
Median house or condo value ($) - Asian
Median house or condo value ($) - Hispanic or Latino
Median house or condo value ($) - American Indian and Alaska Native
Median house or condo value ($) - Multirace
Median house or condo value ($) - Other Race
Median resident age
Resident age diversity
Median resident age - Males
Median resident age - Females
Median resident age - White
Median resident age - Black or African American
Median resident age - Asian
Median resident age - Hispanic or Latino
Median resident age - American Indian and Alaska Native
Median resident age - Multirace
Median resident age - Other Race
Median resident age - Males - White
Median resident age - Males - Black or African American
Median resident age - Males - Asian
Median resident age - Males - Hispanic or Latino
Median resident age - Males - American Indian and Alaska Native
Median resident age - Males - Multirace
Median resident age - Males - Other Race
Median resident age - Females - White
Median resident age - Females - Black or African American
Median resident age - Females - Asian
Median resident age - Females - Hispanic or Latino
Median resident age - Females - American Indian and Alaska Native
Median resident age - Females - Multirace
Median resident age - Females - Other Race
Commute - mean travel time to work (minutes)
Travel time to work - Less than 5 minutes (%)
Travel time to work - Less than 5 minutes (% change since 2000)
Travel time to work - 5 to 9 minutes (%)
Travel time to work - 5 to 9 minutes (% change since 2000)
Travel time to work - 10 to 19 minutes (%)
Travel time to work - 10 to 19 minutes (% change since 2000)
Travel time to work - 20 to 29 minutes (%)
Travel time to work - 20 to 29 minutes (% change since 2000)
Travel time to work - 30 to 39 minutes (%)
Travel time to work - 30 to 39 minutes (% change since 2000)
Travel time to work - 40 to 59 minutes (%)
Travel time to work - 40 to 59 minutes (% change since 2000)
Travel time to work - 60 to 89 minutes (%)
Travel time to work - 60 to 89 minutes (% change since 2000)
Travel time to work - 90 or more minutes (%)
Travel time to work - 90 or more minutes (% change since 2000)
Marital status - Never married (%)
Marital status - Now married (%)
Marital status - Separated (%)
Marital status - Widowed (%)
Marital status - Divorced (%)
Median family income ($)
Median family income (% change since 2000)
Median non-family income ($)
Median non-family income (% change since 2000)
Median per capita income ($)
Median per capita income (% change since 2000)
Median family income ($) - White
Median family income ($) - Black or African American
Median family income ($) - Asian
Median family income ($) - Hispanic or Latino
Median family income ($) - American Indian and Alaska Native
Median family income ($) - Multirace
Median family income ($) - Other Race
Median year house/condo built
Median year apartment built
Year house built - Built 2005 or later (%)
Year house built - Built 2000 to 2004 (%)
Year house built - Built 1990 to 1999 (%)
Year house built - Built 1980 to 1989 (%)
Year house built - Built 1970 to 1979 (%)
Year house built - Built 1960 to 1969 (%)
Year house built - Built 1950 to 1959 (%)
Year house built - Built 1940 to 1949 (%)
Year house built - Built 1939 or earlier (%)
Average household size
Household density (households per square mile)
Average household size - White
Average household size - Black or African American
Average household size - Asian
Average household size - Hispanic or Latino
Average household size - American Indian and Alaska Native
Average household size - Multirace
Average household size - Other Race
Occupied housing units (%)
Vacant housing units (%)
Owner occupied housing units (%)
Renter occupied housing units (%)
Vacancy status - For rent (%)
Vacancy status - For sale only (%)
Vacancy status - Rented or sold, not occupied (%)
Vacancy status - For seasonal, recreational, or occasional use (%)
Vacancy status - For migrant workers (%)
Vacancy status - Other vacant (%)
Residents with income below the poverty level (%)
Residents with income below 50% of the poverty level (%)
Children below poverty level (%)
Poor families by family type - Married-couple family (%)
Poor families by family type - Male, no wife present (%)
Poor families by family type - Female, no husband present (%)
Poverty status for native-born residents (%)
Poverty status for foreign-born residents (%)
Poverty among high school graduates not in families (%)
Poverty among people who did not graduate high school not in families (%)
Residents with income below the poverty level (%) - White
Residents with income below the poverty level (%) - Black or African American
Residents with income below the poverty level (%) - Asian
Residents with income below the poverty level (%) - Hispanic or Latino
Residents with income below the poverty level (%) - American Indian and Alaska Native
Residents with income below the poverty level (%) - Multirace
Residents with income below the poverty level (%) - Other Race
Air pollution - Air Quality Index (AQI)
Air pollution - CO
Air pollution - NO2
Air pollution - SO2
Air pollution - Ozone
Air pollution - PM10
Air pollution - PM25
Air pollution - Pb
Crime - Murders per 100,000 population
Crime - Rapes per 100,000 population
Crime - Robberies per 100,000 population
Crime - Assaults per 100,000 population
Crime - Burglaries per 100,000 population
Crime - Thefts per 100,000 population
Crime - Auto thefts per 100,000 population
Crime - Arson per 100,000 population
Crime - City-data.com crime index
Crime - Violent crime index
Crime - Property crime index
Crime - Murders per 100,000 population (5 year average)
Crime - Rapes per 100,000 population (5 year average)
Crime - Robberies per 100,000 population (5 year average)
Crime - Assaults per 100,000 population (5 year average)
Crime - Burglaries per 100,000 population (5 year average)
Crime - Thefts per 100,000 population (5 year average)
Crime - Auto thefts per 100,000 population (5 year average)
Crime - Arson per 100,000 population (5 year average)
Crime - City-data.com crime index (5 year average)
Crime - Violent crime index (5 year average)
Crime - Property crime index (5 year average)
1996 Presidential Elections Results (%) - Democratic Party (Clinton)
1996 Presidential Elections Results (%) - Republican Party (Dole)
1996 Presidential Elections Results (%) - Other
2000 Presidential Elections Results (%) - Democratic Party (Gore)
2000 Presidential Elections Results (%) - Republican Party (Bush)
2000 Presidential Elections Results (%) - Other
2004 Presidential Elections Results (%) - Democratic Party (Kerry)
2004 Presidential Elections Results (%) - Republican Party (Bush)
2004 Presidential Elections Results (%) - Other
2008 Presidential Elections Results (%) - Democratic Party (Obama)
2008 Presidential Elections Results (%) - Republican Party (McCain)
2008 Presidential Elections Results (%) - Other
2012 Presidential Elections Results (%) - Democratic Party (Obama)
2012 Presidential Elections Results (%) - Republican Party (Romney)
2012 Presidential Elections Results (%) - Other
2016 Presidential Elections Results (%) - Democratic Party (Clinton)
2016 Presidential Elections Results (%) - Republican Party (Trump)
2016 Presidential Elections Results (%) - Other
2020 Presidential Elections Results (%) - Democratic Party (Biden)
2020 Presidential Elections Results (%) - Republican Party (Trump)
2020 Presidential Elections Results (%) - Other
Ancestries Reported - Arab (%)
Ancestries Reported - Czech (%)
Ancestries Reported - Danish (%)
Ancestries Reported - Dutch (%)
Ancestries Reported - English (%)
Ancestries Reported - French (%)
Ancestries Reported - French Canadian (%)
Ancestries Reported - German (%)
Ancestries Reported - Greek (%)
Ancestries Reported - Hungarian (%)
Ancestries Reported - Irish (%)
Ancestries Reported - Italian (%)
Ancestries Reported - Lithuanian (%)
Ancestries Reported - Norwegian (%)
Ancestries Reported - Polish (%)
Ancestries Reported - Portuguese (%)
Ancestries Reported - Russian (%)
Ancestries Reported - Scotch-Irish (%)
Ancestries Reported - Scottish (%)
Ancestries Reported - Slovak (%)
Ancestries Reported - Subsaharan African (%)
Ancestries Reported - Swedish (%)
Ancestries Reported - Swiss (%)
Ancestries Reported - Ukrainian (%)
Ancestries Reported - United States (%)
Ancestries Reported - Welsh (%)
Ancestries Reported - West Indian (%)
Ancestries Reported - Other (%)
Educational Attainment - No schooling completed (%)
Educational Attainment - Less than high school (%)
Educational Attainment - High school or equivalent (%)
Educational Attainment - Less than 1 year of college (%)
Educational Attainment - 1 or more years of college (%)
Educational Attainment - Associate degree (%)
Educational Attainment - Bachelor's degree (%)
Educational Attainment - Master's degree (%)
Educational Attainment - Professional school degree (%)
Educational Attainment - Doctorate degree (%)
School Enrollment - Nursery, preschool (%)
School Enrollment - Kindergarten (%)
School Enrollment - Grade 1 to 4 (%)
School Enrollment - Grade 5 to 8 (%)
School Enrollment - Grade 9 to 12 (%)
School Enrollment - College undergrad (%)
School Enrollment - Graduate or professional (%)
School Enrollment - Not enrolled in school (%)
School enrollment - Public schools (%)
School enrollment - Private schools (%)
School enrollment - Not enrolled (%)
Median number of rooms in houses and condos
Median number of rooms in apartments
Housing units lacking complete plumbing facilities (%)
Housing units lacking complete kitchen facilities (%)
Density of houses
Urban houses (%)
Rural houses (%)
Households with people 60 years and over (%)
Households with people 65 years and over (%)
Households with people 75 years and over (%)
Households with one or more nonrelatives (%)
Households with no nonrelatives (%)
Population in households (%)
Family households (%)
Nonfamily households (%)
Population in families (%)
Family households with own children (%)
Median number of bedrooms in owner occupied houses
Mean number of bedrooms in owner occupied houses
Median number of bedrooms in renter occupied houses
Mean number of bedrooms in renter occupied houses
Median number of vehichles in owner occupied houses
Mean number of vehichles in owner occupied houses
Median number of vehichles in renter occupied houses
Mean number of vehichles in renter occupied houses
Mortgage status - with mortgage (%)
Mortgage status - with second mortgage (%)
Mortgage status - with home equity loan (%)
Mortgage status - with both second mortgage and home equity loan (%)
Mortgage status - without a mortgage (%)
Average family size
Average family size - White
Average family size - Black or African American
Average family size - Asian
Average family size - Hispanic or Latino
Average family size - American Indian and Alaska Native
Average family size - Multirace
Average family size - Other Race
Geographical mobility - Same house 1 year ago (%)
Geographical mobility - Moved within same county (%)
Geographical mobility - Moved from different county within same state (%)
Geographical mobility - Moved from different state (%)
Geographical mobility - Moved from abroad (%)
Place of birth - Born in state of residence (%)
Place of birth - Born in other state (%)
Place of birth - Native, outside of US (%)
Place of birth - Foreign born (%)
Housing units in structures - 1, detached (%)
Housing units in structures - 1, attached (%)
Housing units in structures - 2 (%)
Housing units in structures - 3 or 4 (%)
Housing units in structures - 5 to 9 (%)
Housing units in structures - 10 to 19 (%)
Housing units in structures - 20 to 49 (%)
Housing units in structures - 50 or more (%)
Housing units in structures - Mobile home (%)
Housing units in structures - Boat, RV, van, etc. (%)
House/condo owner moved in on average (years ago)
Renter moved in on average (years ago)
Year householder moved into unit - Moved in 1999 to March 2000 (%)
Year householder moved into unit - Moved in 1995 to 1998 (%)
Year householder moved into unit - Moved in 1990 to 1994 (%)
Year householder moved into unit - Moved in 1980 to 1989 (%)
Year householder moved into unit - Moved in 1970 to 1979 (%)
Year householder moved into unit - Moved in 1969 or earlier (%)
Means of transportation to work - Drove car alone (%)
Means of transportation to work - Carpooled (%)
Means of transportation to work - Public transportation (%)
Means of transportation to work - Bus or trolley bus (%)
Means of transportation to work - Streetcar or trolley car (%)
Means of transportation to work - Subway or elevated (%)
Means of transportation to work - Railroad (%)
Means of transportation to work - Ferryboat (%)
Means of transportation to work - Taxicab (%)
Means of transportation to work - Motorcycle (%)
Means of transportation to work - Bicycle (%)
Means of transportation to work - Walked (%)
Means of transportation to work - Other means (%)
Working at home (%)
Industry diversity
Most Common Industries - Agriculture, forestry, fishing and hunting, and mining (%)
Most Common Industries - Agriculture, forestry, fishing and hunting (%)
Most Common Industries - Mining, quarrying, and oil and gas extraction (%)
Most Common Industries - Construction (%)
Most Common Industries - Manufacturing (%)
Most Common Industries - Wholesale trade (%)
Most Common Industries - Retail trade (%)
Most Common Industries - Transportation and warehousing, and utilities (%)
Most Common Industries - Transportation and warehousing (%)
Most Common Industries - Utilities (%)
Most Common Industries - Information (%)
Most Common Industries - Finance and insurance, and real estate and rental and leasing (%)
Most Common Industries - Finance and insurance (%)
Most Common Industries - Real estate and rental and leasing (%)
Most Common Industries - Professional, scientific, and management, and administrative and waste management services (%)
Most Common Industries - Professional, scientific, and technical services (%)
Most Common Industries - Management of companies and enterprises (%)
Most Common Industries - Administrative and support and waste management services (%)
Most Common Industries - Educational services, and health care and social assistance (%)
Most Common Industries - Educational services (%)
Most Common Industries - Health care and social assistance (%)
Most Common Industries - Arts, entertainment, and recreation, and accommodation and food services (%)
Most Common Industries - Arts, entertainment, and recreation (%)
Most Common Industries - Accommodation and food services (%)
Most Common Industries - Other services, except public administration (%)
Most Common Industries - Public administration (%)
Occupation diversity
Most Common Occupations - Management, business, science, and arts occupations (%)
Most Common Occupations - Management, business, and financial occupations (%)
Most Common Occupations - Management occupations (%)
Most Common Occupations - Business and financial operations occupations (%)
Most Common Occupations - Computer, engineering, and science occupations (%)
Most Common Occupations - Computer and mathematical occupations (%)
Most Common Occupations - Architecture and engineering occupations (%)
Most Common Occupations - Life, physical, and social science occupations (%)
Most Common Occupations - Education, legal, community service, arts, and media occupations (%)
Most Common Occupations - Community and social service occupations (%)
Most Common Occupations - Legal occupations (%)
Most Common Occupations - Education, training, and library occupations (%)
Most Common Occupations - Arts, design, entertainment, sports, and media occupations (%)
Most Common Occupations - Healthcare practitioners and technical occupations (%)
Most Common Occupations - Health diagnosing and treating practitioners and other technical occupations (%)
Most Common Occupations - Health technologists and technicians (%)
Most Common Occupations - Service occupations (%)
Most Common Occupations - Healthcare support occupations (%)
Most Common Occupations - Protective service occupations (%)
Most Common Occupations - Fire fighting and prevention, and other protective service workers including supervisors (%)
Most Common Occupations - Law enforcement workers including supervisors (%)
Most Common Occupations - Food preparation and serving related occupations (%)
Most Common Occupations - Building and grounds cleaning and maintenance occupations (%)
Most Common Occupations - Personal care and service occupations (%)
Most Common Occupations - Sales and office occupations (%)
Most Common Occupations - Sales and related occupations (%)
Most Common Occupations - Office and administrative support occupations (%)
Most Common Occupations - Natural resources, construction, and maintenance occupations (%)
Most Common Occupations - Farming, fishing, and forestry occupations (%)
Most Common Occupations - Construction and extraction occupations (%)
Most Common Occupations - Installation, maintenance, and repair occupations (%)
Most Common Occupations - Production, transportation, and material moving occupations (%)
Most Common Occupations - Production occupations (%)
Most Common Occupations - Transportation occupations (%)
Most Common Occupations - Material moving occupations (%)
People in Group quarters - Institutionalized population (%)
People in Group quarters - Correctional institutions (%)
People in Group quarters - Federal prisons and detention centers (%)
People in Group quarters - Halfway houses (%)
People in Group quarters - Local jails and other confinement facilities (including police lockups) (%)
People in Group quarters - Military disciplinary barracks (%)
People in Group quarters - State prisons (%)
People in Group quarters - Other types of correctional institutions (%)
People in Group quarters - Nursing homes (%)
People in Group quarters - Hospitals/wards, hospices, and schools for the handicapped (%)
People in Group quarters - Hospitals/wards and hospices for chronically ill (%)
People in Group quarters - Hospices or homes for chronically ill (%)
People in Group quarters - Military hospitals or wards for chronically ill (%)
People in Group quarters - Other hospitals or wards for chronically ill (%)
People in Group quarters - Hospitals or wards for drug/alcohol abuse (%)
People in Group quarters - Mental (Psychiatric) hospitals or wards (%)
People in Group quarters - Schools, hospitals, or wards for the mentally retarded (%)
People in Group quarters - Schools, hospitals, or wards for the physically handicapped (%)
People in Group quarters - Institutions for the deaf (%)
People in Group quarters - Institutions for the blind (%)
People in Group quarters - Orthopedic wards and institutions for the physically handicapped (%)
People in Group quarters - Wards in general hospitals for patients who have no usual home elsewhere (%)
People in Group quarters - Wards in military hospitals for patients who have no usual home elsewhere (%)
People in Group quarters - Juvenile institutions (%)
People in Group quarters - Long-term care (%)
People in Group quarters - Homes for abused, dependent, and neglected children (%)
People in Group quarters - Residential treatment centers for emotionally disturbed children (%)
People in Group quarters - Training schools for juvenile delinquents (%)
People in Group quarters - Short-term care, detention or diagnostic centers for delinquent children (%)
People in Group quarters - Type of juvenile institution unknown (%)
People in Group quarters - Noninstitutionalized population (%)
People in Group quarters - College dormitories (includes college quarters off campus) (%)
People in Group quarters - Military quarters (%)
People in Group quarters - On base (%)
People in Group quarters - Barracks, unaccompanied personnel housing (UPH), (Enlisted/Officer), ;and similar group living quarters for military personnel (%)
People in Group quarters - Transient quarters for temporary residents (%)
People in Group quarters - Military ships (%)
People in Group quarters - Group homes (%)
People in Group quarters - Homes or halfway houses for drug/alcohol abuse (%)
People in Group quarters - Homes for the mentally ill (%)
People in Group quarters - Homes for the mentally retarded (%)
People in Group quarters - Homes for the physically handicapped (%)
People in Group quarters - Other group homes (%)
People in Group quarters - Religious group quarters (%)
People in Group quarters - Dormitories (%)
People in Group quarters - Agriculture workers' dormitories on farms (%)
People in Group quarters - Job Corps and vocational training facilities (%)
People in Group quarters - Other workers' dormitories (%)
People in Group quarters - Crews of maritime vessels (%)
People in Group quarters - Other nonhousehold living situations (%)
People in Group quarters - Other noninstitutional group quarters (%)
Residents speaking English at home (%)
Residents speaking English at home - Born in the United States (%)
Residents speaking English at home - Native, born elsewhere (%)
Residents speaking English at home - Foreign born (%)
Residents speaking Spanish at home (%)
Residents speaking Spanish at home - Born in the United States (%)
Residents speaking Spanish at home - Native, born elsewhere (%)
Residents speaking Spanish at home - Foreign born (%)
Residents speaking other language at home (%)
Residents speaking other language at home - Born in the United States (%)
Residents speaking other language at home - Native, born elsewhere (%)
Residents speaking other language at home - Foreign born (%)
Class of Workers - Employee of private company (%)
Class of Workers - Self-employed in own incorporated business (%)
Class of Workers - Private not-for-profit wage and salary workers (%)
Class of Workers - Local government workers (%)
Class of Workers - State government workers (%)
Class of Workers - Federal government workers (%)
Class of Workers - Self-employed workers in own not incorporated business and Unpaid family workers (%)
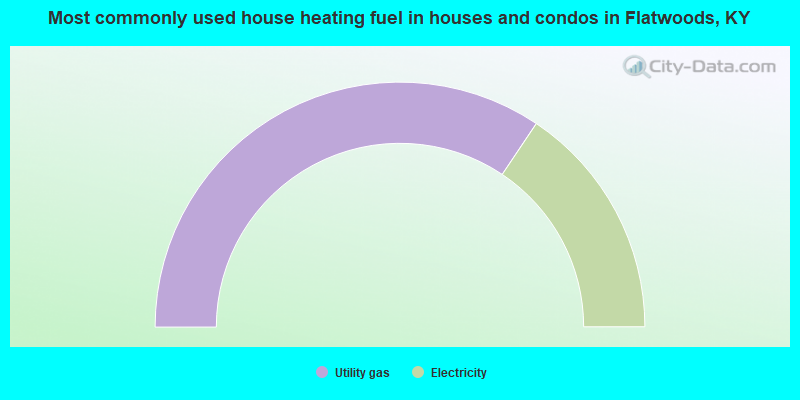
House heating fuel used in houses and condos - Utility gas (%)
House heating fuel used in houses and condos - Bottled, tank, or LP gas (%)
House heating fuel used in houses and condos - Electricity (%)
House heating fuel used in houses and condos - Fuel oil, kerosene, etc. (%)
House heating fuel used in houses and condos - Coal or coke (%)
House heating fuel used in houses and condos - Wood (%)
House heating fuel used in houses and condos - Solar energy (%)
House heating fuel used in houses and condos - Other fuel (%)
House heating fuel used in houses and condos - No fuel used (%)
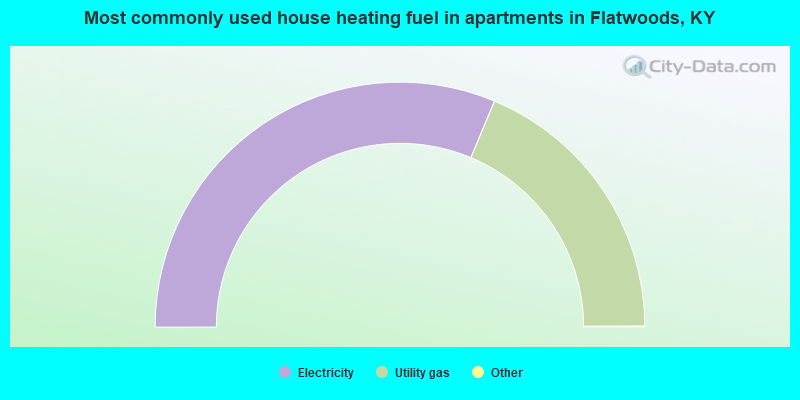
House heating fuel used in apartments - Utility gas (%)
House heating fuel used in apartments - Bottled, tank, or LP gas (%)
House heating fuel used in apartments - Electricity (%)
House heating fuel used in apartments - Fuel oil, kerosene, etc. (%)
House heating fuel used in apartments - Coal or coke (%)
House heating fuel used in apartments - Wood (%)
House heating fuel used in apartments - Solar energy (%)
House heating fuel used in apartments - Other fuel (%)
House heating fuel used in apartments - No fuel used (%)
Armed forces status - In Armed Forces (%)
Armed forces status - Civilian (%)
Armed forces status - Civilian - Veteran (%)
Armed forces status - Civilian - Nonveteran (%)
Fatal accidents locations in years 2005-2021
Fatal accidents locations in 2005
Fatal accidents locations in 2006
Fatal accidents locations in 2007
Fatal accidents locations in 2008
Fatal accidents locations in 2009
Fatal accidents locations in 2010
Fatal accidents locations in 2011
Fatal accidents locations in 2012
Fatal accidents locations in 2013
Fatal accidents locations in 2014
Fatal accidents locations in 2015
Fatal accidents locations in 2016
Fatal accidents locations in 2017
Fatal accidents locations in 2018
Fatal accidents locations in 2019
Fatal accidents locations in 2020
Fatal accidents locations in 2021
Alcohol use - People drinking some alcohol every month (%)
Alcohol use - People not drinking at all (%)
Alcohol use - Average days/month drinking alcohol
Alcohol use - Average drinks/week
Alcohol use - Average days/year people drink much
Audiometry - Average condition of hearing (%)
Audiometry - People that can hear a whisper from across a quiet room (%)
Audiometry - People that can hear normal voice from across a quiet room (%)
Audiometry - Ears ringing, roaring, buzzing (%)
Audiometry - Had a job exposure to loud noise (%)
Audiometry - Had off-work exposure to loud noise (%)
Blood Pressure & Cholesterol - Has high blood pressure (%)
Blood Pressure & Cholesterol - Checking blood pressure at home (%)
Blood Pressure & Cholesterol - Frequently checking blood cholesterol (%)
Blood Pressure & Cholesterol - Has high cholesterol level (%)
Consumer Behavior - Money monthly spent on food at supermarket/grocery store
Consumer Behavior - Money monthly spent on food at other stores
Consumer Behavior - Money monthly spent on eating out
Consumer Behavior - Money monthly spent on carryout/delivered foods
Consumer Behavior - Income spent on food at supermarket/grocery store (%)
Consumer Behavior - Income spent on food at other stores (%)
Consumer Behavior - Income spent on eating out (%)
Consumer Behavior - Income spent on carryout/delivered foods (%)
Current Health Status - General health condition (%)
Current Health Status - Blood donors (%)
Current Health Status - Has blood ever tested for HIV virus (%)
Current Health Status - Left-handed people (%)
Dermatology - People using sunscreen (%)
Diabetes - Diabetics (%)
Diabetes - Had a blood test for high blood sugar (%)
Diabetes - People taking insulin (%)
Diet Behavior & Nutrition - Diet health (%)
Diet Behavior & Nutrition - Milk product consumption (# of products/month)
Diet Behavior & Nutrition - Meals not home prepared (#/week)
Diet Behavior & Nutrition - Meals from fast food or pizza place (#/week)
Diet Behavior & Nutrition - Ready-to-eat foods (#/month)
Diet Behavior & Nutrition - Frozen meals/pizza (#/month)
Drug Use - People that ever used marijuana or hashish (%)
Drug Use - Ever used hard drugs (%)
Drug Use - Ever used any form of cocaine (%)
Drug Use - Ever used heroin (%)
Drug Use - Ever used methamphetamine (%)
Health Insurance - People covered by health insurance (%)
Kidney Conditions-Urology - Avg. # of times urinating at night
Medical Conditions - People with asthma (%)
Medical Conditions - People with anemia (%)
Medical Conditions - People with psoriasis (%)
Medical Conditions - People with overweight (%)
Medical Conditions - Elderly people having difficulties in thinking or remembering (%)
Medical Conditions - People who ever received blood transfusion (%)
Medical Conditions - People having trouble seeing even with glass/contacts (%)
Medical Conditions - People with arthritis (%)
Medical Conditions - People with gout (%)
Medical Conditions - People with congestive heart failure (%)
Medical Conditions - People with coronary heart disease (%)
Medical Conditions - People with angina pectoris (%)
Medical Conditions - People who ever had heart attack (%)
Medical Conditions - People who ever had stroke (%)
Medical Conditions - People with emphysema (%)
Medical Conditions - People with thyroid problem (%)
Medical Conditions - People with chronic bronchitis (%)
Medical Conditions - People with any liver condition (%)
Medical Conditions - People who ever had cancer or malignancy (%)
Mental Health - People who have little interest in doing things (%)
Mental Health - People feeling down, depressed, or hopeless (%)
Mental Health - People who have trouble sleeping or sleeping too much (%)
Mental Health - People feeling tired or having little energy (%)
Mental Health - People with poor appetite or overeating (%)
Mental Health - People feeling bad about themself (%)
Mental Health - People who have trouble concentrating on things (%)
Mental Health - People moving or speaking slowly or too fast (%)
Mental Health - People having thoughts they would be better off dead (%)
Oral Health - Average years since last visit a dentist
Oral Health - People embarrassed because of mouth (%)
Oral Health - People with gum disease (%)
Oral Health - General health of teeth and gums (%)
Oral Health - Average days a week using dental floss/device
Oral Health - Average days a week using mouthwash for dental problem
Oral Health - Average number of teeth
Pesticide Use - Households using pesticides to control insects (%)
Pesticide Use - Households using pesticides to kill weeds (%)
Physical Activity - People doing vigorous-intensity work activities (%)
Physical Activity - People doing moderate-intensity work activities (%)
Physical Activity - People walking or bicycling (%)
Physical Activity - People doing vigorous-intensity recreational activities (%)
Physical Activity - People doing moderate-intensity recreational activities (%)
Physical Activity - Average hours a day doing sedentary activities
Physical Activity - Average hours a day watching TV or videos
Physical Activity - Average hours a day using computer
Physical Functioning - People having limitations keeping them from working (%)
Physical Functioning - People limited in amount of work they can do (%)
Physical Functioning - People that need special equipment to walk (%)
Physical Functioning - People experiencing confusion/memory problems (%)
Physical Functioning - People requiring special healthcare equipment (%)
Prescription Medications - Average number of prescription medicines taking
Preventive Aspirin Use - Adults 40+ taking low-dose aspirin (%)
Reproductive Health - Vaginal deliveries (%)
Reproductive Health - Cesarean deliveries (%)
Reproductive Health - Deliveries resulted in a live birth (%)
Reproductive Health - Pregnancies resulted in a delivery (%)
Reproductive Health - Women breastfeeding newborns (%)
Reproductive Health - Women that had a hysterectomy (%)
Reproductive Health - Women that had both ovaries removed (%)
Reproductive Health - Women that have ever taken birth control pills (%)
Reproductive Health - Women taking birth control pills (%)
Reproductive Health - Women that have ever used Depo-Provera or injectables (%)
Reproductive Health - Women that have ever used female hormones (%)
Sexual Behavior - People 18+ that ever had sex (vaginal, anal, or oral) (%)
Sexual Behavior - Males 18+ that ever had vaginal sex with a woman (%)
Sexual Behavior - Males 18+ that ever performed oral sex on a woman (%)
Sexual Behavior - Males 18+ that ever had anal sex with a woman (%)
Sexual Behavior - Males 18+ that ever had any sex with a man (%)
Sexual Behavior - Females 18+ that ever had vaginal sex with a man (%)
Sexual Behavior - Females 18+ that ever performed oral sex on a man (%)
Sexual Behavior - Females 18+ that ever had anal sex with a man (%)
Sexual Behavior - Females 18+ that ever had any kind of sex with a woman (%)
Sexual Behavior - Average age people first had sex
Sexual Behavior - Average number of female sex partners in lifetime (males 18+)
Sexual Behavior - Average number of female vaginal sex partners in lifetime (males 18+)
Sexual Behavior - Average age people first performed oral sex on a woman (18+)
Sexual Behavior - Average number of woman performed oral sex on in lifetime (18+)
Sexual Behavior - Average number of male sex partners in lifetime (males 18+)
Sexual Behavior - Average number of male anal sex partners in lifetime (males 18+)
Sexual Behavior - Average age people first performed oral sex on a man (18+)
Sexual Behavior - Average number of male oral sex partners in lifetime (18+)
Sexual Behavior - People using protection when performing oral sex (%)
Sexual Behavior - Average number of times people have vaginal or anal sex a year
Sexual Behavior - People having sex without condom (%)
Sexual Behavior - Average number of male sex partners in lifetime (females 18+)
Sexual Behavior - Average number of male vaginal sex partners in lifetime (females 18+)
Sexual Behavior - Average number of female sex partners in lifetime (females 18+)
Sexual Behavior - Circumcised males 18+ (%)
Sleep Disorders - Average hours sleeping at night
Sleep Disorders - People that has trouble sleeping (%)
Smoking-Cigarette Use - People smoking cigarettes (%)
Taste & Smell - People 40+ having problems with smell (%)
Taste & Smell - People 40+ having problems with taste (%)
Taste & Smell - People 40+ that ever had wisdom teeth removed (%)
Taste & Smell - People 40+ that ever had tonsils teeth removed (%)
Taste & Smell - People 40+ that ever had a loss of consciousness because of a head injury (%)
Taste & Smell - People 40+ that ever had a broken nose or other serious injury to face or skull (%)
Taste & Smell - People 40+ that ever had two or more sinus infections (%)
Weight - Average height (inches)
Weight - Average weight (pounds)
Weight - Average BMI
Weight - People that are obese (%)
Weight - People that ever were obese (%)
Weight - People trying to lose weight (%)
According to our research of Kentucky and other state lists, there were 12 registered sex offenders living in Flatwoods, Kentucky as of May 05, 2024 . The ratio of all residents to sex offenders in Flatwoods is 617 to 1.The ratio of registered sex offenders to all residents in this city is lower than the state average.
Officers per 1,000 residents here:
0.71Kentucky average:
1.89
Latest news from Flatwoods, KY collected exclusively by city-data.com from local newspapers, TV, and radio stations
Ancestries: American (44.2%), English (27.8%), Irish (4.4%), German (4.1%), British (1.8%), Scottish (1.5%).
Current Local Time:
Incorporated on 07/14/1932
Land area: 4.49 square miles.
Population density: 1,611 people per square mile (low).
23 residents are foreign born
This city:
0.3%Kentucky:
4.1%
Median real estate property taxes paid for housing units with mortgages in 2022: $1,176 (0.9%)Median real estate property taxes paid for housing units with no mortgage in 2022: $1,051 (1.1%)
Nearest city with pop. 50,000+: Huntington, WV
Nearest city with pop. 200,000+: Fayette, KY
Nearest city with pop. 1,000,000+: Chicago, IL
Nearest cities:
Latitude: 38.52 N, Longitude: 82.72 W
Daytime population change due to commuting: -1,339 (-18.3%)Workers who live and work in this city: 512 (16.3%)
Single-family new house construction building permits:
2022: 15 buildings , average cost: $430,0002021: 15 buildings , average cost: $430,0002020: 13 buildings , average cost: $430,0002019: 10 buildings , average cost: $430,0002018: 10 buildings , average cost: $430,0002017: 9 buildings , average cost: $430,0002016: 7 buildings , average cost: $430,0002015: 6 buildings , average cost: $430,0002014: 5 buildings , average cost: $430,0002013: 10 buildings , average cost: $130,1002012: 7 buildings , average cost: $2,000,0002011: 2 buildings , average cost: $184,4002010: 7 buildings , average cost: $175,6002007: 15 buildings , average cost: $180,2002006: 19 buildings , average cost: $180,2002005: 12 buildings , average cost: $221,2002004: 1 building , cost: $2,578,0002003: 13 buildings , average cost: $73,1002002: 18 buildings , average cost: $121,5002001: 16 buildings , average cost: $44,5002000: 10 buildings , average cost: $81,4001999: 7 buildings , average cost: $89,4001998: 8 buildings , average cost: $157,1001997: 18 buildings , average cost: $85,500Unemployment in December 2023:
Most common occupations in Flatwoods, KY (%)
Both Males Females
Material recording, scheduling, dispatching, and distributing workers (5.3%)
Other sales and related occupations, including supervisors (5.3%)
Secretaries and administrative assistants (3.9%)
Information and record clerks, except customer service representatives (3.6%)
Health technologists and technicians (3.5%)
Other office and administrative support workers, including supervisors (3.4%)
Cashiers (3.3%)
Material recording, scheduling, dispatching, and distributing workers (7.9%)
Driver/sales workers and truck drivers (5.3%)
Electrical equipment mechanics and other installation, maintenance, and repair workers, including supervisors (5.1%)
Rail and water transportation workers (5.0%)
Other sales and related occupations, including supervisors (5.0%)
Other production occupations, including supervisors (5.0%)
Law enforcement workers, including supervisors (4.0%)
Secretaries and administrative assistants (6.9%)
Health technologists and technicians (6.4%)
Other office and administrative support workers, including supervisors (5.9%)
Other sales and related occupations, including supervisors (5.6%)
Information and record clerks, except customer service representatives (5.4%)
Cashiers (5.3%)
Building and grounds cleaning and maintenance occupations (4.6%)
Tornado activity:
Flatwoods-area historical tornado activity is significantly below Kentucky state average. It is 47% smaller than the overall U.S. average.
On 4/23/1968, a category F5 (max. wind speeds 261-318 mph) tornado 13.0 miles away from the Flatwoods city center killed 7 people and injured 93 people and caused between $500,000 and $5,000,000 in damages.
On 4/23/1968, a category F4 (max. wind speeds 207-260 mph) tornado 27.0 miles away from the city center killed 6 people and injured 364 people and caused between $5,000,000 and $50,000,000 in damages.
Earthquake activity:
Flatwoods-area historical earthquake activity is significantly above Kentucky state average. It is 13% greater than the overall U.S. average. On 7/27/1980 at 18:52:21, a magnitude 5.2 (5.1 MB, 4.7 MS, 5.0 UK, 5.2 UK, Class: Moderate, Intensity: VI - VII) earthquake occurred 69.9 miles away from the city center On 8/23/2011 at 17:51:04, a magnitude 5.8 (5.8 MW, Depth: 3.7 mi) earthquake occurred 263.3 miles away from Flatwoods center On 8/9/2020 at 12:07:37, a magnitude 5.1 (5.1 MW, Depth: 4.7 mi) earthquake occurred 167.4 miles away from the city center On 9/7/1988 at 02:28:09, a magnitude 4.6 (4.5 MB, 4.6 LG, Class: Light, Intensity: IV - V) earthquake occurred 68.1 miles away from the city center On 9/25/1998 at 19:52:52, a magnitude 5.2 (4.8 MB, 4.3 MS, 5.2 LG, 4.5 MW, Depth: 3.1 mi) earthquake occurred 239.3 miles away from Flatwoods center On 4/18/2008 at 09:36:59, a magnitude 5.4 (5.1 MB, 4.8 MS, 5.4 MW, 5.2 MW) earthquake occurred 279.7 miles away from the city center Magnitude types: regional Lg-wave magnitude (LG), body-wave magnitude (MB), surface-wave magnitude (MS), moment magnitude (MW) Natural disasters: The number of natural disasters in Greenup County (22) is greater than the US average (15).Major Disasters (Presidential) Declared: 16Emergencies Declared: 3Floods: 14, Storms: 13, Tornadoes: 7, Winter Storms: 6, Mudslides: 5, Landslides: 3, Blizzard: 1, Hurricane: 1, Snowfall: 1, Snowstorm: 1, Wind: 1, Other: 1 (Note: some incidents may be assigned to more than one category). Hospitals and medical centers in Flatwoods: OAKMONT MANOR (1100 GRANDVIEW DRIVE)
Other hospitals and medical centers near Flatwoods: OUR LADY OF BELLEFONTE HOSPITAL (about 2 miles away; ASHLAND, KY)
FMC - IRONTON (Dialysis Facility, about 2 miles away; IRONTON, OH)
BELLEFONTE HOME HEALTH CARE AGENCY (Home Health Center, about 3 miles away; IRONTON, OH)
KINGSBROOK LIFECARE CENTER (Nursing Home, about 3 miles away; ASHLAND, KY)
SANCTUARY OF THE OHIO VALLEY (Nursing Home, about 4 miles away; IRONTON, OH)
BRYANT HEALTH CARE CENTER INC (Nursing Home, about 4 miles away; IRONTON, OH)
JO-LIN HEALTH CENTER INC (Nursing Home, about 4 miles away; IRONTON, OH)
Amtrak stations near Flatwoods: 6 miles: ASHLAND (99 15TH ST.) Services: fully wheelchair accessible, enclosed waiting area, public restrooms, public payphones, vending machines, free short-term parking, free long-term parking, call for taxi service, public transit connection.
17 miles: HUNTINGTON (8TH AVE. & 10TH ST.) Services: ticket office, fully wheelchair accessible, enclosed waiting area, public restrooms, public payphones, free short-term parking, free long-term parking, call for taxi service.
20 miles: SOUTH PORTSMOUTH (SOUTH SHORE, RTE. 23 AT MAIN ST.) Services: fully wheelchair accessible, enclosed waiting area, free short-term parking, free long-term parking, call for taxi service.
Colleges/universities with over 2000 students nearest to Flatwoods:
Ashland Community and Technical College (about 6 miles; Ashland, KY ; Full-time enrollment: 2,482)
Marshall University (about 18 miles; Huntington, WV ; FT enrollment: 11,450)
Shawnee State University (about 21 miles; Portsmouth, OH ; FT enrollment: 4,160)
Morehead State University (about 45 miles; Morehead, KY ; FT enrollment: 7,523)
West Virginia State University (about 53 miles; Institute, WV ; FT enrollment: 2,133)
Big Sandy Community and Technical College (about 58 miles; Prestonsburg, KY ; FT enrollment: 2,660)
Maysville Community and Technical College (about 60 miles; Maysville, KY ; FT enrollment: 2,969)
Public elementary/middle school in Flatwoods:
See full list of schools located in Flatwoods Birthplace of: Billy Ray Cyrus - Singer-Songwriter, Squire Potter - Baseball player.
Greenup County has a predicted average indoor radon screening level between 2 and 4 pCi/L (pico curies per liter) - Moderate Potential Drinking water stations with addresses in Flatwoods and their reported violations in the past:
FLATWOODS WATER COMPANY (Population served: 7,605, Purch surface water):
Past health violations:
MCL, Monthly (TCR) - In NOV-2010, Contaminant: Coliform. Follow-up actions: St Public Notif requested (JAN-11-2011), St Formal NOV issued (JAN-11-2011), St Compliance achieved (MAR-10-2011), St Public Notif received (MAR-21-2011)
MCL, Monthly (TCR) - In SEP-2010, Contaminant: Coliform. Follow-up actions: St Public Notif requested (OCT-26-2010), St Formal NOV issued (OCT-26-2010), St Public Notif received (DEC-15-2010), St Compliance achieved (FEB-15-2011)
MCL, Monthly (TCR) - In JUL-2008, Contaminant: Coliform. Follow-up actions: St Public Notif requested (AUG-27-2008), St Formal NOV issued (AUG-27-2008), St Public Notif received (AUG-27-2008), St Compliance achieved (SEP-25-2008)
Past monitoring violations:
One regular monitoring violation
Average household size: This city:
2.4 peopleKentucky:
2.5 people
Percentage of family households: This city:
67.4%Whole state:
66.9%
Percentage of households with unmarried partners: This city:
5.2%Whole state:
6.4%
Likely homosexual households (counted as self-reported same-sex unmarried-partner households)
Lesbian couples: 0.6% of all households Gay men: 0.3% of all households
127 people in nursing facilities/skilled-nursing facilities in 2010people in group homes intended for adults in 2010people in nursing homes in 2000people in other nonhousehold living situations in 2000
Banks with branches in Flatwoods (2011 data):
Fifth Third Bank: Flatwoods Branch at 2131 Argillite Road, branch established on 1999/04/17. Info updated 2009/10/05: Bank assets: $114,540.4 mil, Deposits: $89,689.1 mil, headquarters in Cincinnati, OH, positive income , Commercial Lending Specialization, 1378 total offices , Holding Company: Fifth Third Bancorp
PNC Bank, National Association: Flatwoods Branch at 2205 Argillite, branch established on 1996/03/29. Info updated 2012/03/20: Bank assets: $263,309.6 mil, Deposits: $197,343.0 mil, headquarters in Wilmington, DE, positive income , Commercial Lending Specialization, 3085 total offices , Holding Company: Pnc Financial Services Group, Inc., The
Home Federal Savings and Loan Association: Flatwoods Branch at 1800 Argillite Road, branch established on 1889/01/01. Info updated 2011/09/28: Bank assets: $319.3 mil, Deposits: $249.5 mil, headquarters in Ashland, KY, positive income , Mortgage Lending Specialization, 6 total offices
First & Peoples Bank and Trust Company: Flatwoods Branch at Argilite Road, branch established on 1964/12/21. Info updated 2010/03/30: Bank assets: $195.4 mil, Deposits: $158.8 mil, headquarters in Russell, KY, positive income , 6 total offices , Holding Company: First & Peoples Bancshares, Inc.
For population 15 years and over in Flatwoods:
Never married: 22.1%Now married: 47.8%Separated: 2.4%Widowed: 11.8%Divorced: 16.0% For population 25 years and over in Flatwoods:
High school or higher: 89.1%Bachelor's degree or higher: 15.9%Graduate or professional degree: 9.6%Unemployed: 7.2%Mean travel time to work (commute): 20.0 minutes
Education Gini index (Inequality in education) Here:
9.9Kentucky average:
11.7
Religion statistics for Flatwoods, KY (based on Greenup County data)
Religion Adherents Congregations Evangelical Protestant 11,804 61 Mainline Protestant 2,368 15 Other 751 2 Black Protestant 483 3 Catholic 43 1 None 21,461 -
Source: Clifford Grammich, Kirk Hadaway, Richard Houseal, Dale E.Jones, Alexei Krindatch, Richie Stanley and Richard H.Taylor. 2012. 2010 U.S.Religion Census: Religious Congregations & Membership Study. Association of Statisticians of American Religious Bodies. Jones, Dale E., et al. 2002. Congregations and Membership in the United States 2000. Nashville, TN: Glenmary Research Center. Graphs represent county-level data
Food Environment Statistics: Number of grocery stores : 8Greenup County :
2.15 / 10,000 pop.State :
2.19 / 10,000 pop.
Number of convenience stores (no gas) : 2Greenup County :
0.54 / 10,000 pop.Kentucky :
0.74 / 10,000 pop.
Number of convenience stores (with gas) : 19Greenup County :
5.10 / 10,000 pop.Kentucky :
4.36 / 10,000 pop.
Number of full-service restaurants : 4This county :
1.07 / 10,000 pop.Kentucky :
5.74 / 10,000 pop.
Low-income preschool obesity rate : Health and Nutrition: Healthy diet rate : Flatwoods:
49.6%Kentucky:
49.9%
Average overall health of teeth and gums : People feeling badly about themselves : People not drinking alcohol at all : Flatwoods:
18.7%Kentucky:
10.1%
Average hours sleeping at night : This city:
6.9Kentucky:
6.8
Overweight people : Flatwoods:
37.3%Kentucky:
33.8%
General health condition : Flatwoods:
57.2%State:
56.8%
Average condition of hearing : More about Health and Nutrition of Flatwoods, KY Residents
Local government employment and payroll (March 2022)
Function
Full-time employees
Monthly full-time payroll
Average yearly full-time wage
Part-time employees
Monthly part-time payroll
Police Protection - Officers
11 $90,226 $98,428 0 $0 Water Supply
6 $42,049 $84,098 0 $0 Sewerage
5 $22,355 $53,652 0 $0 Police - Other
1 $3,759 $45,108 0 $0 Financial Administration
1 $6,212 $74,544 0 $0 Other Government Administration
1 $4,441 $53,292 11 $7,067
Totals for Government
25 $169,042 $81,140 11 $7,067
Flatwoods government finances - Expenditure in 2021 (per resident):
Construction - Regular Highways: $73,000 ($10.08)
Current Operations - Water Utilities: $1,544,000 ($213.17)
Sewerage: $995,000 ($137.37)Police Protection: $740,000 ($102.17)Central Staff Services: $406,000 ($56.05)Local Fire Protection: $395,000 ($54.54)Solid Waste Management: $388,000 ($53.57)Parks and Recreation: $145,000 ($20.02)Regular Highways: $12,000 ($1.66)General - Interest on Debt: $8,000 ($1.10)
Other Capital Outlay - Local Fire Protection: $121,000 ($16.71)
Water Utilities: $113,000 ($15.60)Police Protection: $111,000 ($15.33)Central Staff Services: $35,000 ($4.83)Parks and Recreation: $16,000 ($2.21)Total Salaries and Wages: $1,351,000 ($186.52)
Flatwoods government finances - Revenue in 2021 (per resident):
Charges - Sewerage: $1,528,000 ($210.96)
Solid Waste Management: $358,000 ($49.43)Other: $123,000 ($16.98)Parks and Recreation: $41,000 ($5.66)Federal Intergovernmental - Other: $381,000 ($52.60)
Local Intergovernmental - General Local Government Support: $120,000 ($16.57)
Miscellaneous - Rents: $29,000 ($4.00)
Interest Earnings: $10,000 ($1.38)Sale of Property: $6,000 ($0.83)Revenue - Water Utilities: $1,618,000 ($223.39)
State Intergovernmental - Highways: $200,000 ($27.61)
Other: $11,000 ($1.52)General Local Government Support: $2,000 ($0.28)Tax - Property: $997,000 ($137.65)
Insurance Premiums Sales: $703,000 ($97.06)Public Utilities Sales: $281,000 ($38.80)Occupation and Business License - Other: $30,000 ($4.14)Other License: $12,000 ($1.66)
Flatwoods government finances - Debt in 2021 (per resident):
Long Term Debt - Beginning Outstanding - Unspecified Public Purpose: $188,000 ($25.96)
Outstanding Unspecified Public Purpose: $157,000 ($21.68)Retired Unspecified Public Purpose: $31,000 ($4.28)
Flatwoods government finances - Cash and Securities in 2021 (per resident):
Other Funds - Cash and Securities: $3,824,000 ($527.96)
Sinking Funds - Cash and Securities: $185,000 ($25.54)
Businesses in Flatwoods, KY
Name Count Name Count
CVS 1 Little Caesars Pizza 1 Dairy Queen 1 McDonald's 1 FedEx 1 Rite Aid 1 H&R Block 1 Subway 1 La-Z-Boy 1 UPS 1
Strongest AM radio stations in Flatwoods:
WIRO (1230 AM; 1 kW; IRONTON, OH; Owner: CAPSTAR TX LIMITED PARTNERSHIP)
WLGC (1520 AM; daytime; 5 kW; GREENUP, KY; Owner: GREENUP COUNTY BROADCASTING, INC.)
WTCR (1420 AM; 5 kW; KENOVA, WV; Owner: CAPSTAR TX LIMITED PARTNERSHIP)
WOKT (1040 AM; daytime; 2 kW; CANNONSBURG, KY; Owner: BIG RIVER RADIO, INC.-KY)
WRVC (930 AM; 5 kW; HUNTINGTON, WV; Owner: FIFTH AVENUE BROADCASTING COMPANY, INC.)
WVHU (800 AM; 5 kW; HUNTINGTON, WV; Owner: CAPSTAR TX LIMITED PARTNERSHIP)
WHRD (1470 AM; 5 kW; HUNTINGTON, WV; Owner: CONCORD MEDIA GROUP, INC.)
WTVN (610 AM; 50 kW; COLUMBUS, OH; Owner: CITICASTERS LICENSES, L.P.)
WCMI (1340 AM; 1 kW; ASHLAND, KY; Owner: FIFTH AVENUE BROADCASTING CO., INC)
WGOH (1370 AM; 5 kW; GRAYSON, KY; Owner: CARTER COUNTY BROADCASTING CO., INC.)
WNXT (1260 AM; 5 kW; PORTSMOUTH, OH; Owner: HOMETOWN B/C OF PORTSMOUTH, INC.)
WBGS (1030 AM; daytime; 10 kW; POINT PLEASANT, WV; Owner: BIG RIVER RADIO, INC.)
WLW (700 AM; 50 kW; CINCINNATI, OH; Owner: JACOR BROADCASTING CORPORATION)
Strongest FM radio stations in Flatwoods:
WBKS (107.1 FM; IRONTON, OH; Owner: CAPSTAR TX LIMITED PARTNERSHIP)
WOUL-FM (89.1 FM; IRONTON, OH; Owner: OHIO UNIVERSITY)
WBVB (97.1 FM; COAL GROVE, OH; Owner: CAPSTAR TX LIMITED PARTNERSHIP)
WDGG (93.7 FM; ASHLAND, KY; Owner: FIFTH AVENUE B/CASTING COMPANY, INC.)
WRVC-FM (92.7 FM; CATLETTSBURG, KY; Owner: FIFTH AVENUE BROADCASTING CO., INC)
WPAY-FM (104.1 FM; PORTSMOUTH, OH; Owner: RADIO STATIONS WPAY/WPFB, INC.)
WLGC-FM (105.7 FM; GREENUP, KY; Owner: GREENUP COUNTY BROADCASTING, INC.)
WOSP (91.5 FM; PORTSMOUTH, OH; Owner: THE OHIO STATE UNIVERSITY)
WKEE-FM (100.5 FM; HUNTINGTON, WV; Owner: CAPSTAR TX LIMITED PARTNERSHIP)
WVWV (89.9 FM; HUNTINGTON, WV; Owner: WEST VIRGINIA EDUCATIONAL BROADCASTING AUTHORITY)
WAMX (106.3 FM; MILTON, WV; Owner: CAPSTAR TX LIMITED PARTNERSHIP)
WOHP (88.3 FM; PORTSMOUTH, OH; Owner: THE CEDARVILLE UNIVERSITY)
WKLC-FM (105.1 FM; ST. ALBANS, WV; Owner: WKLC, INC.)
WTCR-FM (103.3 FM; HUNTINGTON, WV; Owner: CAPSTAR TX LIMITED PARTNERSHIP)
WNXT-FM (99.3 FM; PORTSMOUTH, OH; Owner: HOMETOWN B/C OF PORTSMOUTH, INC.)
WOKE (98.3 FM; GARRISON, KY; Owner: BIG RIVER RADIO, INC.)
W215AV (90.9 FM; SOUTH PORTSMOUTH, KY; Owner: CALVARY CHAPEL OF TWIN FALLS, INC.)
WZZZ (107.5 FM; PORTSMOUTH, OH; Owner: HOMETOWN BROADCASTING OF PORTSMOUTH 2, INC.)
W216AT (91.1 FM; ASHLAND, KY; Owner: AMERICAN FAMILY ASSOCIATION)
WRAU (94.9 FM; SOUTH WEBSTER, OH; Owner: IM-MEDIA BROADCASTING, INC.)
TV broadcast stations around Flatwoods:
WKAS (Channel 25; ASHLAND, KY; Owner: KENTUCKY AUTHORITY FOR EDUCATIONAL TV)
WPBY-TV (Channel 33; HUNTINGTON, WV; Owner: WEST VIRGINIA EDUCATIONAL BROADCASTING AUTHORITY)
WSAZ-TV (Channel 3; HUNTINGTON, WV; Owner: EMMIS TELEVISION LICENSE CORPORATION)
WOWK-TV (Channel 13; HUNTINGTON, WV; Owner: WEST VIRGINIA MEDIA HOLDINGS, LLC)
WVAH-TV (Channel 11; CHARLESTON, WV; Owner: WVAH LICENSEE, LLC)
WPBO (Channel 42; PORTSMOUTH, OH; Owner: THE OHIO STATE UNIVERSITY)
WHCP (Channel 30; PORTSMOUTH, OH; Owner: TELEVISION PROPERTIES, INC.)
W49BN (Channel 49; HUNTINGTON, WV; Owner: PAXSON COMMUNCATIONS LPTV, INC.)
W14CU (Channel 14; HUNTINGTON, WV; Owner: VENTANA TELEVISION, INC.)
WCHS-TV (Channel 8; CHARLESTON, WV; Owner: WCHS LICENSEE, LLC)
WTSF (Channel 61; ASHLAND, KY; Owner: TRI STATE FAMILY BROADCASTING, INC.)
W05CB (Channel 5; BURLINGTON, OH; Owner: VEARL R. PENNINGTON)
W66CZ (Channel 66; PORTSMOUTH, OH; Owner: TRINITY BROADCASTING NETWORK)
W36CR (Channel 36; HUNTINGTON, WV; Owner: NATIONAL MINORITY T.V., INC.)
W55AT (Channel 55; HUNTINGTON, WV; Owner: CHANNEL AMERICA LPTV LIC. SUBSIDIARY)
National Bridge Inventory (NBI) Statistics 5 Number of bridges49ft / 15.3m Total length $120,000 Total costs1,275 Total average daily traffic5,045 Total future (year 2026) average daily traffic
FCC Registered Antenna Towers: 40 (
See the full list of FCC Registered Antenna Towers in Flatwoods )
FCC Registered Broadcast Land Mobile Towers: 7
City Garage (Lat: 38.510278 Lon: -82.677222), Type: Pipe, Structure height: 12.2 m, Call Sign: KIW903, Assigned Frequencies: 158.820 MHz, Grant Date: 07/23/2015, Expiration Date: 08/28/2025, Certifier: Bobby F Crager, Registrant: Federal Licensing Inc, 1588 Fairfield Road, Gettysburg, PA 17325, Phone: (717) 334-9262, Fax: (717) 334-6440 2513 Reed Street (Lat: 38.515556 Lon: -82.724167), Type: Tower, Structure height: 30.5 m, Call Sign: WPPZ335, Assigned Frequencies: 458.612 MHz, Grant Date: 01/13/2015, Expiration Date: 03/27/2025, Certifier: Robert W Carpenter, Registrant: Greenup Co. E-911, 301 Main St., # 7 Rm 313, Greenup, KY 41144, Phone: (606) 473-1411, Fax: (606) 473-6624, Email:
Jct Of St Rt 1458 & 5 (Lat: 38.476472 Lon: -82.706278), Type: Tower, Structure height: 9 m, Overall height: 12 m, Call Sign: WPRH593, Assigned Frequencies: 458.512 MHz, Grant Date: 09/11/2015, Expiration Date: 09/25/2025, Certifier: Bobby F Crager, Registrant: Federal Licensing Inc, 1588 Fairfield Road, Gettysburg, PA 17325, Phone: (717) 334-9262, Fax: (717) 334-6440 Us Rt 23 And Ky Rt 207 Int (Lat: 38.535917 Lon: -82.705722), Type: Pole, Structure height: 6 m, Call Sign: WPKR661, Assigned Frequencies: 457.775 MHz, Grant Date: 06/16/1997, Expiration Date: 06/16/2002, Cancellation Date: 01/25/2002, Certifier: Charles W Carman, Registrant: Us Filter Consolidated Electric Div, 141 S Lafayette Fwy, Saint Paul, MN 55107, Fax: (612) 224-3628 2513 Reed Street (Lat: 38.515556 Lon: -82.724167), Type: Tower, Structure height: 30.5 m, Call Sign: WPXX305, Assigned Frequencies: 155.265 MHz, Grant Date: 06/20/2013, Expiration Date: 06/25/2023, Cancellation Date: 08/26/2023, Certifier: Richard L Blevins, Registrant: Flatwoods Fire & Rescue Squad, 2513 Reed Street, Flatwoods, KY 41139, Phone: (606) 836-7177 Lat: 38.518833 Lon: -82.711333, Call Sign: WQWR747, Assigned Frequencies: 452.137 MHz, 452.162 MHz, 452.812 MHz, 457.137 MHz, 457.812 MHz, Grant Date: 11/02/2015, Expiration Date: 11/02/2025, Certifier: Steven Branim, Registrant: Continental Wireless, 10455 Vista Park Rd, Dallas, TX 75238, Phone: (972) 926-7443, Email:
Lat: 38.519667 Lon: -82.720056, Call Sign: WQZH845, Assigned Frequencies: 155.910 MHz, Grant Date: 05/22/2017, Expiration Date: 05/22/2027, Certifier: Ned Crisp, Registrant: B&c Communications, Inc, 8401 Meade Springer, Ashland, KY 41102, Phone: (606) 928-1098, Fax: (606) 928-1099, Email:
FCC Registered Microwave Towers: 3
SBA Flatwoods, Route 207, Box 503 (Lat: 38.516278 Lon: -82.738333), Type: Ltower, Structure height: 55.2 m, Overall height: 57 m, Call Sign: WQXM557, Assigned Frequencies: 11485.0 MHz, 11485.0 MHz, 11485.0 MHz, 11485.0 MHz, 11485.0 MHz, 11485.0 MHz, 11485.0 MHz, 11485.0 MHz, 11485.0 MHz, 11485.0 MHz... (+8 more), Grant Date: 04/14/2016, Expiration Date: 04/14/2026, Certifier: Kyle Quillen, Registrant: Agile Network Builders, LLC, 213 Market Ave N, Suite 310, Canton, OH 44702, Phone: (888) 494-0549, Fax: (330) 451-5720, Email:
FLATWOODS, 2099 Fountain Street (Ky13693-A) (Lat: 38.510167 Lon: -82.734000), Type: Ltower, Structure height: 46.3 m, Overall height: 47.5 m, Call Sign: WRNT612, Assigned Frequencies: 17900.0 MHz, 17900.0 MHz, 17900.0 MHz, 17900.0 MHz, 17900.0 MHz, 17900.0 MHz, 17900.0 MHz, 17900.0 MHz, 17900.0 MHz, Grant Date: 08/20/2021, Expiration Date: 08/20/2031, Cancellation Date: 09/22/2023, Certifier: Christophe Le Scanve, Registrant: Cellco Partnership, 5055 North Point Pkwy, Np2ne Network Engineering, Alpharetta, GA 30022, Phone: (770) 797-1070, Email:
Flatwoods TS, 2.5 Miles Nw Of (Lat: 37.286222 Lon: -82.528500), Type: Ltower, Structure height: 46.3 m, Call Sign: WCP802, Licensee ID: L00268142, Assigned Frequencies: 5974.85 MHz, 6034.15 MHz, 6063.80 MHz, 5974.85 MHz, 6034.15 MHz, 6063.80 MHz, 6725.00 MHz, 6745.00 MHz, 5974.85 MHz, 6034.15 MHz... (+19 more), Grant Date: 01/06/2022, Expiration Date: 03/11/2032, Registrant: Kentucky Power Company FCC Registered Amateur Radio Licenses: 78 (
See the full list of FCC Registered Amateur Radio Licenses in Flatwoods )
FAA Registered Aircraft: 2
Aircraft: CESSNA 182 (Category: Land, Seats: 4, Weight: Up to 12,499 Pounds, Speed: 119 mph), Engine: CONT MOTOR O-470 SERIES (230 HP) (Reciprocating)N-Number: 82N, N82N, N-82N, Serial Number: 33538, Airworthiness Date: 07/06/1956, Certificate Issue Date: 05/02/2018Registrant (Individual): Larry Lemaster, 106 Dwight St # A, Flatwoods, KY 41139Aircraft: BEECH 35-B33 (Category: Land, Seats: 4, Weight: Up to 12,499 Pounds, Speed: 138 mph), Engine: CONT MOTOR I0-470 SERIES (260 HP) (Reciprocating)N-Number: 9700Y, N9700Y, N-9700Y, Serial Number: CD-680, Year manufactured: 1963, Airworthiness Date: 10/01/1963, Certificate Issue Date: 05/09/2019Registrant (LLC): Blake Aviation LLC, 905 Bellefonte Rd, Flatwoods, KY 41139
Home Mortgage Disclosure Act Aggregated Statistics For Year 2009(Based on 2 partial tracts) A) FHA, FSA/RHS & VA B) Conventional C) Refinancings D) Home Improvement Loans E) Loans on Dwellings For 5+ Families F) Non-occupant Loans on G) Loans On Manufactured Number Average Value Number Average Value Number Average Value Number Average Value Number Average Value Number Average Value Number Average Value
LOANS ORIGINATED 20 $112,188 41 $83,355 127 $100,292 19 $24,563 0 $0 20 $109,158 1 $43,570 APPLICATIONS APPROVED, NOT ACCEPTED 1 $32,590 2 $109,840 11 $107,277 2 $43,440 0 $0 1 $86,660 1 $32,590 APPLICATIONS DENIED 2 $113,150 11 $82,659 53 $95,992 14 $21,246 1 $64,510 2 $49,595 3 $39,907 APPLICATIONS WITHDRAWN 1 $122,160 4 $87,362 19 $112,752 1 $24,040 0 $0 2 $42,415 1 $50,650 FILES CLOSED FOR INCOMPLETENESS 1 $61,850 0 $0 3 $70,550 0 $0 0 $0 0 $0 0 $0
Aggregated Statistics For Year 2008(Based on 2 partial tracts) A) FHA, FSA/RHS & VA B) Conventional C) Refinancings D) Home Improvement Loans E) Loans on Dwellings For 5+ Families F) Non-occupant Loans on G) Loans On Manufactured Number Average Value Number Average Value Number Average Value Number Average Value Number Average Value Number Average Value Number Average Value
LOANS ORIGINATED 22 $96,139 46 $86,486 90 $82,823 16 $26,386 1 $150,980 26 $69,203 2 $26,900 APPLICATIONS APPROVED, NOT ACCEPTED 2 $118,545 3 $120,597 12 $85,160 3 $29,523 0 $0 3 $43,857 0 $0 APPLICATIONS DENIED 2 $67,500 9 $77,184 76 $87,936 17 $31,760 0 $0 5 $77,236 3 $87,607 APPLICATIONS WITHDRAWN 4 $120,915 3 $156,140 20 $99,606 2 $60,535 0 $0 1 $147,910 0 $0 FILES CLOSED FOR INCOMPLETENESS 0 $0 1 $56,200 5 $85,558 0 $0 0 $0 0 $0 0 $0
Aggregated Statistics For Year 2007(Based on 2 partial tracts) A) FHA, FSA/RHS & VA B) Conventional C) Refinancings D) Home Improvement Loans E) Loans on Dwellings For 5+ Families F) Non-occupant Loans on G) Loans On Manufactured Number Average Value Number Average Value Number Average Value Number Average Value Number Average Value Number Average Value Number Average Value
LOANS ORIGINATED 29 $93,489 73 $82,963 91 $79,995 30 $43,795 1 $119,720 26 $55,171 5 $27,868 APPLICATIONS APPROVED, NOT ACCEPTED 2 $102,530 4 $79,892 14 $68,449 4 $37,738 0 $0 0 $0 2 $79,250 APPLICATIONS DENIED 8 $81,639 19 $74,731 72 $93,649 20 $53,343 0 $0 5 $137,804 5 $47,616 APPLICATIONS WITHDRAWN 1 $181,900 5 $102,856 31 $101,674 1 $30,410 0 $0 2 $70,620 0 $0 FILES CLOSED FOR INCOMPLETENESS 0 $0 4 $100,480 4 $164,805 1 $23,940 0 $0 1 $79,760 0 $0
Aggregated Statistics For Year 2006(Based on 2 partial tracts) A) FHA, FSA/RHS & VA B) Conventional C) Refinancings D) Home Improvement Loans E) Loans on Dwellings For 5+ Families F) Non-occupant Loans on G) Loans On Manufactured Number Average Value Number Average Value Number Average Value Number Average Value Number Average Value Number Average Value Number Average Value
LOANS ORIGINATED 14 $84,087 79 $83,829 96 $70,617 29 $35,438 1 $101,100 24 $58,149 2 $31,980 APPLICATIONS APPROVED, NOT ACCEPTED 0 $0 8 $84,790 20 $71,006 7 $57,347 0 $0 4 $75,820 3 $40,127 APPLICATIONS DENIED 4 $83,645 27 $59,447 80 $83,500 26 $34,775 0 $0 14 $47,691 9 $33,863 APPLICATIONS WITHDRAWN 2 $69,835 3 $87,893 37 $87,402 5 $30,276 0 $0 0 $0 1 $69,580 FILES CLOSED FOR INCOMPLETENESS 0 $0 4 $68,062 11 $84,881 4 $85,292 0 $0 1 $139,670 0 $0
Aggregated Statistics For Year 2005(Based on 2 partial tracts) A) FHA, FSA/RHS & VA B) Conventional C) Refinancings D) Home Improvement Loans E) Loans on Dwellings For 5+ Families F) Non-occupant Loans on G) Loans On Manufactured Number Average Value Number Average Value Number Average Value Number Average Value Number Average Value Number Average Value Number Average Value
LOANS ORIGINATED 17 $74,349 88 $73,327 92 $82,572 31 $39,257 1 $72,500 22 $57,240 6 $43,582 APPLICATIONS APPROVED, NOT ACCEPTED 1 $51,710 10 $59,275 17 $73,494 6 $41,023 0 $0 2 $67,440 4 $43,572 APPLICATIONS DENIED 3 $55,557 35 $55,172 121 $89,850 20 $38,246 0 $0 11 $52,396 13 $34,380 APPLICATIONS WITHDRAWN 2 $54,400 9 $100,192 47 $90,317 6 $131,100 0 $0 2 $43,860 0 $0 FILES CLOSED FOR INCOMPLETENESS 0 $0 5 $94,348 8 $88,679 2 $71,165 0 $0 2 $54,865 1 $12,640
Aggregated Statistics For Year 2004(Based on 2 partial tracts) A) FHA, FSA/RHS & VA B) Conventional C) Refinancings D) Home Improvement Loans E) Loans on Dwellings For 5+ Families F) Non-occupant Loans on G) Loans On Manufactured Number Average Value Number Average Value Number Average Value Number Average Value Number Average Value Number Average Value Number Average Value
LOANS ORIGINATED 12 $84,612 102 $71,714 114 $77,038 20 $33,237 1 $63,180 26 $48,414 5 $40,684 APPLICATIONS APPROVED, NOT ACCEPTED 2 $78,730 16 $60,799 20 $86,334 2 $30,425 0 $0 0 $0 3 $27,830 APPLICATIONS DENIED 5 $99,560 29 $57,635 97 $75,987 21 $27,428 0 $0 4 $93,218 12 $36,714 APPLICATIONS WITHDRAWN 0 $0 8 $69,636 53 $79,498 4 $36,502 0 $0 0 $0 2 $48,005 FILES CLOSED FOR INCOMPLETENESS 2 $90,885 4 $76,600 8 $101,234 1 $29,930 0 $0 1 $59,730 1 $2,660
Aggregated Statistics For Year 2003(Based on 2 partial tracts) A) FHA, FSA/RHS & VA B) Conventional C) Refinancings D) Home Improvement Loans E) Loans on Dwellings For 5+ Families F) Non-occupant Loans on Number Average Value Number Average Value Number Average Value Number Average Value Number Average Value Number Average Value
LOANS ORIGINATED 15 $79,931 81 $70,101 174 $76,707 15 $18,233 0 $0 18 $48,666 APPLICATIONS APPROVED, NOT ACCEPTED 2 $37,780 6 $55,135 32 $67,266 3 $13,747 0 $0 2 $97,365 APPLICATIONS DENIED 4 $63,535 43 $64,787 99 $70,066 17 $38,422 1 $1,330,200 9 $78,582 APPLICATIONS WITHDRAWN 0 $0 7 $84,107 52 $74,258 2 $18,185 0 $0 2 $81,615 FILES CLOSED FOR INCOMPLETENESS 1 $81,190 3 $75,603 10 $77,813 1 $19,950 0 $0 0 $0
Aggregated Statistics For Year 2002(Based on 2 partial tracts) A) FHA, FSA/RHS & VA B) Conventional C) Refinancings D) Home Improvement Loans E) Loans on Dwellings For 5+ Families F) Non-occupant Loans on Number Average Value Number Average Value Number Average Value Number Average Value Number Average Value Number Average Value
LOANS ORIGINATED 11 $74,806 65 $68,808 165 $70,253 26 $10,045 2 $95,245 21 $43,258 APPLICATIONS APPROVED, NOT ACCEPTED 2 $73,825 23 $60,560 19 $67,313 5 $19,672 0 $0 2 $33,030 APPLICATIONS DENIED 3 $46,620 53 $45,480 78 $62,273 18 $14,576 0 $0 5 $46,692 APPLICATIONS WITHDRAWN 0 $0 9 $55,361 56 $67,878 7 $10,033 0 $0 2 $42,490 FILES CLOSED FOR INCOMPLETENESS 2 $51,000 0 $0 2 $66,010 0 $0 0 $0 0 $0
Aggregated Statistics For Year 2001(Based on 2 partial tracts) A) FHA, FSA/RHS & VA B) Conventional C) Refinancings D) Home Improvement Loans E) Loans on Dwellings For 5+ Families F) Non-occupant Loans on Number Average Value Number Average Value Number Average Value Number Average Value Number Average Value Number Average Value
LOANS ORIGINATED 13 $69,714 74 $67,243 183 $63,925 32 $13,035 1 $99,770 25 $46,533 APPLICATIONS APPROVED, NOT ACCEPTED 0 $0 12 $41,818 21 $59,932 3 $21,377 0 $0 0 $0 APPLICATIONS DENIED 1 $54,540 42 $40,480 74 $54,464 23 $14,680 0 $0 7 $29,170 APPLICATIONS WITHDRAWN 0 $0 7 $59,827 43 $58,922 9 $16,178 0 $0 2 $84,030 FILES CLOSED FOR INCOMPLETENESS 1 $35,250 2 $45,470 10 $68,306 0 $0 0 $0 0 $0
Aggregated Statistics For Year 2000(Based on 2 partial tracts) A) FHA, FSA/RHS & VA B) Conventional C) Refinancings D) Home Improvement Loans F) Non-occupant Loans on Number Average Value Number Average Value Number Average Value Number Average Value Number Average Value
LOANS ORIGINATED 18 $62,138 82 $59,025 73 $52,277 28 $12,200 17 $44,211 APPLICATIONS APPROVED, NOT ACCEPTED 4 $36,208 12 $38,277 22 $61,126 6 $25,963 0 $0 APPLICATIONS DENIED 5 $58,662 45 $42,061 58 $47,987 14 $19,797 3 $39,583 APPLICATIONS WITHDRAWN 2 $48,005 9 $67,328 45 $53,155 2 $23,280 2 $46,340 FILES CLOSED FOR INCOMPLETENESS 1 $37,910 0 $0 5 $53,452 0 $0 0 $0
Aggregated Statistics For Year 1999(Based on 2 partial tracts) A) FHA, FSA/RHS & VA B) Conventional C) Refinancings D) Home Improvement Loans F) Non-occupant Loans on Number Average Value Number Average Value Number Average Value Number Average Value Number Average Value
LOANS ORIGINATED 6 $67,138 69 $54,866 114 $52,492 35 $12,641 23 $36,707 APPLICATIONS APPROVED, NOT ACCEPTED 0 $0 15 $39,425 21 $51,022 5 $14,648 0 $0 APPLICATIONS DENIED 0 $0 52 $37,382 61 $50,584 16 $15,852 4 $37,578 APPLICATIONS WITHDRAWN 1 $54,530 5 $69,888 33 $53,402 2 $33,080 4 $36,612 FILES CLOSED FOR INCOMPLETENESS 0 $0 0 $0 7 $60,120 1 $11,110 0 $0
Detailed HMDA statistics for the following Tracts:
0402.00
, 0403.00
Private Mortgage Insurance Companies Aggregated Statistics For Year 2009(Based on 2 partial tracts) A) Conventional B) Refinancings Number Average Value Number Average Value
LOANS ORIGINATED 2 $101,365 1 $109,630 APPLICATIONS APPROVED, NOT ACCEPTED 0 $0 1 $96,450 APPLICATIONS DENIED 1 $59,860 0 $0 APPLICATIONS WITHDRAWN 0 $0 0 $0 FILES CLOSED FOR INCOMPLETENESS 0 $0 0 $0
Aggregated Statistics For Year 2008(Based on 2 partial tracts) A) Conventional B) Refinancings C) Non-occupant Loans on Number Average Value Number Average Value Number Average Value
LOANS ORIGINATED 6 $84,808 4 $115,585 1 $93,780 APPLICATIONS APPROVED, NOT ACCEPTED 3 $66,723 2 $97,195 0 $0 APPLICATIONS DENIED 0 $0 0 $0 0 $0 APPLICATIONS WITHDRAWN 0 $0 1 $70,500 0 $0 FILES CLOSED FOR INCOMPLETENESS 0 $0 0 $0 0 $0
Aggregated Statistics For Year 2007(Based on 2 partial tracts) A) Conventional B) Refinancings C) Non-occupant Loans on Number Average Value Number Average Value Number Average Value
LOANS ORIGINATED 22 $80,789 8 $111,391 1 $37,640 APPLICATIONS APPROVED, NOT ACCEPTED 5 $78,124 2 $107,695 0 $0 APPLICATIONS DENIED 0 $0 0 $0 0 $0 APPLICATIONS WITHDRAWN 2 $103,140 1 $58,530 0 $0 FILES CLOSED FOR INCOMPLETENESS 1 $53,210 0 $0 0 $0
Aggregated Statistics For Year 2006(Based on 2 partial tracts) A) Conventional B) Refinancings C) Non-occupant Loans on Number Average Value Number Average Value Number Average Value
LOANS ORIGINATED 16 $76,136 7 $90,853 1 $58,530 APPLICATIONS APPROVED, NOT ACCEPTED 2 $91,850 2 $108,045 1 $51,140 APPLICATIONS DENIED 0 $0 0 $0 0 $0 APPLICATIONS WITHDRAWN 0 $0 1 $72,310 0 $0 FILES CLOSED FOR INCOMPLETENESS 0 $0 0 $0 0 $0
Aggregated Statistics For Year 2005(Based on 2 partial tracts) A) Conventional B) Refinancings C) Non-occupant Loans on Number Average Value Number Average Value Number Average Value
LOANS ORIGINATED 17 $67,589 5 $117,250 3 $35,077 APPLICATIONS APPROVED, NOT ACCEPTED 5 $65,578 2 $111,850 0 $0 APPLICATIONS DENIED 0 $0 0 $0 0 $0 APPLICATIONS WITHDRAWN 2 $78,545 1 $58,880 0 $0 FILES CLOSED FOR INCOMPLETENESS 1 $62,810 0 $0 0 $0
Aggregated Statistics For Year 2004(Based on 2 partial tracts) A) Conventional B) Refinancings C) Non-occupant Loans on Number Average Value Number Average Value Number Average Value
LOANS ORIGINATED 23 $71,573 7 $113,016 3 $50,127 APPLICATIONS APPROVED, NOT ACCEPTED 3 $62,990 3 $71,587 1 $65,840 APPLICATIONS DENIED 0 $0 1 $164,940 0 $0 APPLICATIONS WITHDRAWN 1 $45,170 0 $0 0 $0 FILES CLOSED FOR INCOMPLETENESS 0 $0 0 $0 0 $0
Aggregated Statistics For Year 2003(Based on 2 partial tracts) A) Conventional B) Refinancings C) Non-occupant Loans on Number Average Value Number Average Value Number Average Value
LOANS ORIGINATED 15 $76,080 11 $88,842 1 $83,630 APPLICATIONS APPROVED, NOT ACCEPTED 2 $89,380 3 $60,570 1 $40,310 APPLICATIONS DENIED 1 $123,710 0 $0 0 $0 APPLICATIONS WITHDRAWN 0 $0 0 $0 0 $0 FILES CLOSED FOR INCOMPLETENESS 0 $0 1 $99,880 0 $0
Aggregated Statistics For Year 2002(Based on 2 partial tracts) A) Conventional B) Refinancings C) Non-occupant Loans on Number Average Value Number Average Value Number Average Value
LOANS ORIGINATED 12 $98,972 10 $90,832 1 $63,180 APPLICATIONS APPROVED, NOT ACCEPTED 3 $89,053 5 $91,916 0 $0 APPLICATIONS DENIED 0 $0 0 $0 0 $0 APPLICATIONS WITHDRAWN 0 $0 1 $49,220 1 $49,220 FILES CLOSED FOR INCOMPLETENESS 0 $0 0 $0 0 $0
Aggregated Statistics For Year 2001(Based on 2 partial tracts) A) Conventional B) Refinancings C) Non-occupant Loans on Number Average Value Number Average Value Number Average Value
LOANS ORIGINATED 12 $72,582 10 $79,322 1 $47,770 APPLICATIONS APPROVED, NOT ACCEPTED 1 $75,820 2 $87,475 0 $0 APPLICATIONS DENIED 1 $114,400 2 $70,170 1 $29,930 APPLICATIONS WITHDRAWN 0 $0 0 $0 0 $0 FILES CLOSED FOR INCOMPLETENESS 0 $0 0 $0 0 $0
Aggregated Statistics For Year 2000(Based on 2 partial tracts) A) Conventional B) Refinancings Number Average Value Number Average Value
LOANS ORIGINATED 14 $75,281 1 $60,120 APPLICATIONS APPROVED, NOT ACCEPTED 1 $85,800 0 $0 APPLICATIONS DENIED 1 $23,280 0 $0 APPLICATIONS WITHDRAWN 0 $0 0 $0 FILES CLOSED FOR INCOMPLETENESS 0 $0 1 $46,560
Aggregated Statistics For Year 1999(Based on 2 partial tracts) A) Conventional B) Refinancings Number Average Value Number Average Value
LOANS ORIGINATED 7 $59,076 3 $78,803 APPLICATIONS APPROVED, NOT ACCEPTED 1 $28,920 0 $0 APPLICATIONS DENIED 0 $0 0 $0 APPLICATIONS WITHDRAWN 1 $30,260 0 $0 FILES CLOSED FOR INCOMPLETENESS 0 $0 0 $0
Detailed PMIC statistics for the following Tracts:
0402.00
, 0403.00
Most common first names in Flatwoods, KY among deceased individuals Name Count Lived (average)
James 50 67.7 years Mary 50 79.6 years William 44 71.3 years Charles 42 71.3 years John 39 69.0 years George 21 80.3 years Hazel 18 79.8 years Betty 18 72.6 years Robert 18 73.6 years Ruth 17 79.2 years
Most common last names in Flatwoods, KY among deceased individuals Last name Count Lived (average)
Williams 26 77.9 years Brown 21 68.5 years Clark 21 73.4 years Stevens 20 72.9 years Adkins 19 68.6 years Tackett 17 76.4 years Smith 15 69.9 years Martin 14 76.7 years Moore 13 67.7 years Bailey 13 67.8 years
Flatwoods compared to Kentucky state average:
Median house value below state average. Unemployed percentage below state average. Black race population percentage significantly below state average. Hispanic race population percentage significantly below state average. Foreign-born population percentage significantly below state average. Length of stay since moving in significantly above state average. Number of college students below state average.
#4 on the list of "Top 101 cities with the highest cost per building permit(population 5,000+)"
#16 on the list of "Top 101 cities with the largest city-data.com crime index decrease from 2011 to 2012 (population 5,000+)"
#19 on the list of "Top 101 cities with largest percentage of males in industries: retail trade (population 5,000+)"
#34 on the list of "Top 101 cities with the lowest number of thefts per 100,000 residents (population 5,000+)"
#71 on the list of "Top 101 cities with the highest percentage of English-only speaking households, population 5,000+"
#89 on the list of "Top 100 safest cities (lowest city-data.com crime index) (pop. 5,000+)"
#94 on the list of "Top 101 counties with the highest Sulfur Oxides Annual air pollution readings in 2012 (µg/m3 )"
Top Patent Applicants
David Slagel (3)
John Wright (3)
Michael Phillip Carter (1)
Phillip Ryan Adams (1)
Clarence Edward Adkins (1)
Dwaine Drew Evans, Jr. (1)
Total of 10 patent applications in 2008-2024.
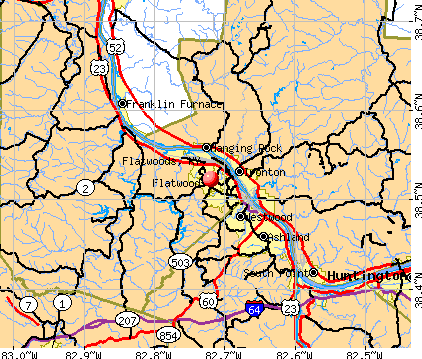


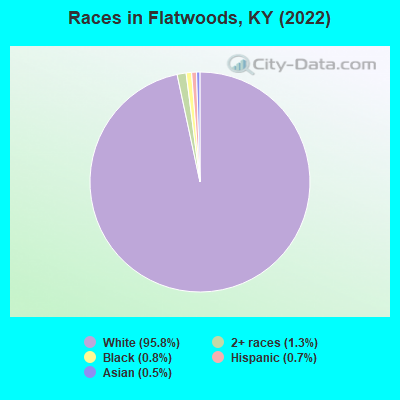
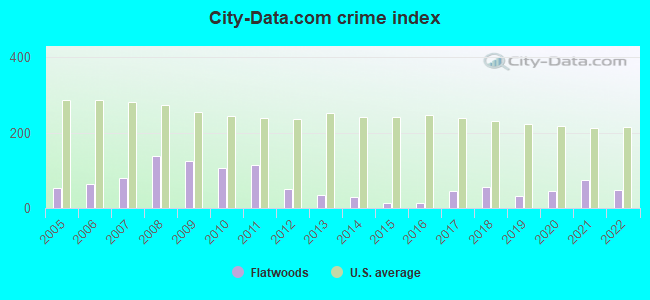
 Recent articles from our blog. Our writers, many of them Ph.D. graduates or candidates, create easy-to-read articles on a wide variety of topics.

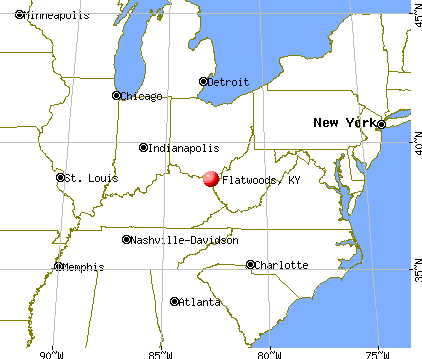
 (17.3 miles
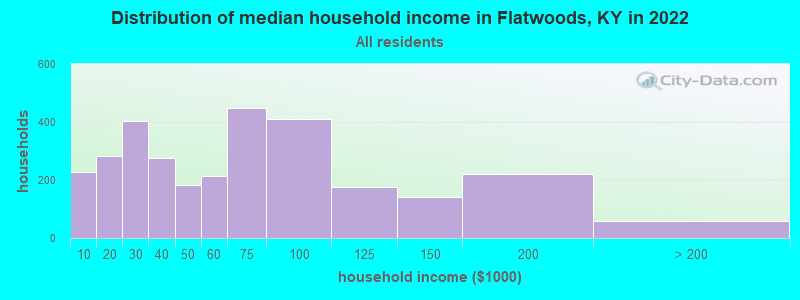
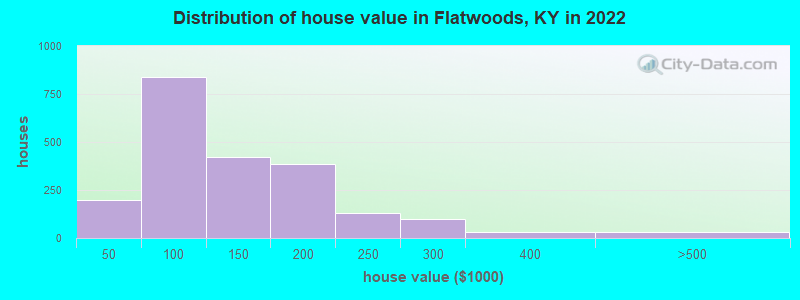
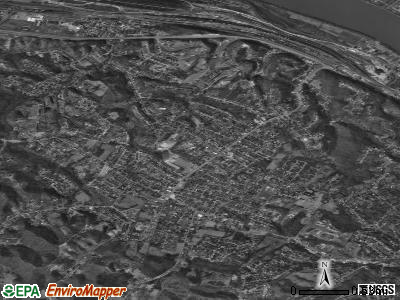
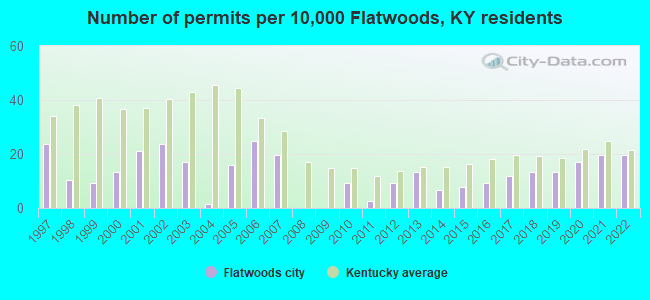
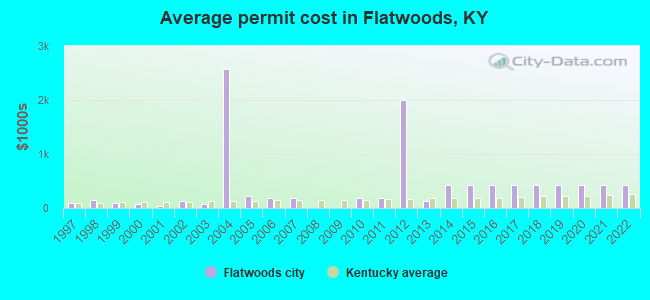
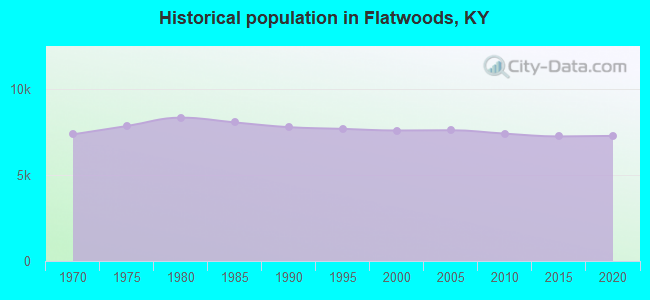
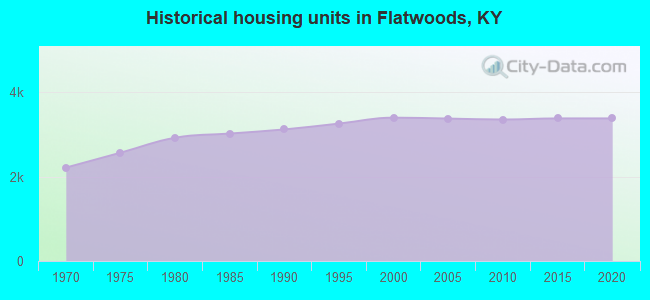
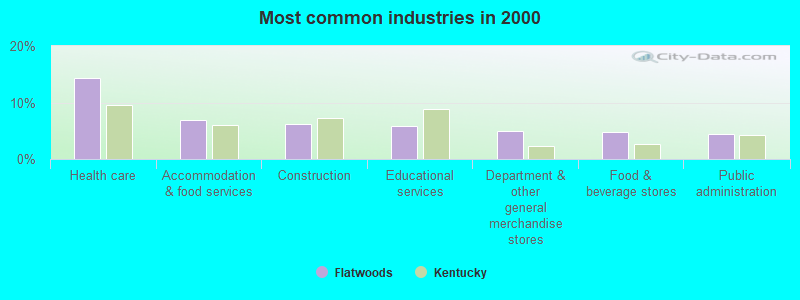
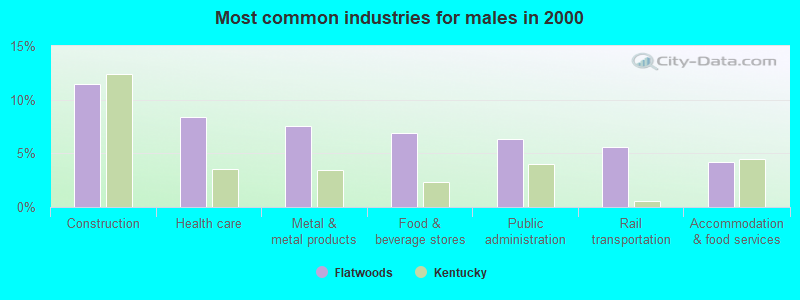
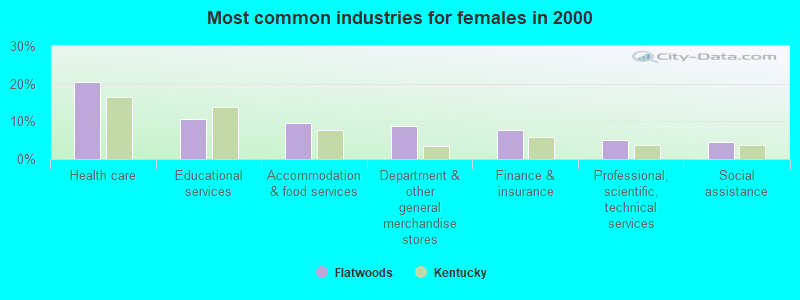
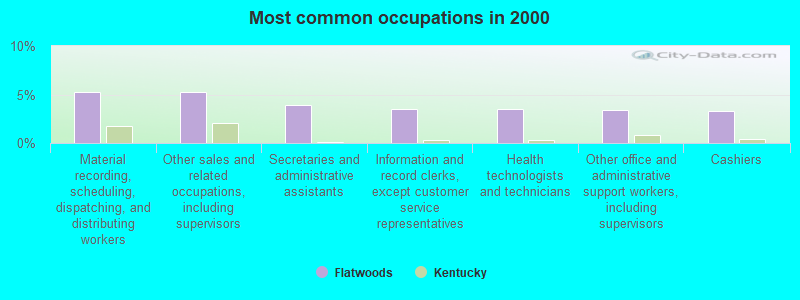
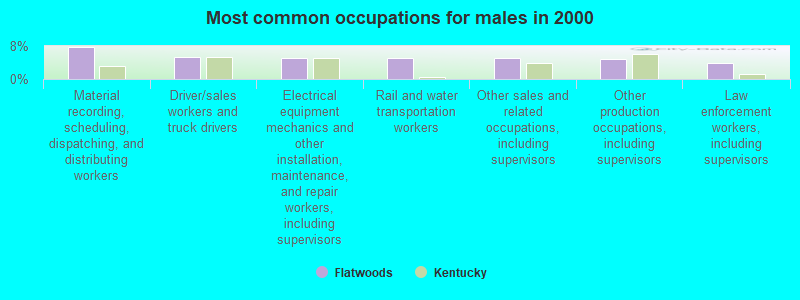
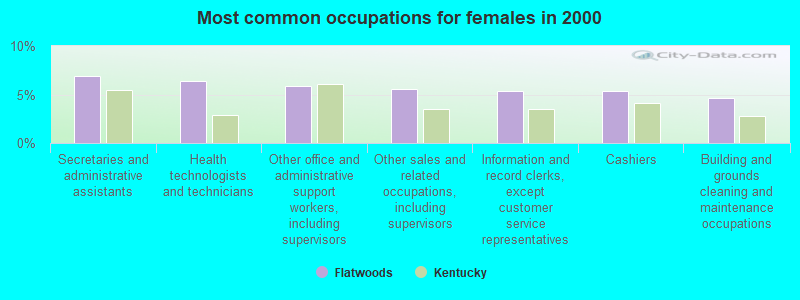
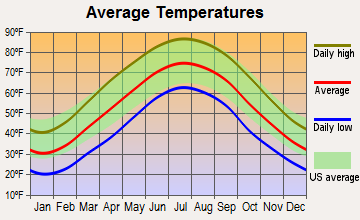
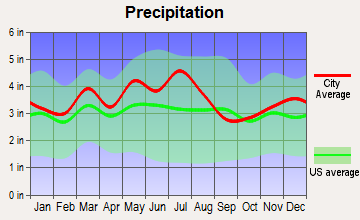
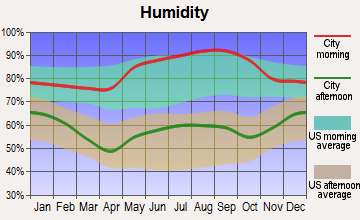
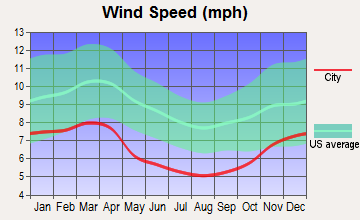
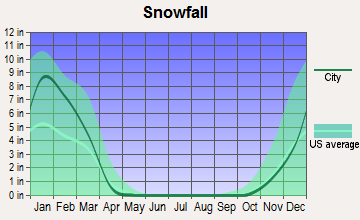
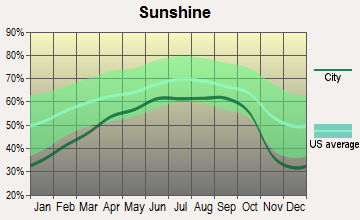
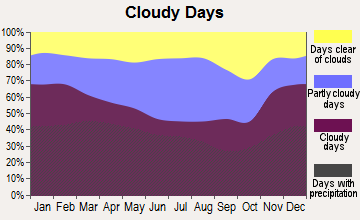
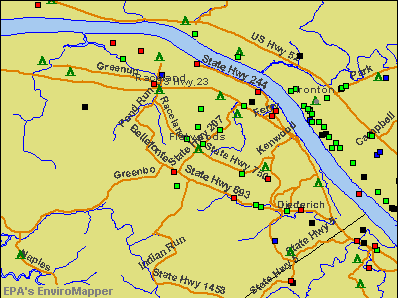

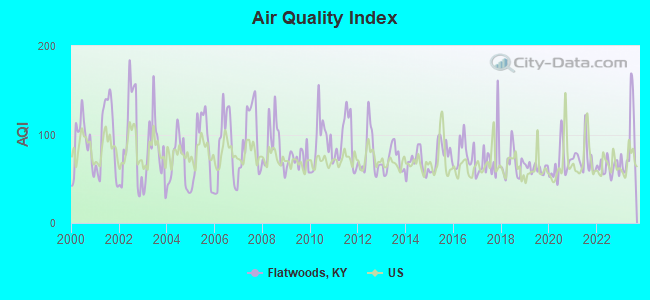
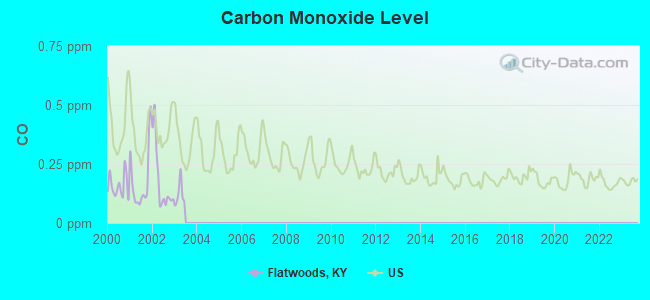
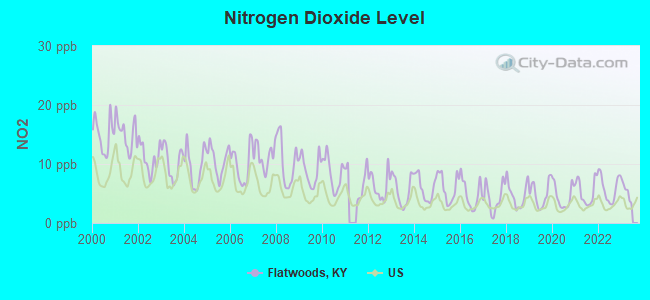
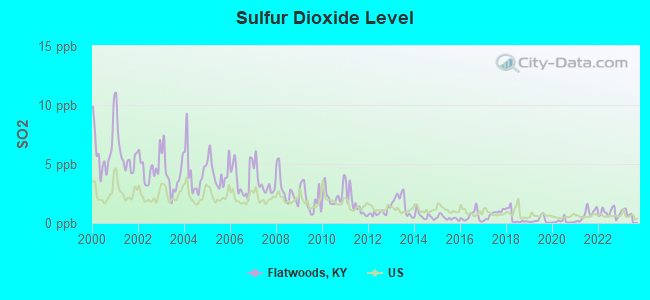
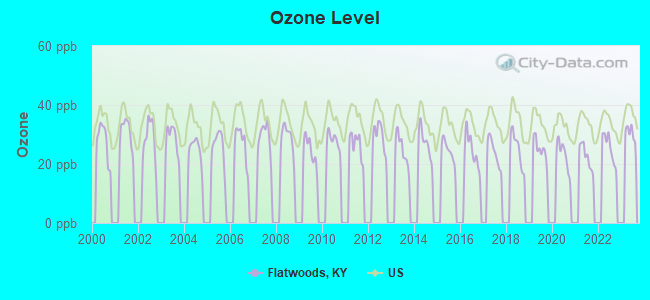
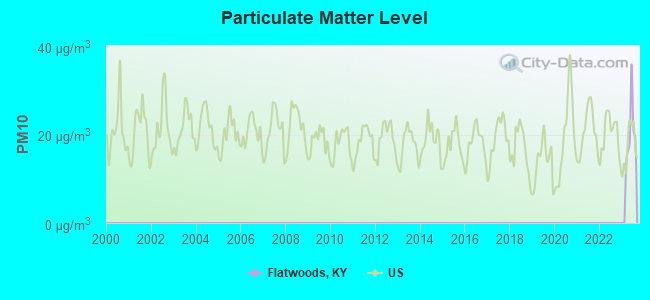
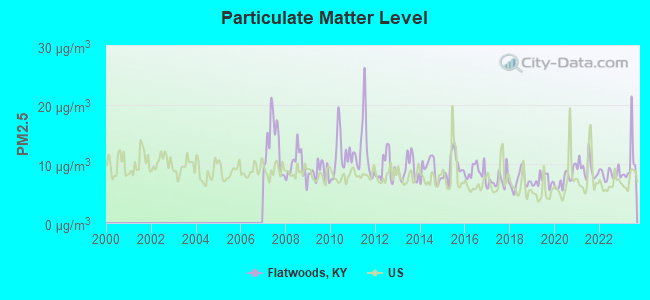

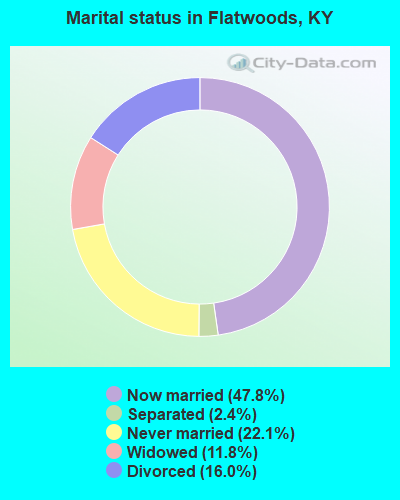
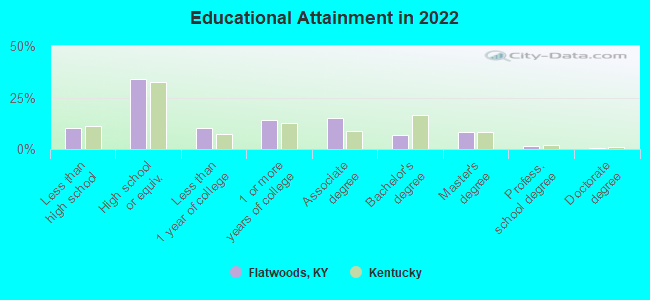
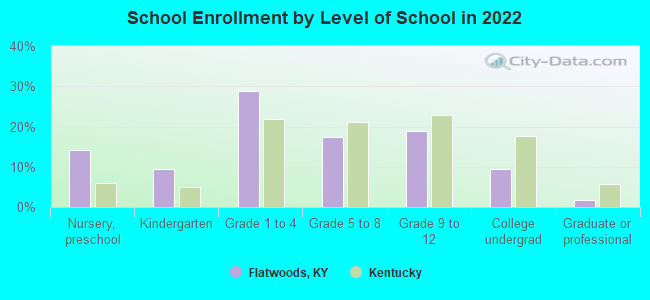
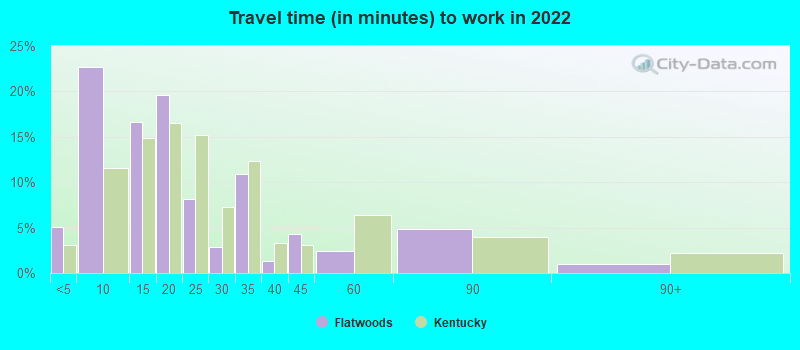
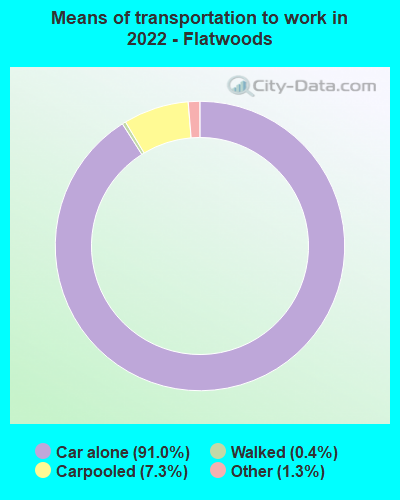
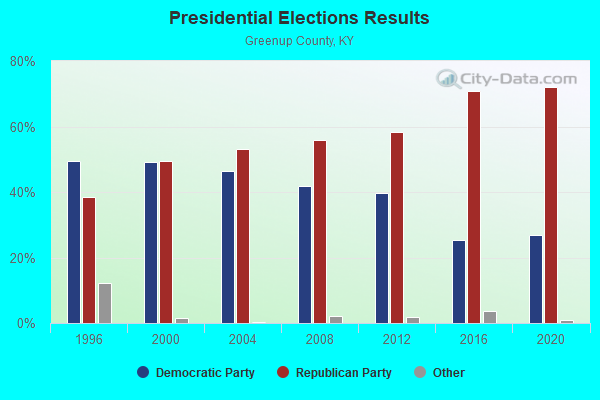
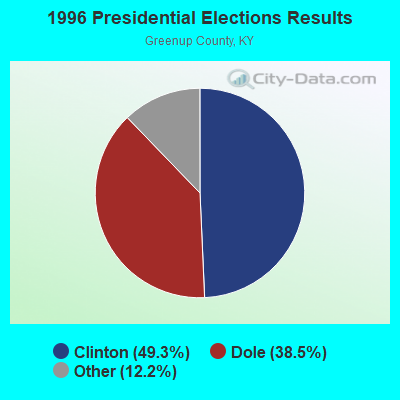
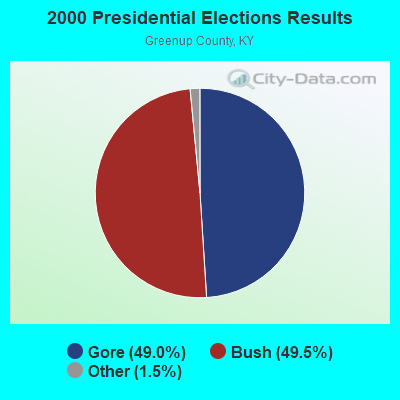
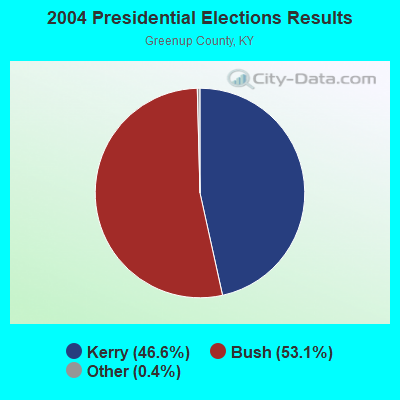
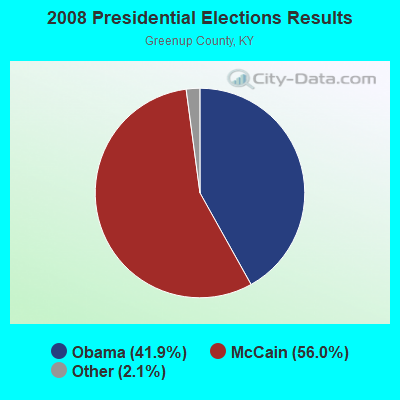
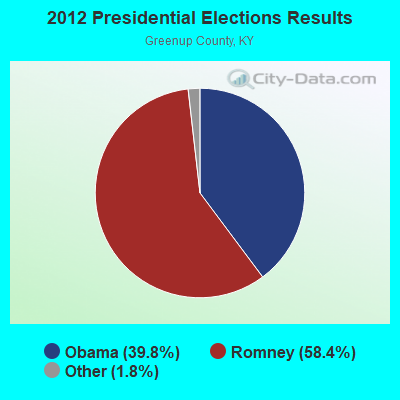
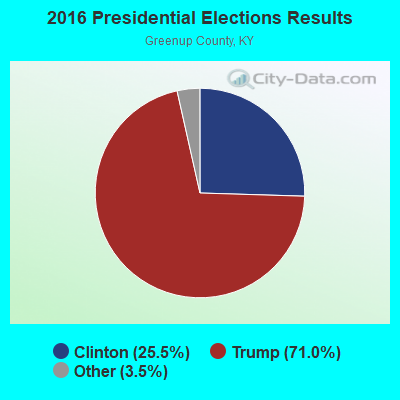
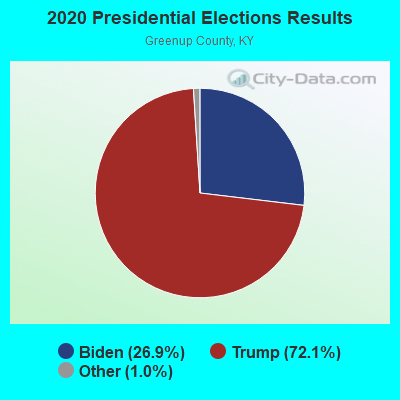
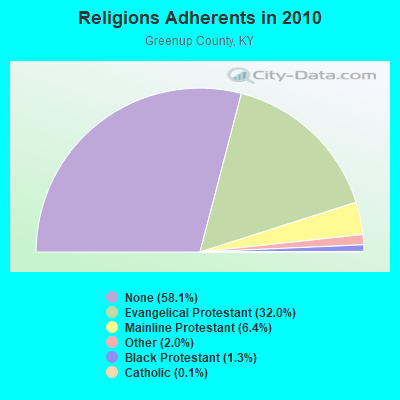
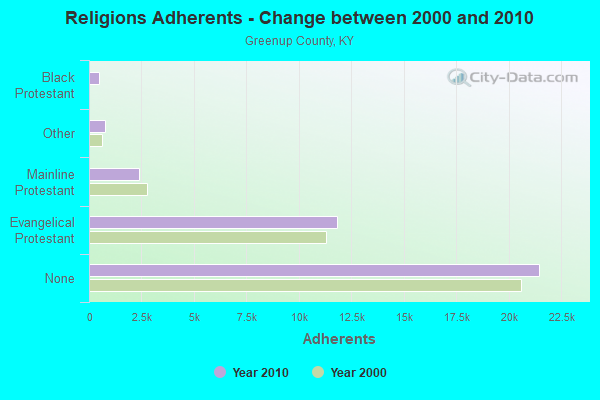
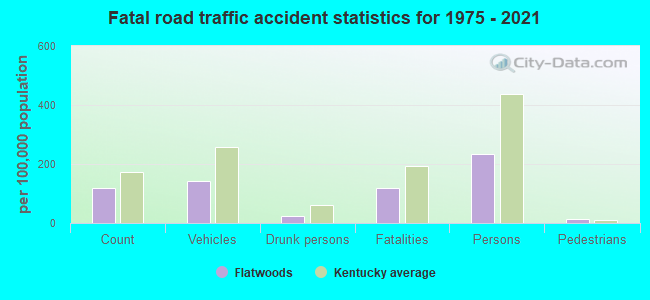
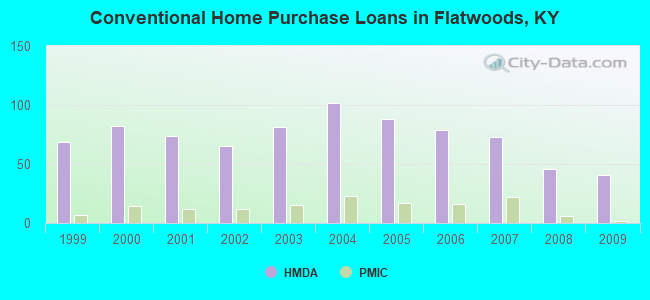
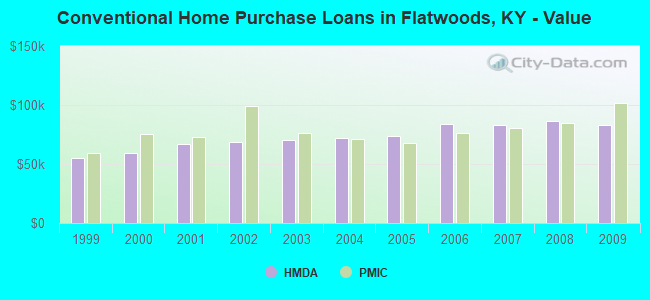
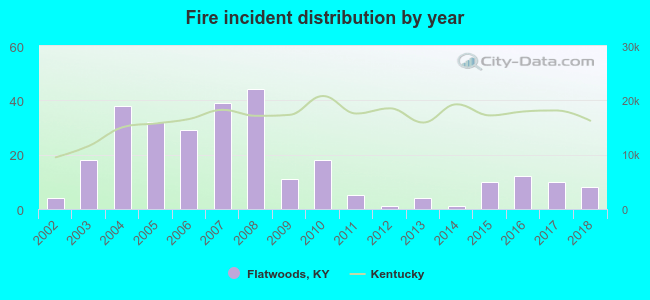 According to the data from the years 2002 - 2018 the average number of fire incidents per year is 17. The highest number of reported fires - 44 took place in 2008, and the least - 1 in 2012. The data has a growing trend.
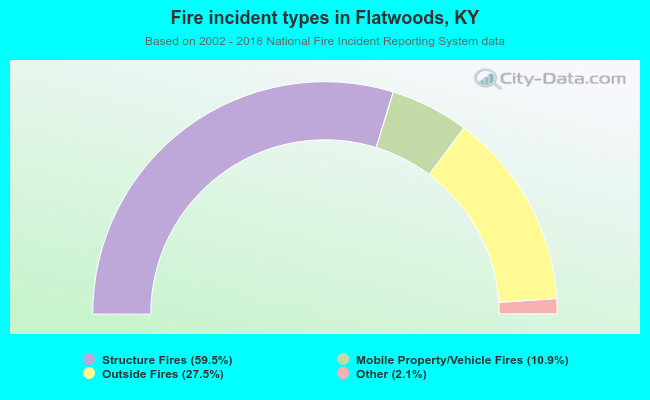 When looking into fire subcategories, the most incidents belonged to: Structure Fires (59.5%), and Outside Fires (27.5%).