Flatwoods: Fire Incidents, Kentucky (KY)
Where are fire incidents reported in Flatwoods, KY
Something went wrong! Please refresh the page.
|
| |||||||||||||||||||||||||||||||||||||||||||||||||||||||||||||||||||||||||||||||||||||||||||||||||||||||||||||
2002 - 2018 National Fire Incident Reporting System (NFIRS) incidents
- Incident types reported to NFIRS in Flatwoods, KY
- 41142.6%Hazardous Condition
- 28429.4%Fire
- 14214.7%Service Call
- 555.7%Good Intent Call
- 434.5%Rescue & EMS
- 282.9%False Alarm
- 10.1%Overpressure Rupture
- 10.1%Severe Weather
- Fire incident types reported to NFIRS in Flatwoods, KY
- 16959.5%Structure Fires
- 7827.5%Outside Fires
- 3110.9%Mobile Property/Vehicle Fires
- 62.1%Other
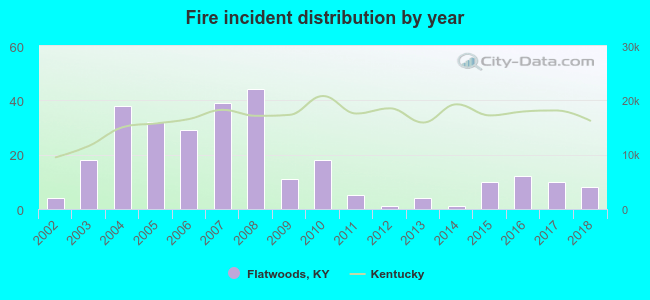 According to the data from the years 2002 - 2018 the average number of fire incidents per year is 17. The highest number of fire incidents - 44 took place in 2008, and the least - 1 in 2012. The data has a rising trend.
The average number of yearly fire incidents per 10k residents in Flatwoods, KY compared to nearest cities:
(Note: Based on data for the last 3 years, including only cities with population 5,000 and above)
| Flatwoods: | 13.5 |
| Ashland: | 28.4 |
| Cannonsburg: | 3.1 |

 26.4% incidents where reported in the morning and 73.6% in the evening. The most fires (18.7%) took place on Tuesday, and the least (11.3%) on Thursday.
 Based on the 284 fires from years 2002 - 2018 most fires (14.8%) took place during March, and the least (4.9%) in December.
 Out of all 965 cases reported during the years 2002 - 2018, the most belonged to the categories: Hazardous Condition (42.6%), Fire (29.4%), and Service Call (14.7%).
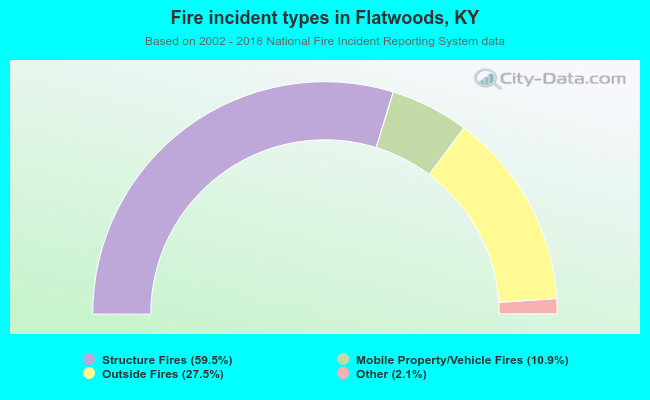 When looking into fire subcategories, the most reports belonged to: Structure Fires (59.5%), and Outside Fires (27.5%).