Guttenberg, New Jersey

Guttenberg: View from street level at Galaxy Towers in late afternoon

Guttenberg: Guttenberg Post Office.

Guttenberg: View from street level at Galaxy Towers in late afternoon

Guttenberg: Guttenberg Post Office.
- add
your
Submit your own pictures of this town and show them to the world
- OSM Map
- General Map
- Google Map
- MSN Map
Population change since 2000: +5.9%
 |
| Males: 5,187 | |
| Females: 6,259 |
| Median resident age: | 37.8 years |
| New Jersey median age: | 40.4 years |
Zip codes: 07093.
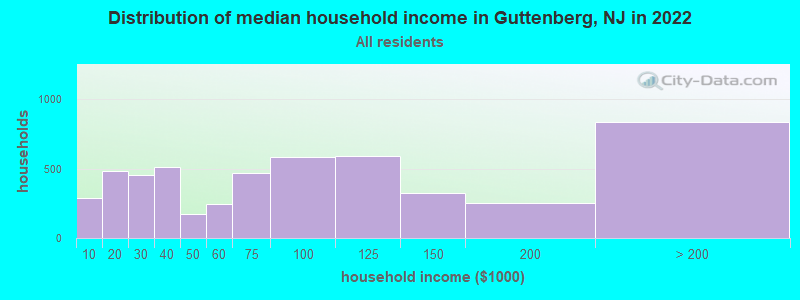
| Guttenberg: | $72,855 |
| NJ: | $96,346 |
Estimated per capita income in 2022: $44,387 (it was $27,931 in 2000)
Guttenberg town income, earnings, and wages data
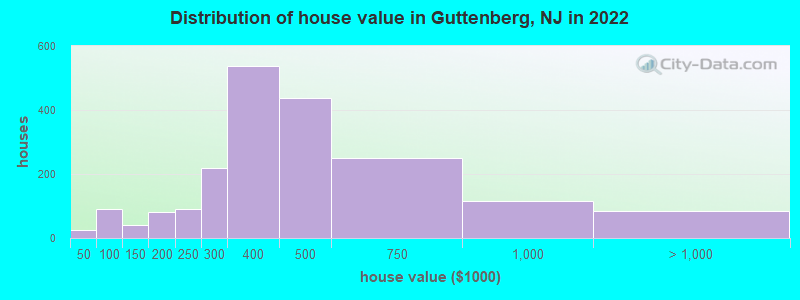
Estimated median house or condo value in 2022: $393,921 (it was $166,300 in 2000)
| Guttenberg: | $393,921 |
| NJ: | $428,900 |
Mean prices in 2022: all housing units: $428,344; detached houses: $553,355; townhouses or other attached units: $470,040; in 2-unit structures: $446,884; in 3-to-4-unit structures: $475,040; in 5-or-more-unit structures: $406,651
Median gross rent in 2022: $1,706.
(9.8% for White Non-Hispanic residents, 25.7% for Black residents, 18.3% for Hispanic or Latino residents, 26.5% for other race residents, 15.0% for two or more races residents)
Detailed information about poverty and poor residents in Guttenberg, NJ

Compare current foreclosures near Guttenberg, NJ:
| Photo | Address | Area | Beds / Baths | Price | Details |
|---|---|---|---|---|---|

|
#1
Tilden St # 4b
Bronx, NY 10467
|
1,000 sq. feet
|
1 baths 2 beds |
$139,900
|
show details |

|
#2
Grand Concourse Apt 3c
Bronx, NY 10452
|
700 sq. feet
|
1 baths 1 beds |
$184,500
|
show details |

|
#3
Beverly Rd
Oradell, NJ 07649
|
1,200 sq. feet
|
1 baths 3 beds |
$569,900
|
show details |

|
#4
N Broadway Apt A6
Yonkers, NY 10701
|
950 sq. feet
|
2 baths 2 beds |
$219,900
|
show details |

|
#5
177th St
Jamaica, NY 11433
|
1,156 sq. feet
|
1 baths 3 beds |
$450,000
|
show details |

|
#6
Tulip Ave # Gl2
Floral Park, NY 11001
|
1,200 sq. feet
|
1 baths 2 beds |
$409,900
|
show details |

|
#7
Swinton Ave
Bronx, NY 10465
|
1,938 sq. feet
|
2 baths 3 beds |
$789,900
|
show details |

|
#8
90th St Apt 5d
Jackson Heights, NY 11372
|
1,000 sq. feet
|
1 baths 2 beds |
$289,900
|
show details |

|
#9
A Somers St
Brooklyn, NY 11233
|
1,830 sq. feet
|
2 baths 4 beds |
$749,900
|
show details |

|
#10
237th Street
Elmont, NY 11003
|
1,323 sq. feet
|
2 baths 4 beds |
$468,000
|
show details |
| Photo | Address | Area | Beds / Baths | Price | Details |
|---|---|---|---|---|---|

|
#11
17th Ave 1st Floor
Whitestone, NY 11357
|
610 sq. feet
|
1 baths 1 beds |
$229,900
|
show details |

|
#12
E 221st St
Bronx, NY 10467
|
1,890 sq. feet
|
2 baths 3 beds |
$554,900
|
show details |

|
#13
Midland Ave Apt 4h
Bronxville, NY 10708
|
900 sq. feet
|
1 baths 1 beds |
$184,000
|
show details |

|
#14
Jersey Ave
Fairview, NJ 07022
|
1,073 sq. feet
|
1 baths 3 beds |
$434,900
|
show details |

|
#15
Fordham Hill Oval
Bronx, NY 10468
|
700 sq. feet
|
1 baths 1 beds |
$154,900
|
show details |

|
#16
Martin Dr
Harrington Park, NJ 07640
|
1,746 sq. feet
|
3 baths 3 beds |
$965,000
|
show details |

|
#17
Bay 19th St
Brooklyn, NY 11214
|
880 sq. feet
|
1 baths 2 beds |
$425,000
|
show details |

|
#18
E 73rd St
New York, NY 10021
|
1,253 sq. feet
|
2 baths 2 beds |
$715,000
|
show details |

|
#19
E 32nd St Apt C7
Brooklyn, NY 11210
|
670 sq. feet
|
1 baths 1 beds |
$299,900
|
show details |

|
#20
Pearsall Dr
Mount Vernon, NY 10552
|
650 sq. feet
|
1 baths 1 beds |
$127,500
|
show details |
| Photo | Address | Area | Beds / Baths | Price | Details |
|---|---|---|---|---|---|

|
#21
Horizon Rd Apt 803
Fort Lee, NJ 07024
|
843 sq. feet
|
1 baths 1 beds |
$178,900
|
show details |

|
#22
S Orange Ave
Newark, NJ 07103
|
989 sq. feet
|
1 baths 2 beds |
$289,900
|
show details |

|
#23
Davenport Ave Apt 1b
New Rochelle, NY 10805
|
750 sq. feet
|
1 baths 1 beds |
$159,900
|
show details |

|
#24
Summer St Apt 5e
Passaic, NJ 07055
|
1,125 sq. feet
|
1 baths 2 beds |
$345,000
|
show details |

|
#25
Bloomfield Ave
Caldwell, NJ 07006
|
1,216 sq. feet
|
2 baths 2 beds |
$400,000
|
show details |

|
#26
2nd Ave # 5c
New York, NY 10029
|
550 sq. feet
|
1 baths 1 beds |
$448,900
|
show details |

|
#27
Central Park Ave Apt 9m
Yonkers, NY 10710
|
1,300 sq. feet
|
2 baths 3 beds |
$319,900
|
show details |

|
#28
Park Ave Apt 12
North Bergen, NJ 07047
|
835 sq. feet
|
1 baths 2 beds |
$379,900
|
show details |

|
#29
Washington St Apt 2
Hoboken, NJ 07030
|
1,036 sq. feet
|
1 baths 2 beds |
$409,900
|
show details |

|
#30
72nd Avenue
Bellerose, NY 11426
|
850 sq. feet
|
1 baths 1 beds |
$269,900
|
show details |
| Photo | Address | Area | Beds / Baths | Price | Details |
|---|---|---|---|---|---|

|
#31
Applegate Ave
Elizabeth, NJ 07202
|
808 sq. feet
|
1 baths 2 beds |
$355,000
|
show details |

|
#32
Forest Ave
Paramus, NJ 07652
|
2,428 sq. feet
|
3 baths 5 beds |
$749,900
|
show details |

|
#33
Francis Lewis Blvd
Queens Village, NY 11429
|
844 sq. feet
|
1 baths 2 beds |
$599,900
|
show details |

|
#34
Olinville Ave Apt 11c
Bronx, NY 10467
|
1,000 sq. feet
|
2 baths 3 beds |
$385,000
|
show details |

|
#35
Ashland Ave
East Orange, NJ 07017
|
2,254 sq. feet
|
1 baths 5 beds |
$272,000
|
show details |

|
#36
96th St
Ozone Park, NY 11417
|
1,520 sq. feet
|
2 baths 3 beds |
$729,900
|
show details |

|
#37
Huntington Rd
Union, NJ 07083
|
1,532 sq. feet
|
2 baths 3 beds |
$539,900
|
show details |

|
#38
203rd St
Saint Albans, NY 11412
|
- sq. feet
|
1 baths 4 beds |
$421,000
|
show details |

|
#39
Glannon Rd
Livingston, NJ 07039
|
- sq. feet
|
1 baths 3 beds |
$535,600
|
show details |

|
#40
E 56th St # 1700
New York, NY 10022
|
1,986 sq. feet
|
- baths 2 beds |
$995,000
|
show details |
| Photo | Address | Area | Beds / Baths | Price | Details |
|---|---|---|---|---|---|

|
#41
N 19th St
East Orange, NJ 07017
|
- sq. feet
|
3 baths 6 beds |
$399,900
|
show details |

|
#42
Richmond Rd
Staten Island, NY 10304
|
- sq. feet
|
1 baths 3 beds |
$634,400
|
show details |

|
#43
88th St Apt 4d
Howard Beach, NY 11414
|
- sq. feet
|
2 baths 2 beds |
$329,900
|
show details |

|
#44
Willow Rd W
Staten Island, NY 10314
|
- sq. feet
|
1 baths 3 beds |
$491,400
|
show details |

|
#45
-31 88th St 6h
Howard Beach, NY 11414
|
- sq. feet
|
1 baths 2 beds |
$261,000
|
show details |

|
#46
Watson Pl
Jamaica, NY 11433
|
- sq. feet
|
2 baths 3 beds |
$319,000
|
show details |

|
#47
13 77th St
Woodhaven, NY 11421
|
- sq. feet
|
4 baths 8 beds |
$660,000
|
show details |

|
#48
153rd St
Jamaica, NY 11433
|
- sq. feet
|
2 baths 3 beds |
$348,000
|
show details |

|
#49
Prospect Park SW 8
Brooklyn, NY 11218
|
- sq. feet
|
1 baths 1 beds |
$719,900
|
show details |

|
Check over 1 million property listings on Foreclosure.com!
|
browse all offers | |||


- 7,80667.2%Hispanic
- 2,25919.4%White alone
- 7836.7%Asian alone
- 3232.8%Two or more races
- 2672.3%Black alone
- 1861.6%Other race alone
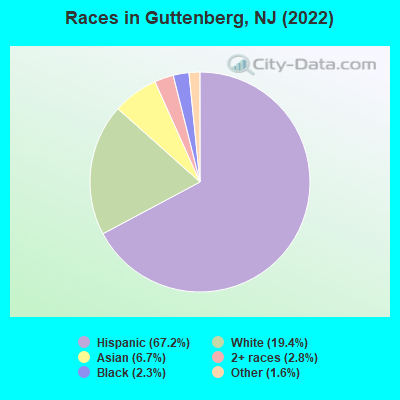
Races in Guttenberg detailed stats: ancestries, foreign born residents, place of birth
According to our research of New Jersey and other state lists, there were 2 registered sex offenders living in Guttenberg, New Jersey as of May 01, 2024.
The ratio of all residents to sex offenders in Guttenberg is 5,896 to 1.
The ratio of registered sex offenders to all residents in this city is much lower than the state average.
Type |
2009 |
2010 |
2011 |
2012 |
2013 |
2014 |
2015 |
2016 |
2017 |
2018 |
2019 |
2020 |
2022 |
|---|---|---|---|---|---|---|---|---|---|---|---|---|---|
| Murders (per 100,000) | 0 (0.0) | 0 (0.0) | 0 (0.0) | 1 (8.8) | 0 (0.0) | 0 (0.0) | 0 (0.0) | 0 (0.0) | 1 (8.5) | 1 (8.6) | 0 (0.0) | 0 (0.0) | 0 (0.0) |
| Rapes (per 100,000) | 0 (0.0) | 0 (0.0) | 0 (0.0) | 0 (0.0) | 0 (0.0) | 1 (8.7) | 2 (17.3) | 1 (8.5) | 4 (34.1) | 5 (43.1) | 0 (0.0) | 0 (0.0) | 7 (63.0) |
| Robberies (per 100,000) | 13 (123.9) | 12 (107.4) | 6 (53.5) | 11 (96.9) | 22 (192.5) | 7 (60.8) | 10 (86.7) | 0 (0.0) | 11 (93.7) | 10 (86.2) | 13 (115.2) | 7 (63.1) | 4 (36.0) |
| Assaults (per 100,000) | 26 (247.8) | 26 (232.6) | 19 (169.4) | 24 (211.4) | 14 (122.5) | 19 (165.1) | 15 (130.1) | 13 (111.1) | 6 (51.1) | 12 (103.4) | 14 (124.0) | 9 (81.1) | 23 (207.1) |
| Burglaries (per 100,000) | 26 (247.8) | 29 (259.5) | 41 (365.6) | 43 (378.7) | 23 (201.2) | 27 (234.6) | 28 (242.8) | 18 (153.8) | 28 (238.6) | 20 (172.4) | 12 (106.3) | 10 (90.1) | 11 (99.0) |
| Thefts (per 100,000) | 67 (638.5) | 62 (554.8) | 62 (552.9) | 78 (686.9) | 83 (726.1) | 67 (582.2) | 82 (710.9) | 62 (529.9) | 75 (639.1) | 74 (637.8) | 53 (469.5) | 61 (549.5) | 50 (450.2) |
| Auto thefts (per 100,000) | 10 (95.3) | 5 (44.7) | 6 (53.5) | 7 (61.6) | 6 (52.5) | 7 (60.8) | 6 (52.0) | 7 (59.8) | 8 (68.2) | 5 (43.1) | 6 (53.1) | 6 (54.1) | 7 (63.0) |
| Arson (per 100,000) | 0 (0.0) | 3 (26.8) | 1 (8.9) | 0 (0.0) | 1 (8.7) | 0 (0.0) | 0 (0.0) | 1 (8.5) | 0 (0.0) | 0 (0.0) | 0 (0.0) | 0 (0.0) | 0 (0.0) |
| City-Data.com crime index | 137.2 | 122.7 | 101.9 | 147.9 | 129.6 | 102.8 | 115.5 | 65.8 | 130.4 | 139.3 | 89.8 | 67.7 | 132.6 |
The City-Data.com crime index weighs serious crimes and violent crimes more heavily. Higher means more crime, U.S. average is 246.1. It adjusts for the number of visitors and daily workers commuting into cities.
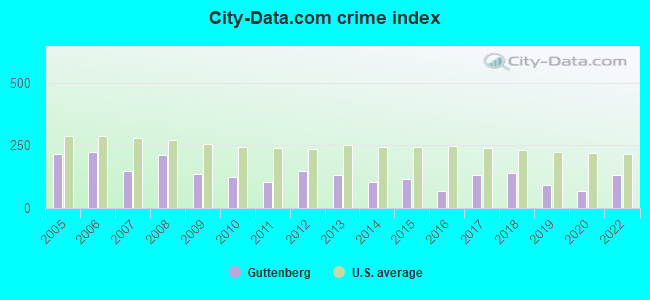
Crime rate in Guttenberg detailed stats: murders, rapes, robberies, assaults, burglaries, thefts, arson
Full-time law enforcement employees in 2021, including police officers: 32 (26 officers - 24 male; 2 female).
| Officers per 1,000 residents here: | 2.27 |
| New Jersey average: | 5.53 |
 Recent articles from our blog. Our writers, many of them Ph.D. graduates or candidates, create easy-to-read articles on a wide variety of topics.

 | Guttenberg, NJ (7 replies) |
| Renting in Jersey City or Guttenberg Surroundings (2 replies) |
| New parents considering moving to West NY/Guttenburg from Manhattan (1 reply) |
| Are there REALLY suburbs near Jersey City? (33 replies) |
| Guttenberg, North Bergen and Cliffside Park (9 replies) |
| Guttenberg, NJ Neighborhood (5 replies) |
Latest news from Guttenberg, NJ collected exclusively by city-data.com from local newspapers, TV, and radio stations
Ancestries: Italian (2.9%), Russian (2.0%), Polish (1.4%), American (1.3%).
Current Local Time: EST time zone
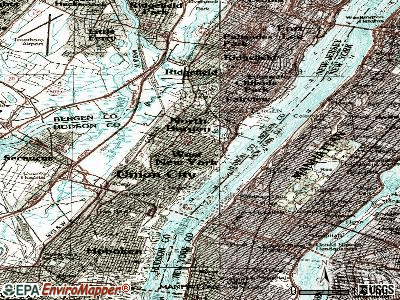
Elevation: 240 feet
Land area: 0.19 square miles.
Population density: 59,324 people per square mile (very high).
6,582 residents are foreign born (41.0% Latin America, 8.2% Asia).
| This town: | 56.6% |
| New Jersey: | 23.2% |
Median real estate property taxes paid for housing units with mortgages in 2022: $7,740 (2.0%)
Median real estate property taxes paid for housing units with no mortgage in 2022: $9,445 (2.4%)
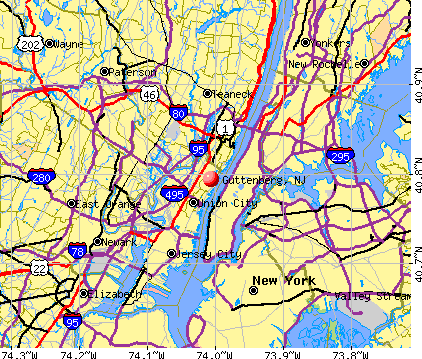
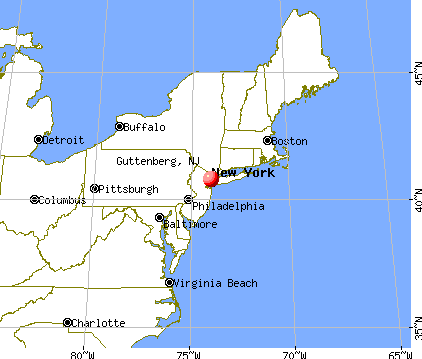
Nearest city with pop. 50,000+: Union City, NJ  (2.2 miles , pop. 67,088).
Nearest city with pop. 200,000+: Manhattan, NY (2.4 miles , pop. 1,537,195).
Nearest cities:
), ), Latitude: 40.79 N, Longitude: 74.01 W
Daytime population change due to commuting: -4,067 (-35.0%)
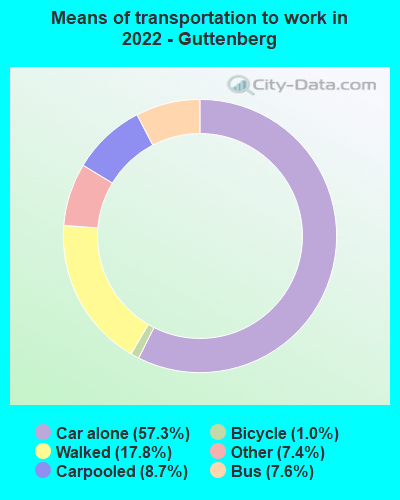
Workers who live and work in this town: 1,081 (17.4%)
Guttenberg, New Jersey accommodation & food services, waste management - Economy and Business Data
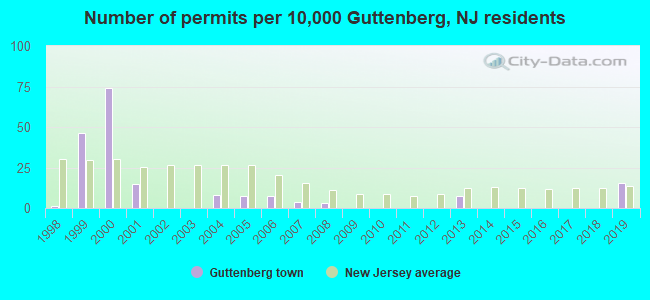
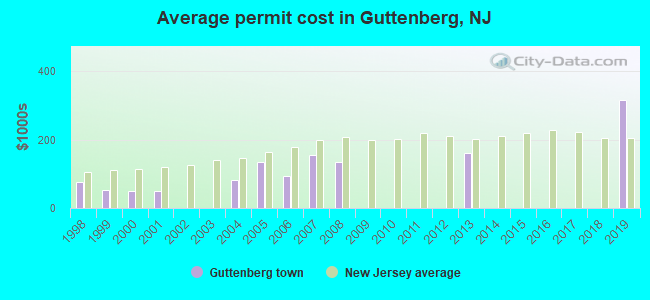
Single-family new house construction building permits:
- 2019: 17 buildings, average cost: $316,100
- 2013: 8 buildings, average cost: $161,900
- 2008: 3 buildings, average cost: $134,300
- 2007: 4 buildings, average cost: $154,200
- 2006: 8 buildings, average cost: $94,500
- 2005: 8 buildings, average cost: $134,900
- 2004: 9 buildings, average cost: $81,800
- 2001: 16 buildings, average cost: $51,300
- 2000: 80 buildings, average cost: $49,900
- 1999: 50 buildings, average cost: $51,900
- 1998: 1 building, cost: $75,000
| Here: | 4.5% |
| New Jersey: | 4.5% |
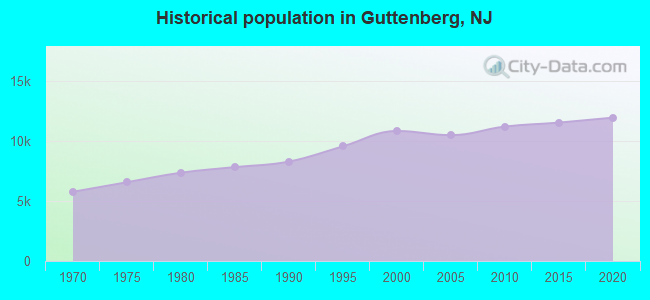
Population change in the 1990s: +2,546 (+30.8%).
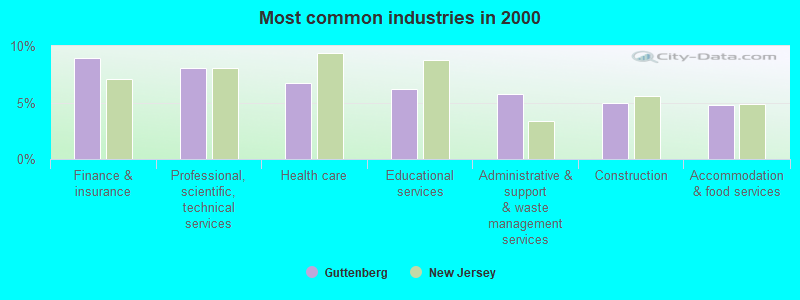
- Finance & insurance (8.9%)
- Professional, scientific, technical services (8.0%)
- Health care (6.7%)
- Educational services (6.2%)
- Administrative & support & waste management services (5.8%)
- Construction (4.9%)
- Accommodation & food services (4.8%)
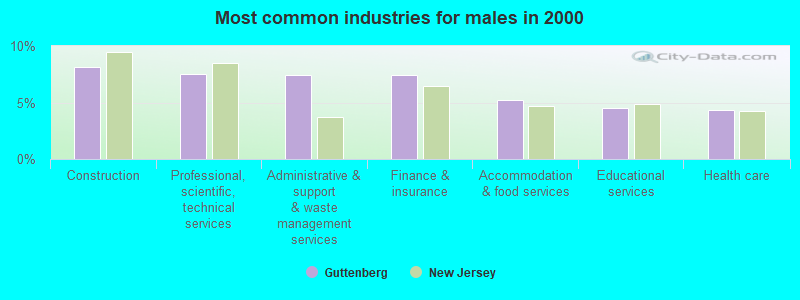
- Construction (8.1%)
- Professional, scientific, technical services (7.5%)
- Administrative & support & waste management services (7.4%)
- Finance & insurance (7.4%)
- Accommodation & food services (5.2%)
- Educational services (4.5%)
- Health care (4.3%)
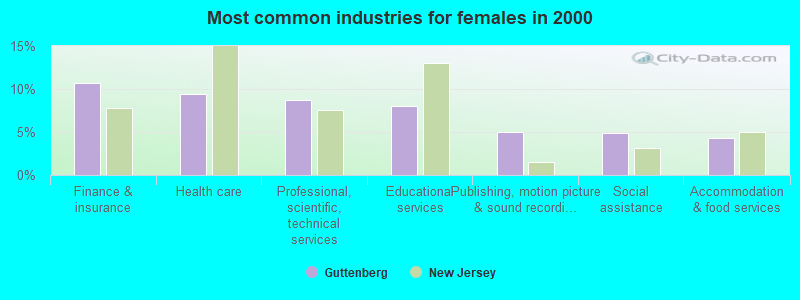
- Finance & insurance (10.7%)
- Health care (9.4%)
- Professional, scientific, technical services (8.7%)
- Educational services (8.1%)
- Publishing, motion picture & sound recording industries (5.0%)
- Social assistance (4.9%)
- Accommodation & food services (4.3%)
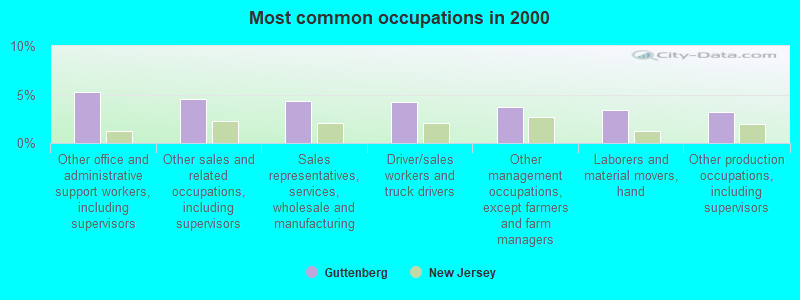
- Other office and administrative support workers, including supervisors (5.3%)
- Other sales and related occupations, including supervisors (4.5%)
- Sales representatives, services, wholesale and manufacturing (4.3%)
- Driver/sales workers and truck drivers (4.3%)
- Other management occupations, except farmers and farm managers (3.7%)
- Laborers and material movers, hand (3.4%)
- Other production occupations, including supervisors (3.2%)
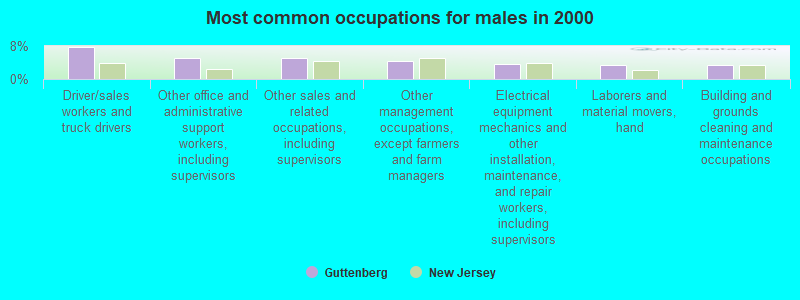
- Driver/sales workers and truck drivers (7.7%)
- Other office and administrative support workers, including supervisors (5.1%)
- Other sales and related occupations, including supervisors (5.0%)
- Other management occupations, except farmers and farm managers (4.3%)
- Electrical equipment mechanics and other installation, maintenance, and repair workers, including supervisors (3.6%)
- Laborers and material movers, hand (3.5%)
- Building and grounds cleaning and maintenance occupations (3.5%)
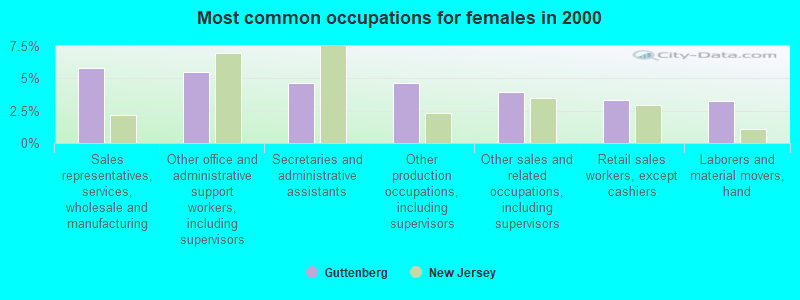
- Sales representatives, services, wholesale and manufacturing (5.8%)
- Other office and administrative support workers, including supervisors (5.5%)
- Secretaries and administrative assistants (4.7%)
- Other production occupations, including supervisors (4.6%)
- Other sales and related occupations, including supervisors (4.0%)
- Retail sales workers, except cashiers (3.4%)
- Laborers and material movers, hand (3.2%)
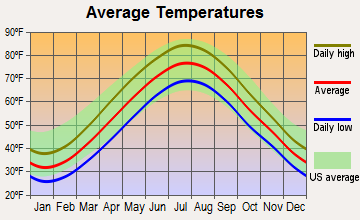
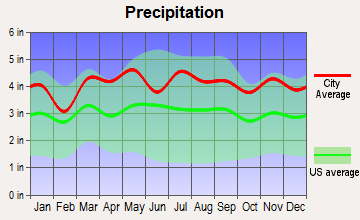
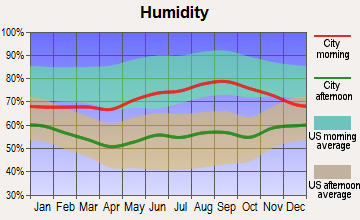
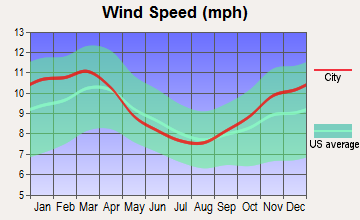
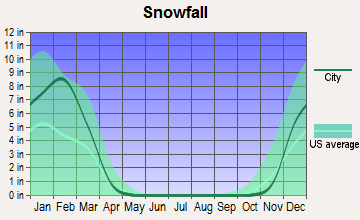
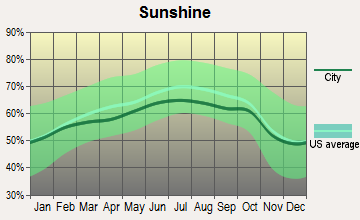
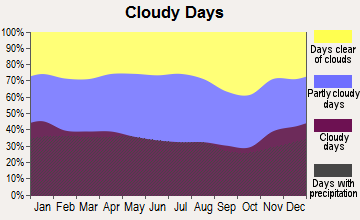
Average climate in Guttenberg, New Jersey
Based on data reported by over 4,000 weather stations
(lower is better)
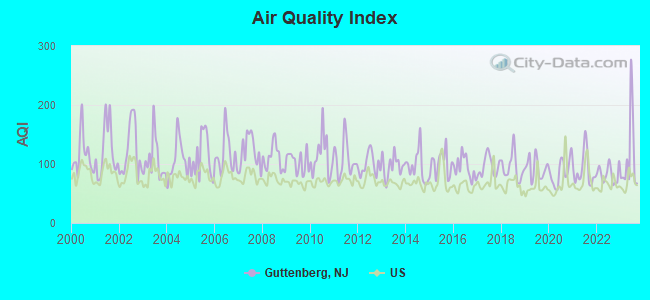
Air Quality Index (AQI) level in 2023 was 111. This is significantly worse than average.
| City: | 111 |
| U.S.: | 73 |
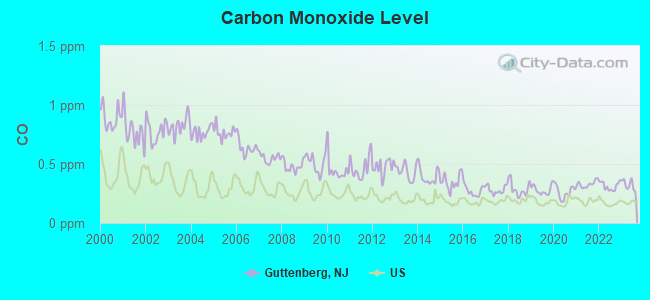
Carbon Monoxide (CO) [ppm] level in 2023 was 0.323. This is worse than average. Closest monitor was 1.3 miles away from the city center.
| City: | 0.323 |
| U.S.: | 0.251 |
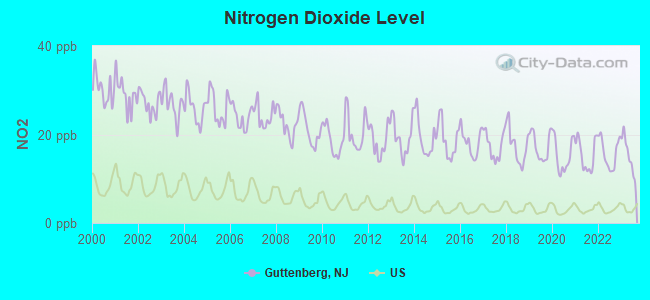
Nitrogen Dioxide (NO2) [ppb] level in 2023 was 15.4. This is significantly worse than average. Closest monitor was 1.3 miles away from the city center.
| City: | 15.4 |
| U.S.: | 5.1 |
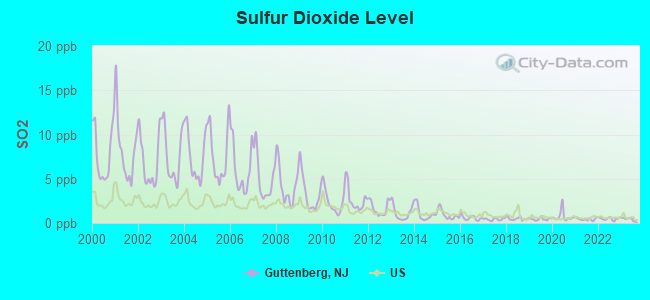
Sulfur Dioxide (SO2) [ppb] level in 2023 was 0.444. This is significantly better than average. Closest monitor was 1.3 miles away from the city center.
| City: | 0.444 |
| U.S.: | 1.515 |
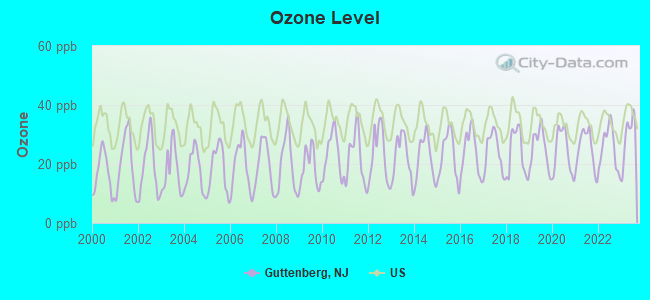
Ozone [ppb] level in 2023 was 29.2. This is about average. Closest monitor was 1.3 miles away from the city center.
| City: | 29.2 |
| U.S.: | 33.3 |
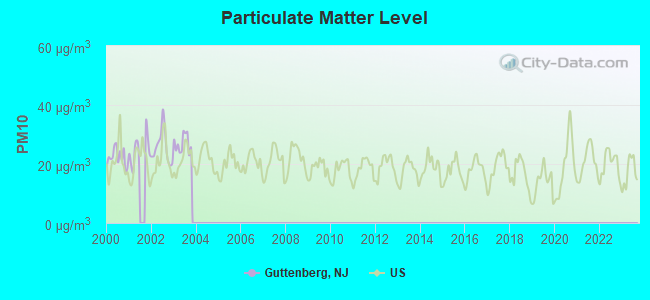
Particulate Matter (PM10) [µg/m3] level in 2003 was 26.9. This is worse than average. Closest monitor was 3.0 miles away from the city center.
| City: | 26.9 |
| U.S.: | 19.2 |
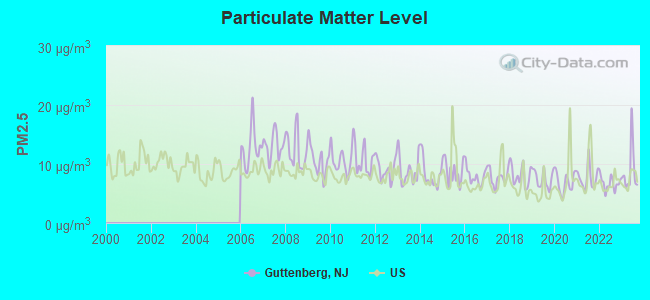
Particulate Matter (PM2.5) [µg/m3] level in 2023 was 8.80. This is about average. Closest monitor was 2.0 miles away from the city center.
| City: | 8.80 |
| U.S.: | 8.11 |
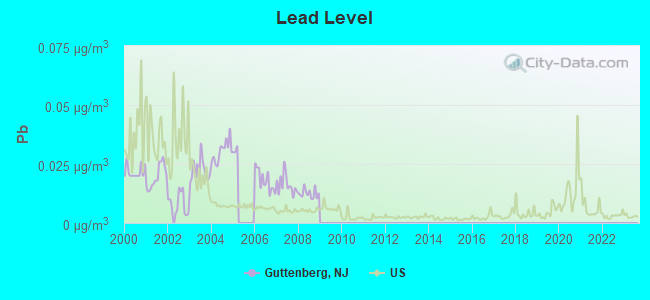
Lead (Pb) [µg/m3] level in 2008 was 0.0125. This is worse than average. Closest monitor was 3.0 miles away from the city center.
| City: | 0.0125 |
| U.S.: | 0.0093 |
Tornado activity:
Guttenberg-area historical tornado activity is slightly below New Jersey state average. It is 40% smaller than the overall U.S. average.
On 5/28/1973, a category F3 (max. wind speeds 158-206 mph) tornado 25.8 miles away from the Guttenberg town center caused between $50,000 and $500,000 in damages.
On 5/28/1973, a category F3 tornado 37.5 miles away from the town center injured 12 people and caused between $50,000 and $500,000 in damages.
Earthquake activity:
Guttenberg-area historical earthquake activity is significantly above New Jersey state average. It is 69% smaller than the overall U.S. average.On 8/23/2011 at 17:51:04, a magnitude 5.8 (5.8 MW, Depth: 3.7 mi, Class: Moderate, Intensity: VI - VII) earthquake occurred 289.7 miles away from the city center
On 10/7/1983 at 10:18:46, a magnitude 5.3 (5.1 MB, 5.3 LG, 5.1 ML) earthquake occurred 219.2 miles away from the city center
On 1/16/1994 at 01:49:16, a magnitude 4.6 (4.6 MB, 4.6 LG, Depth: 3.1 mi, Class: Light, Intensity: IV - V) earthquake occurred 111.4 miles away from the city center
On 4/20/2002 at 10:50:47, a magnitude 5.3 (5.3 ML, Depth: 3.0 mi) earthquake occurred 257.7 miles away from Guttenberg center
On 4/20/2002 at 10:50:47, a magnitude 5.2 (5.2 MB, 4.2 MS, 5.2 MW, 5.0 MW) earthquake occurred 255.9 miles away from the city center
On 1/16/1994 at 00:42:43, a magnitude 4.2 (4.2 MB, 4.0 LG, Depth: 3.1 mi) earthquake occurred 110.0 miles away from the city center
Magnitude types: regional Lg-wave magnitude (LG), body-wave magnitude (MB), local magnitude (ML), surface-wave magnitude (MS), moment magnitude (MW)
Natural disasters:
The number of natural disasters in Hudson County (21) is greater than the US average (15).Major Disasters (Presidential) Declared: 11
Emergencies Declared: 10
Causes of natural disasters: Hurricanes: 6, Floods: 4, Snowstorms: 3, Storms: 3, Blizzards: 2, Heavy Rains: 2, Water Shortages: 2, Winter Storms: 2, Power Outage: 1, Other: 3 (Note: some incidents may be assigned to more than one category).
Hospitals and medical centers in Guttenberg:
Other hospitals and medical centers near Guttenberg:
- PALISADES MEDICAL CENTER Acute Care Hospitals (about 1 miles away; NORTH BERGEN, NJ)
- HARBORAGE (Nursing Home, about 1 miles away; NORTH BERGEN, NJ)
- HUDSON VIEW CARE AND REHAB CTR (Nursing Home, about 1 miles away; NORTH BERGEN, NJ)
- ELMHURST HOSPITAL CENTER Acute Care Hospitals (about 2 miles away; ELMHURST, NY)
- CITY HOSP AT ELMHURST (Nursing Home, about 2 miles away; ELMHURST, NY)
- KATERI RESIDENCE (Nursing Home, about 2 miles away; NEW YORK, NY)
- FMS-BAYSIDE DIALYSIS CENTER (Dialysis Facility, about 2 miles away; BAYSIDE, NY)
Amtrak stations near Guttenberg:
- 4 miles: NEW YORK (PENN STA) (NEW YORK, 7TH AVE. & W. 32ND ST.) . Services: ticket office, fully wheelchair accessible, enclosed waiting area, public restrooms, public payphones, full-service food facilities, snack bar, vending machines, ATM, paid short-term parking, paid long-term parking, call for car rental service, taxi stand, public transit connection.
- 8 miles: LA GUARDIA AIRPORT (QUEENS, ) - Bus Station . Services: enclosed waiting area, public restrooms, public payphones, snack bar and vending machines, ATM, paid short-term parking, paid long-term parking, car rental agency, taxi stand.
- 10 miles: NEWARK (RAYMOND PLAZA WEST) . Services: ticket office, fully wheelchair accessible, enclosed waiting area, public restrooms, public payphones, snack bar, ATM, paid short-term parking, paid long-term parking, call for car rental service, taxi stand, intercity bus service, public transit connection.
Colleges/universities with over 2000 students nearest to Guttenberg:
- CUNY John Jay College of Criminal Justice (about 2 miles; New York, NY; Full-time enrollment: 12,091)
- Barnard College (about 3 miles; New York, NY; FT enrollment: 2,425)
- Columbia University in the City of New York (about 3 miles; New York, NY; FT enrollment: 23,396)
- Teachers College at Columbia University (about 3 miles; New York, NY; FT enrollment: 3,762)
- CUNY Hunter College (about 3 miles; New York, NY; FT enrollment: 18,428)
- Technical Career Institutes (about 4 miles; New York, NY; FT enrollment: 4,338)
- Berkeley College-New York (about 4 miles; New York, NY; FT enrollment: 5,189)
Public elementary/middle school in Guttenberg:
- ANNA L. KLEIN (Students: 937, Location: 301 69TH ST, Grades: PK-8)
Points of interest:
Notable locations in Guttenberg: North Hudson Regional Fire and Rescue Rescue 1 (A), Guttenburg Fire Prevention Office (B). Display/hide their locations on the map
Churches in Guttenberg include: Iglesia Reformada Hispania (A), Saint John Nepomucene's Roman Catholic Church (B), Saints Peter and Paul Lutheran Church (C). Display/hide their locations on the map
| This town: | 2.5 people |
| New Jersey: | 2.7 people |
| This town: | 60.0% |
| Whole state: | 69.3% |
| This town: | 8.4% |
| Whole state: | 5.9% |
Likely homosexual households (counted as self-reported same-sex unmarried-partner households)
- Lesbian couples: 0.4% of all households
- Gay men: 0.8% of all households
People in group quarters in Guttenberg in 2000:
- 104 people in nursing homes
- 8 people in homes for the mentally ill
- 4 people in religious group quarters
Banks with branches in Guttenberg (2011 data):
- GSL Savings Bank: Gsl Savings Bank at 6823 Bergenline Ave, branch established on 1907/01/01. Info updated 2006/12/01: Bank assets: $92.3 mil, Deposits: $76.0 mil, local headquarters, positive income, 2 total offices
- Wells Fargo Bank, National Association: Guttenberg Branch at 6727 Bergenline Avenue, branch established on 1948/08/02. Info updated 2011/04/05: Bank assets: $1,161,490.0 mil, Deposits: $905,653.0 mil, headquarters in Sioux Falls, SD, positive income, 6395 total offices, Holding Company: Wells Fargo & Company
- Freedom Bank: Guttenberg Branch at 6812 Park Avenue, branch established on 2011/11/21. Info updated 2010/10/04: Bank assets: $148.6 mil, Deposits: $128.7 mil, headquarters in Oradell, NJ, positive income, Commercial Lending Specialization, 2 total offices
For population 15 years and over in Guttenberg:
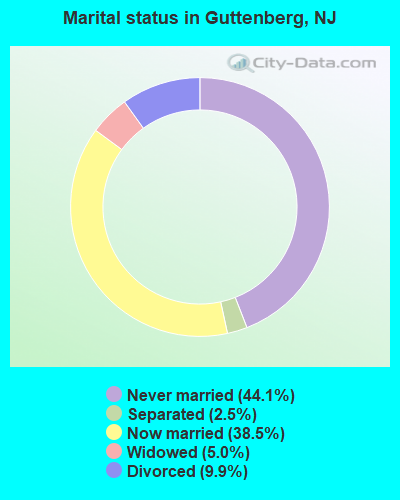
- Never married: 44.1%
- Now married: 38.5%
- Separated: 2.5%
- Widowed: 5.0%
- Divorced: 9.9%
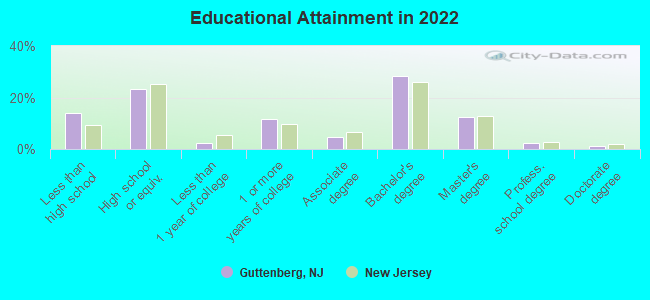
For population 25 years and over in Guttenberg:
- High school or higher: 86.7%
- Bachelor's degree or higher: 42.9%
- Graduate or professional degree: 15.9%
- Unemployed: 6.7%
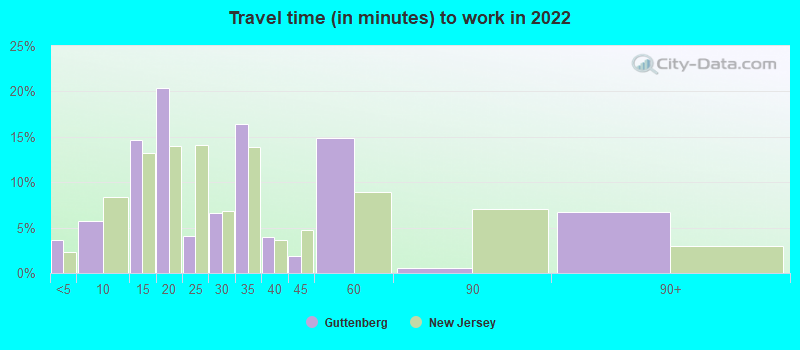
- Mean travel time to work (commute): 31.7 minutes
| Here: | 14.6 |
| New Jersey average: | 12.8 |
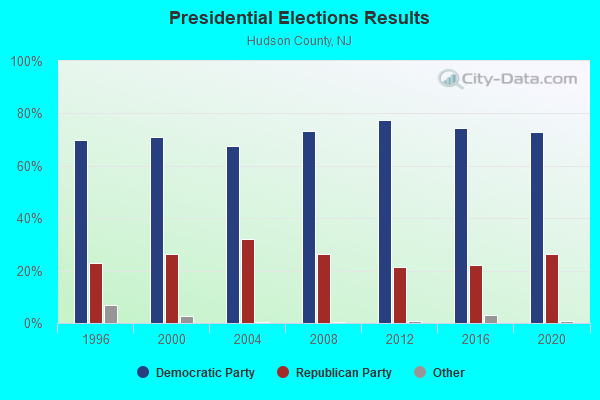
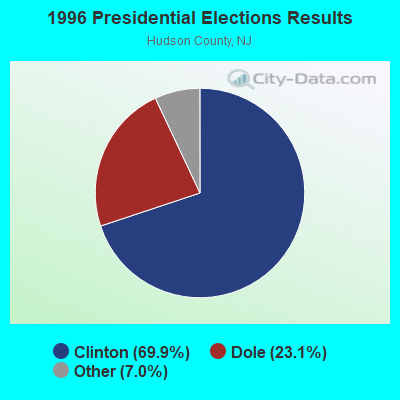
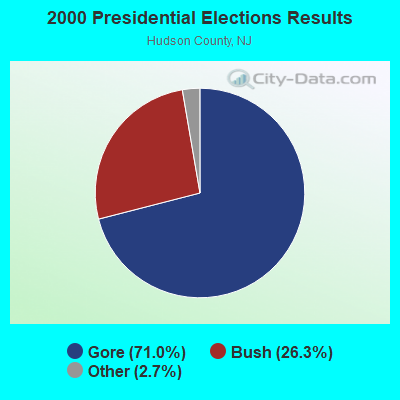
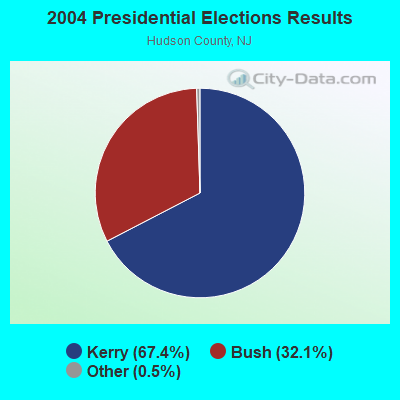
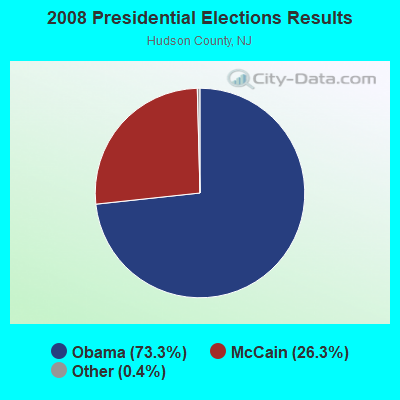
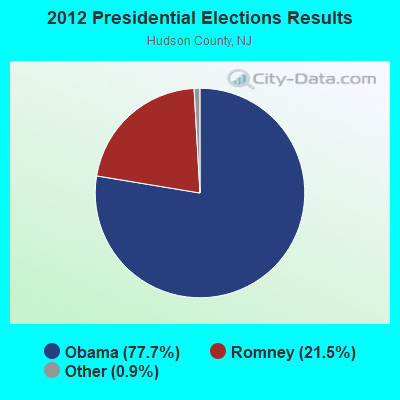
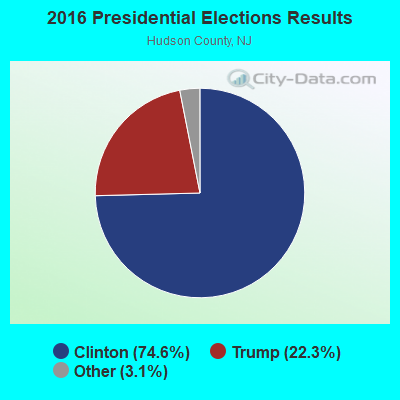
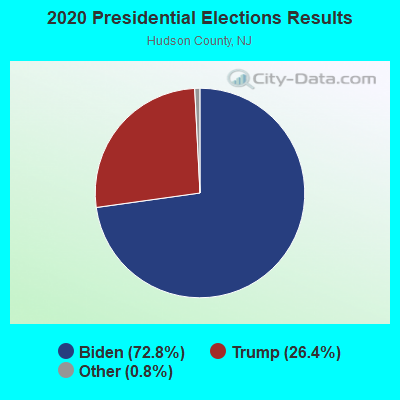
Graphs represent county-level data. Detailed 2008 Election Results
Religion statistics for Guttenberg, NJ (based on Hudson County data)
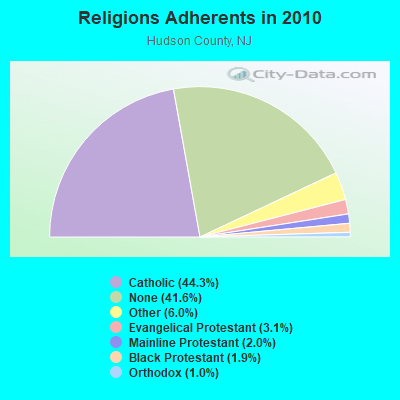
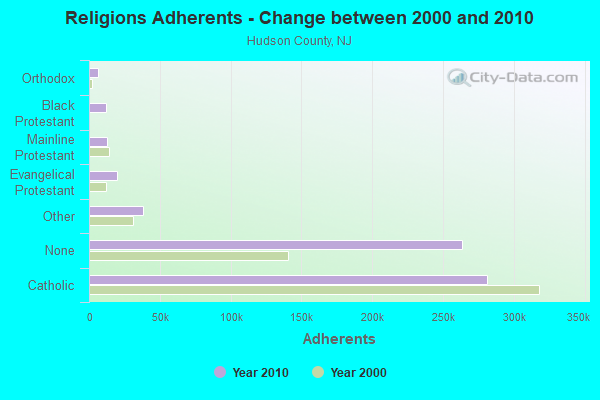
| Religion | Adherents | Congregations |
|---|---|---|
| Catholic | 280,930 | 53 |
| Other | 38,322 | 63 |
| Evangelical Protestant | 19,890 | 133 |
| Mainline Protestant | 12,853 | 93 |
| Black Protestant | 12,308 | 26 |
| Orthodox | 6,318 | 12 |
| None | 263,645 | - |
Food Environment Statistics:
| Hudson County: | 4.34 / 10,000 pop. |
| State: | 2.90 / 10,000 pop. |
| This county: | 0.03 / 10,000 pop. |
| New Jersey: | 0.06 / 10,000 pop. |
| Hudson County: | 2.03 / 10,000 pop. |
| New Jersey: | 1.76 / 10,000 pop. |
| Hudson County: | 0.49 / 10,000 pop. |
| New Jersey: | 0.81 / 10,000 pop. |
| Here: | 6.23 / 10,000 pop. |
| State: | 7.15 / 10,000 pop. |
| This county: | 7.8% |
| New Jersey: | 8.3% |
| Here: | 22.8% |
| New Jersey: | 23.3% |
| This county: | 23.7% |
| State: | 18.0% |
Health and Nutrition:
| Guttenberg: | 49.7% |
| New Jersey: | 50.6% |
| This city: | 49.8% |
| New Jersey: | 48.5% |
| Guttenberg: | 28.1 |
| State: | 28.5 |
| Here: | 20.5% |
| New Jersey: | 20.0% |
| This city: | 10.8% |
| New Jersey: | 11.1% |
| This city: | 6.8 |
| New Jersey: | 6.8 |
| This city: | 32.7% |
| New Jersey: | 33.6% |
| This city: | 56.4% |
| New Jersey: | 56.9% |
| Guttenberg: | 81.7% |
| State: | 80.0% |
More about Health and Nutrition of Guttenberg, NJ Residents
| Local government employment and payroll (March 2022) | |||||
| Function | Full-time employees | Monthly full-time payroll | Average yearly full-time wage | Part-time employees | Monthly part-time payroll |
|---|---|---|---|---|---|
| Police Protection - Officers | 26 | $216,584 | $99,962 | 11 | $18,671 |
| Solid Waste Management | 13 | $52,090 | $48,083 | 1 | $916 |
| Housing and Community Development (Local) | 11 | $55,025 | $60,027 | 5 | $10,954 |
| Police - Other | 11 | $29,812 | $32,522 | 24 | $33,966 |
| Financial Administration | 7 | $40,402 | $69,261 | 3 | $3,384 |
| Other Government Administration | 4 | $30,140 | $90,420 | 7 | $5,664 |
| Welfare | 4 | $12,850 | $38,550 | 2 | $2,106 |
| Other and Unallocable | 3 | $11,578 | $46,312 | 8 | $11,590 |
| Judicial and Legal | 2 | $12,426 | $74,556 | 5 | $11,124 |
| Local Libraries | 1 | $2,626 | $31,512 | 2 | $2,954 |
| Fire - Other | 1 | $3,450 | $41,400 | 4 | $6,038 |
| Parks and Recreation | 1 | $3,562 | $42,744 | 26 | $19,596 |
| Totals for Government | 84 | $470,545 | $67,221 | 98 | $126,962 |
Guttenberg government finances - Expenditure in 2017 (per resident):
- Construction - Housing and Community Development: $335,000 ($29.27)
General - Other: $253,000 ($22.10)
Parks and Recreation: $138,000 ($12.06)
Regular Highways: $96,000 ($8.39)
- Current Operations - Housing and Community Development: $5,054,000 ($441.55)
General - Other: $4,212,000 ($367.99)
Local Fire Protection: $2,977,000 ($260.09)
Police Protection: $2,919,000 ($255.02)
Solid Waste Management: $885,000 ($77.32)
Regular Highways: $773,000 ($67.53)
Central Staff Services: $429,000 ($37.48)
Financial Administration: $419,000 ($36.61)
Judicial and Legal Services: $335,000 ($29.27)
Parks and Recreation: $290,000 ($25.34)
General Public Buildings: $205,000 ($17.91)
Protective Inspection and Regulation - Other: $173,000 ($15.11)
Health - Other: $91,000 ($7.95)
Sewerage: $11,000 ($0.96)
Natural Resources - Other: $4,000 ($0.35)
- General - Interest on Debt: $194,000 ($16.95)
- Intergovernmental to Local - Other - Local Fire Protection: $2,448,000 ($213.87)
Other - Libraries: $155,000 ($13.54)
Other - General - Other: $75,000 ($6.55)
Other - Health - Other: $27,000 ($2.36)
- Total Salaries and Wages: $4,364,000 ($381.27)
Guttenberg government finances - Revenue in 2017 (per resident):
- Charges - Housing and Community Development: $1,496,000 ($130.70)
Parking Facilities: $102,000 ($8.91)
- Federal Intergovernmental - Housing and Community Development: $3,185,000 ($278.26)
Health and Hospitals: $45,000 ($3.93)
Other: $37,000 ($3.23)
- Miscellaneous - Fines and Forfeits: $651,000 ($56.88)
General Revenue - Other: $142,000 ($12.41)
Interest Earnings: $18,000 ($1.57)
- State Intergovernmental - General Local Government Support: $749,000 ($65.44)
Other: $69,000 ($6.03)
Health and Hospitals: $14,000 ($1.22)
- Tax - Property: $15,649,000 ($1367.20)
Other License: $496,000 ($43.33)
Alcoholic Beverage License: $42,000 ($3.67)
Public Utilities Sales: $40,000 ($3.49)
Guttenberg government finances - Debt in 2017 (per resident):
- Long Term Debt - Beginning Outstanding - Unspecified Public Purpose: $3,031,000 ($264.81)
Outstanding Unspecified Public Purpose: $2,962,000 ($258.78)
Retired Unspecified Public Purpose: $69,000 ($6.03)
Guttenberg government finances - Cash and Securities in 2017 (per resident):
- Bond Funds - Cash and Securities: $1,580,000 ($138.04)
- Other Funds - Cash and Securities: $5,353,000 ($467.67)
9.63% of this county's 2021 resident taxpayers lived in other counties in 2020 ($98,061 average adjusted gross income)
| Here: | 9.63% |
| New Jersey average: | 6.70% |
0.01% of residents moved from foreign countries ($36 average AGI)
Hudson County: 0.01% New Jersey average: 0.01%
Top counties from which taxpayers relocated into this county between 2020 and 2021:
| from New York County, NY | |
| from Kings County, NY | |
| from Bergen County, NJ |
11.41% of this county's 2020 resident taxpayers moved to other counties in 2021 ($127,758 average adjusted gross income)
| Here: | 11.41% |
| New Jersey average: | 7.02% |
0.02% of residents moved to foreign countries ($143 average AGI)
Hudson County: 0.02% New Jersey average: 0.02%
Top counties to which taxpayers relocated from this county between 2020 and 2021:
| to Bergen County, NJ | |
| to Essex County, NJ | |
| to Middlesex County, NJ |
| Businesses in Guttenberg, NJ | ||||
| Name | Count | Name | Count | |
|---|---|---|---|---|
| FedEx | 1 | True Value | 1 | |
| Jones New York | 1 | UPS | 1 | |
| Pizza Hut | 1 | |||
Strongest AM radio stations in Guttenberg:
- WBBR (1130 AM; 50 kW; NEW YORK, NY; Owner: BLOOMBERG COMMUNICATIONS INC.)
- WEPN (1050 AM; 50 kW; NEW YORK, NY; Owner: NEW YORK AM RADIO, LLC)
- WOR (710 AM; 50 kW; NEW YORK, NY; Owner: BUCKLEY BROADCASTING CORPORATION)
- WWRL (1600 AM; 25 kW; NEW YORK, NY; Owner: ACCESS.1 COMMUNICATIONS CORP.-NY)
- WMCA (570 AM; 50 kW; NEW YORK, NY; Owner: SALEM MEDIA OF NEW YORK, LLC)
- WADO (1280 AM; 50 kW; NEW YORK, NY; Owner: WADO-AM LICENSE CORP.)
- WINS (1010 AM; 50 kW; NEW YORK, NY; Owner: INFINITY BROADCASTING OPERATIONS, INC.)
- WABC (770 AM; 50 kW; NEW YORK, NY; Owner: WABC-AM RADIO, INC.)
- WLIB (1190 AM; 30 kW; NEW YORK, NY; Owner: ICBC BROADCAST HOLDINGS-NY, INC.)
- WQEW (1560 AM; 50 kW; NEW YORK, NY; Owner: THE NEW YORK TIMES ELECTRONIC MEDIA COMPANY)
- WFAN (660 AM; 50 kW; NEW YORK, NY; Owner: INFINITY BROADCASTING OPERATIONS, INC.)
- WWRU (1660 AM; 10 kW; JERSEY CITY, NJ; Owner: RADIO UNICA OF NEW YORK LICENSE CORP.)
- WCBS (880 AM; 50 kW; NEW YORK, NY; Owner: INFINITY BROADCASTING OPERATIONS, INC.)
Strongest FM radio stations in Guttenberg:
- WKTU (103.5 FM; LAKE SUCCESS, NY; Owner: AMFM RADIO LICENSES, LLC)
- WKCR-FM (89.9 FM; NEW YORK, NY; Owner: TRUSTEES OF COLUMBIA UNIVERSITY IN NEW YORK)
- WCBS-FM (101.1 FM; NEW YORK, NY; Owner: INFINITY BROADCASTING OPERATIONS, INC.)
- WAXQ (104.3 FM; NEW YORK, NY; Owner: AMFM NEW YORK LICENSES, LLC)
- WHTZ (100.3 FM; NEWARK, NJ; Owner: AMFM RADIO LICENSES, L.L.C.)
- WWPR-FM (105.1 FM; NEW YORK, NY; Owner: AMFM RADIO LICENSES, L.L.C.)
- WQCD (101.9 FM; NEW YORK, NY; Owner: EMMIS RADIO LICENSE CORPORATION)
- WCAA (105.9 FM; NEWARK, NJ; Owner: WADO-AM LICENSE CORP. ("WADO"))
- WBAI (99.5 FM; NEW YORK, NY; Owner: PACIFICA FOUNDATION, INC.)
- WBLS (107.5 FM; NEW YORK, NY; Owner: ICBC BROADCAST HOLDINGS-NY, INC.)
- WLTW (106.7 FM; NEW YORK, NY; Owner: AMFM NEW YORK LICENSES, LLC)
- WQXR-FM (96.3 FM; NEW YORK, NY; Owner: THE NEW YORK TIMES ELECTRONIC MEDIA COMPANY)
- WSKQ-FM (97.9 FM; NEW YORK, NY; Owner: WSKQ LICENSING, INC.)
- WXRK (92.3 FM; NEW YORK, NY; Owner: INFINITY BROADCASTING OPERATIONS, INC.)
- WQHT (97.1 FM; NEW YORK, NY; Owner: EMMIS LICENSE CORPORATION OF NEW YORK)
- WNEW (102.7 FM; NEW YORK, NY; Owner: INFINITY BROADCASTING OPERATIONS, INC.)
- WNYC-FM (93.9 FM; NEW YORK, NY; Owner: WNYC RADIO)
- WPAT-FM (93.1 FM; PATERSON, NJ; Owner: WPAT LICENSING, INC.)
- W276AQ (103.1 FM; FORT LEE, NJ; Owner: GERARD A. TURRO)
- WHCR-FM (90.3 FM; NEW YORK, NY; Owner: CITY COLLEGE OF NEW YORK)
TV broadcast stations around Guttenberg:
- WNYW (Channel 5; NEW YORK, NY; Owner: FOX TELEVISION STATIONS, INC.)
- WNJU (Channel 47; LINDEN, NJ; Owner: WNJU LICENSE CORPORATION)
- WFUT (Channel 68; NEWARK, NJ; Owner: UNIVISION NEW YORK LLC)
- WNYE-TV (Channel 25; NEW YORK, NY; Owner: NEW YORK CITY BOARD OF EDUCATION)
- WKOB-LP (Channel 53; NEW YORK, NY; Owner: WKOB COMMUNICATIONS, INC.)
- WEBR-CA (Channel 17; MANHATTAN, NY; Owner: K LICENSEE INC.)
- WRNN-LP (Channel 57; NYACK, NY; Owner: LP NYACK LIMITED PARTNERSHIP)
- WCBS-TV (Channel 2; NEW YORK, NY; Owner: CBS BROADCASTING INC.)
- WABC-TV (Channel 7; NEW YORK, NY; Owner: AMERICAN BROADCASTING COMPANIES, INC)
- WPIX (Channel 11; NEW YORK, NY; Owner: WPIX, INC.)
- WWOR-TV (Channel 9; SECAUCUS, NJ; Owner: FOX TELEVISION STATIONS, INC.)
- WXNY-LP (Channel 32; NEW YORK, NY; Owner: ISLAND BROADCASTING COMPANY)
- WNXY-LP (Channel 26; NEW YORK, NY; Owner: ISLAND BROADCASTING COMPANY)
- WPXN-TV (Channel 31; NEW YORK, NY; Owner: PAXSON COMMUNICATIONS LICENSE COMPANY, LLC)
- WNBC (Channel 4; NEW YORK, NY; Owner: NATIONAL BROADCASTING COMPANY, INC.)
- WNET (Channel 13; NEWARK, NJ; Owner: EDUCATIONAL BROADCASTING CORPORATION)
- WXTV (Channel 41; PATERSON, NJ; Owner: WXTV LICENSE PARTNERSHIP, G.P.)
- W60AI (Channel 60; NEW YORK, NY; Owner: VENTANA TELEVISION, INC.)
- W33BS (Channel 33; DARIEN, CT; Owner: CT&T BROADCASTING, INC.)
- WNYN-LP (Channel 39; NEW YORK, NY; Owner: ISLAND BROADCASTING COMPANY)
- WNYX-LP (Channel 35; NEW YORK, NY; Owner: ISLAND BROADCASTING COMPANY)
- WPXO-LP (Channel 34; EAST ORANGE, NJ; Owner: PAXSON COMMUNICATIONS LPTV, INC.)
- W68DN (Channel 68; CHERRY HILL, ETC., NJ; Owner: MARCIA COHEN)
- W38CL (Channel 38; BRONX, NY; Owner: RENARD COMMUNICATIONS CORP.)
- WFME-TV (Channel 66; WEST MILFORD, NJ; Owner: FAMILY STATIONS, INC.)
- National Bridge Inventory (NBI) Statistics
- 3Number of bridges
- 46ft / 13.6mTotal length
- 39,990Total average daily traffic
- 1,568Total average daily truck traffic
- 47,988Total future (year 2041) average daily traffic
FCC Registered Broadcast Land Mobile Towers:
1- Lat: 40.793611 Lon: -74.008056, Call Sign: WRCK742,
Assigned Frequencies: 456.337 MHz, 457.712 MHz, 457.862 MHz, Grant Date: 10/26/2018, Expiration Date: 10/26/2028, Certifier: Steve Henry, Registrant: Town Communications, Ardmore, PA 19003, Phone: (610) 649-2859, Fax: (610) 896-5724, Email:
FCC Registered Microwave Towers:
2- NJ-NNJ5280A, 6803 Boulevard East (Lat: 40.790167 Lon: -74.001917), Type: Bant, Structure height: 24.4 m, Overall height: 27.4 m, Call Sign: WQMN916,
Assigned Frequencies: 21875.0 MHz, 22075.0 MHz, 23475.0 MHz, 23575.0 MHz, Grant Date: 10/07/2010, Expiration Date: 10/07/2020, Cancellation Date: 09/08/2020, Certifier: Nadja S Sodos-Wallace, Registrant: Sprint Corporation, 12502 Sunrise Valley Drive, M/S: Varesa0209, Reston, VA 20196, Phone: (800) 572-8256, Fax: (703) 433-4483, Email:
- GALAXY, 7002 Kennedy Blvd E (Lat: 40.790194 Lon: -74.000917), Type: Building, Structure height: 93.6 m, Overall height: 95.1 m, Call Sign: WQNK687,
Assigned Frequencies: 10915.0 MHz, Grant Date: 02/05/2021, Expiration Date: 03/07/2031, Certifier: Gerry Dezenzo, Registrant: Hudson County Prosecutors Office, 595 Newark Avenue Floor 6, Jersey City, NJ 07306, Phone: (201) 795-6400, Fax: (201) 369-5223, Email:
FCC Registered Paging Towers:
2- 7000 Boulevard East (Lat: 40.790278 Lon: -74.000833), Type: Building, Structure height: 158.5 m, Overall height: 160 m, Call Sign: KNKM819, Licensee ID: L01422065,
Assigned Frequencies: 931.862 MHz, Grant Date: 08/12/2008, Expiration Date: 07/01/2018, Cancellation Date: 01/28/2014, Certifier: Shawn E Endsley, Registrant: Usa Mobility Wireless, Inc., 3000 Technology Dr. #400, Plano, TX 75074, Phone: (972) 801-0000, Fax: (972) 801-1699, Email:
- 7000 Boulevard East (Lat: 40.790278 Lon: -74.000833), Type: Building, Structure height: 158.5 m, Overall height: 160 m, Call Sign: KNLW541,
Assigned Frequencies: 931.687 MHz, 931.287 MHz, Expiration Date: 12/12/2007, Cancellation Date: 02/23/2008, Certifier: Paul H Kuzia, Registrant: Venable, LLP, 575 7th Street, Nw, Washington, DC 20004, Phone: (202) 344-4000, Fax: (202) 344-8300, Email:
FCC Registered Amateur Radio Licenses:
6- Call Sign: KB2STF, Licensee ID: L00945276, Grant Date: 11/14/2014, Expiration Date: 12/13/2024, Certifier: Brian E Connell, Registrant: Brian E Connell, 7008 Broadway, #504, Guttenberg, NJ 07093
- Call Sign: N2MJR, Previous Call Sign: KB2LCM, Licensee ID: L00333836, Grant Date: 03/08/2001, Expiration Date: 05/07/2011, Cancellation Date: 05/08/2013, Registrant: Moshe Moskowitz, 7004 Blvd E Apt 14d, Guttenberg, NJ 07093
- Call Sign: KD2FGD, Licensee ID: L01812034, Grant Date: 09/14/2023, Expiration Date: 12/11/2033, Certifier: Joseph N Travelli, Registrant: Joseph N Travelli, 6825 Madison Street, Guttenberg, NJ 07093
- Call Sign: KD2MXV, Licensee ID: L02081928, Grant Date: 02/22/2017, Expiration Date: 02/22/2027, Certifier: Andrew Hsu, Registrant: Andrew Hsu, 109 69th St, Guttenberg, NJ 07093
- Call Sign: KD2RME, Licensee ID: L02247165, Grant Date: 02/28/2019, Expiration Date: 02/28/2029, Certifier: Kevin K Wu, Registrant: Kevin K Wu, 69 69th St 1-R, Guttenberg, NJ 07093
- Call Sign: KD2YCO, Licensee ID: L02492314, Grant Date: 10/12/2021, Expiration Date: 10/12/2031, Certifier: Walter Popiel, Registrant: Walter Popiel, 7000 Blvd E Apt 28f, Guttenberg, NJ 07093
FAA Registered Aircraft:
1- Aircraft: GULFSTREAM AMERICAN CORP AA-5A (Category: Land, Seats: 4, Weight: Up to 12,499 Pounds), Engine: LYCOMING 0-320 SERIES (180 HP) (Reciprocating)
N-Number: 26985, N26985, N-26985, Serial Number: AA5A0861, Year manufactured: 1979, Airworthiness Date: 05/08/1979, Certificate Issue Date: 08/04/2020
Registrant (Individual): Jeffrey S Hahn, 407 69th St Apt 1, Guttenberg, NJ 07093
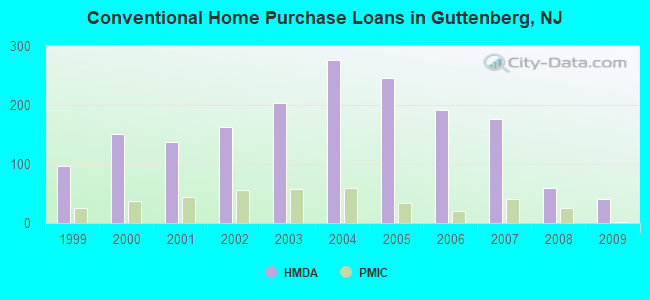
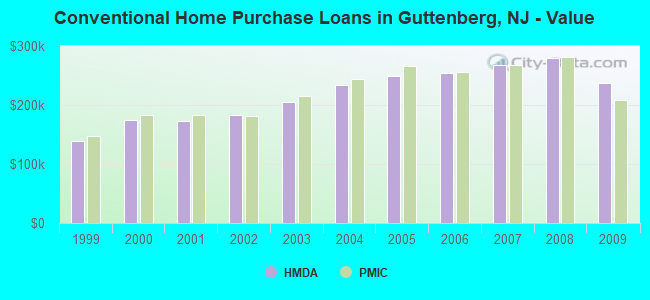
| Home Mortgage Disclosure Act Aggregated Statistics For Year 2009 (Based on 2 full tracts) | ||||||||||||
| A) FHA, FSA/RHS & VA Home Purchase Loans | B) Conventional Home Purchase Loans | C) Refinancings | D) Home Improvement Loans | E) Loans on Dwellings For 5+ Families | F) Non-occupant Loans on < 5 Family Dwellings (A B C & D) | |||||||
|---|---|---|---|---|---|---|---|---|---|---|---|---|
| Number | Average Value | Number | Average Value | Number | Average Value | Number | Average Value | Number | Average Value | Number | Average Value | |
| LOANS ORIGINATED | 7 | $350,143 | 40 | $237,150 | 103 | $256,563 | 1 | $149,000 | 2 | $305,500 | 14 | $202,571 |
| APPLICATIONS APPROVED, NOT ACCEPTED | 1 | $557,000 | 7 | $229,429 | 12 | $307,333 | 0 | $0 | 0 | $0 | 1 | $160,000 |
| APPLICATIONS DENIED | 5 | $329,600 | 18 | $247,444 | 126 | $276,444 | 4 | $62,500 | 1 | $350,000 | 20 | $274,950 |
| APPLICATIONS WITHDRAWN | 5 | $473,200 | 9 | $255,444 | 37 | $302,973 | 1 | $55,000 | 1 | $2,000,000 | 5 | $276,800 |
| FILES CLOSED FOR INCOMPLETENESS | 1 | $368,000 | 1 | $360,000 | 19 | $252,053 | 0 | $0 | 0 | $0 | 3 | $238,667 |
Detailed HMDA statistics for the following Tracts: 0150.00 , 0151.00
| Private Mortgage Insurance Companies Aggregated Statistics For Year 2009 (Based on 1 full tract) | ||||
| A) Conventional Home Purchase Loans | B) Refinancings | |||
|---|---|---|---|---|
| Number | Average Value | Number | Average Value | |
| LOANS ORIGINATED | 2 | $208,000 | 0 | $0 |
| APPLICATIONS APPROVED, NOT ACCEPTED | 0 | $0 | 0 | $0 |
| APPLICATIONS DENIED | 5 | $354,400 | 0 | $0 |
| APPLICATIONS WITHDRAWN | 2 | $364,000 | 1 | $360,000 |
| FILES CLOSED FOR INCOMPLETENESS | 2 | $348,500 | 0 | $0 |
Detailed PMIC statistics for the following Tracts: 0150.00 , 0151.00
2004 - 2018 National Fire Incident Reporting System (NFIRS) incidents
- Fire incident types reported to NFIRS in Guttenberg, NJ
- 37082.4%Structure Fires
- 5712.7%Outside Fires
- 153.3%Mobile Property/Vehicle Fires
- 71.6%Other
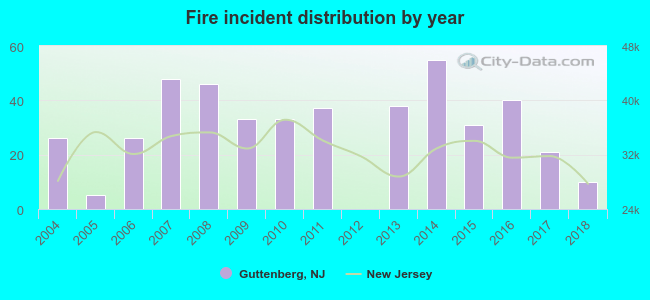 Based on the data from the years 2004 - 2018 the average number of fire incidents per year is 30. The highest number of fires - 55 took place in 2014, and the least - 0 in 2012. The data has a decreasing trend.
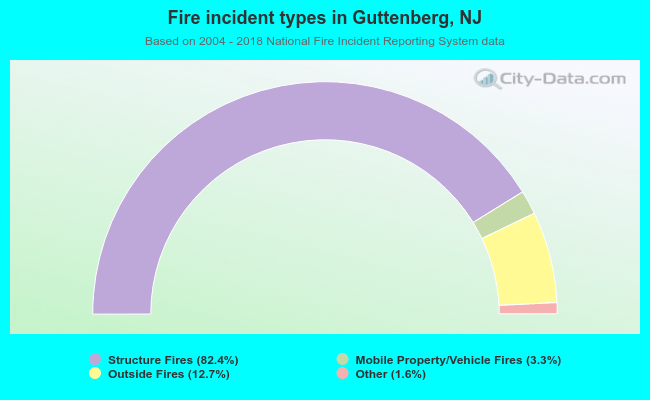 When looking into fire subcategories, the most incidents belonged to: Structure Fires (82.4%), and Outside Fires (12.7%).
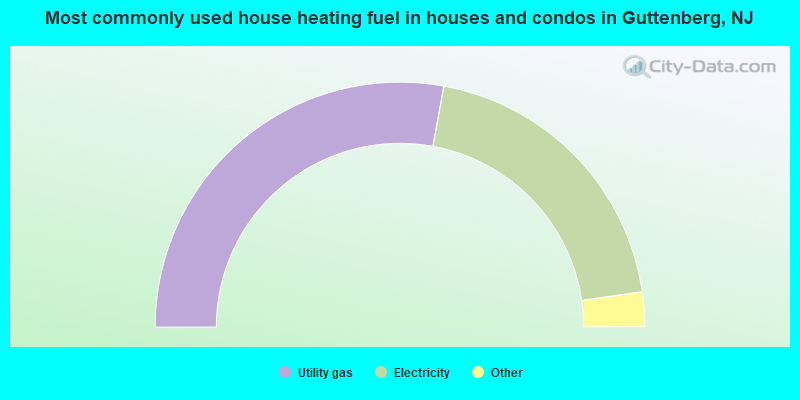
- 55.8%Utility gas
- 39.7%Electricity
- 3.1%Fuel oil, kerosene, etc.
- 1.4%Bottled, tank, or LP gas
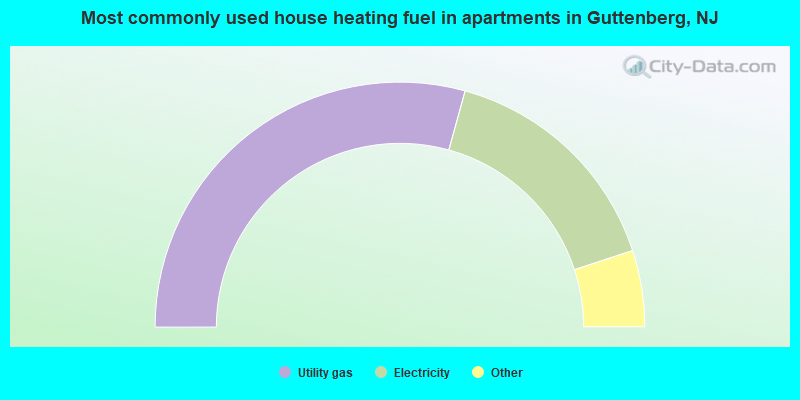
- 58.6%Utility gas
- 31.3%Electricity
- 3.7%Bottled, tank, or LP gas
- 3.5%No fuel used
- 2.4%Fuel oil, kerosene, etc.
- 0.5%Other fuel
Guttenberg compared to New Jersey state average:
- Unemployed percentage below state average.
- Black race population percentage significantly below state average.
- Hispanic race population percentage significantly above state average.
- Median age below state average.
- Foreign-born population percentage significantly above state average.
- Renting percentage above state average.
- Length of stay since moving in significantly above state average.
- Number of rooms per house significantly below state average.
Guttenberg on our top lists:
- #3 on the list of "Top 101 cities with the highest housing density (population 2,000+)"
- #9 on the list of "Top 101 cities with the least people driving a car to work alone (population 5,000+)"
- #11 on the list of "Top 101 cities with the most residents born in Colombia (population 500+)"
- #16 on the list of "Top 101 cities with the most people walking to work (population 5,000+)"
- #20 on the list of "Top 101 cities with the most residents born in Other Northern Europe (population 500+)"
- #27 on the list of "Top 101 cities with the smallest percentage of one, detached housing units in structures (2,000+ housing units)"
- #32 on the list of "Top 101 cities with the most residents born in Dominican Republic (population 500+)"
- #34 on the list of "Top 100 cities with highest percentage of foreign-born residents"
- #36 on the list of "Top 101 cities with the most people taking a ferryboat to work (population 5,000+)"
- #37 on the list of "Top 101 cities with the most residents born in South America (population 500+)"
- #45 on the list of "Top 100 cities with smallest houses (pop. 5,000+)"
- #51 on the list of "Top 101 cities with the most residents born in Cuba (population 500+)"
- #61 on the list of "Top 101 cities with the least cars per house, population 5,000+"
- #63 on the list of "Top 101 cities with the most residents born in Ecuador (population 500+)"
- #71 on the list of "Top 101 cities with the most residents born in Turkey (population 500+)"
- #73 on the list of "Top 101 cities with the most residents born in Spain (population 500+)"
- #74 on the list of "Top 101 cities with the largest percentage of divorced people (15+ years)(population 5,000+)"
- #77 on the list of "Top 101 cities with the most residents born in Caribbean (population 500+)"
- #78 on the list of "Top 101 cities with the most residents born in Americas (population 500+)"
- #79 on the list of "Top 101 cities with the most residents born in Latin America (population 500+)"
- #6 on the list of "Top 101 counties with the lowest percentage of residents that keep firearms around their homes"
- #6 on the list of "Top 101 counties with the largest increase in the number of births per 1000 residents 2000-2006 to 2007-2013 (pop 50,000+)"
- #7 on the list of "Top 101 counties with the largest decrease in the number of deaths per 1000 residents 2000-2006 to 2007-2013 (pop. 50,000+)"
- #8 on the list of "Top 101 counties with the highest Nitrogen Dioxide air pollution readings in 2012 (ppm)"
- #18 on the list of "Top 101 counties with the lowest percentage of residents that exercised in the past month"

|
|
Total of 42 patent applications in 2008-2024.