Races in Guttenberg, New Jersey (NJ) Detailed Stats
Data:
Races - White alone (%)
Races - White alone (% change since 2000)
Races - Black alone (%)
Races - Black alone (% change since 2000)
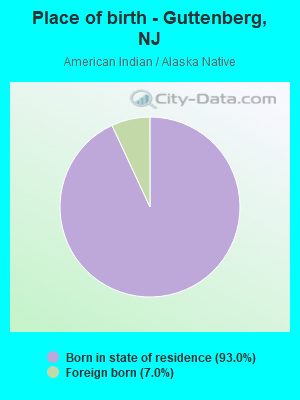
Races - American Indian alone (%)
Races - American Indian alone (% change since 2000)
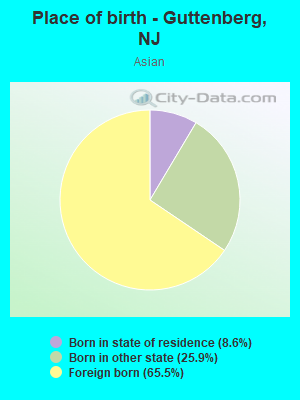
Races - Asian alone (%)
Races - Asian alone (% change since 2000)
Races - Hispanic (%)
Races - Hispanic (% change since 2000)
Races - Native Hawaiian and Other Pacific Islander alone (%)
Races - Native Hawaiian and Other Pacific Islander alone (% change since 2000)
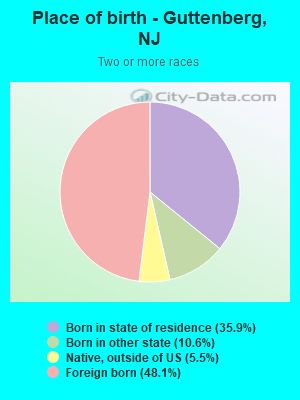
Races - Two or more races(%)
Races - Two or more races(% change since 2000)
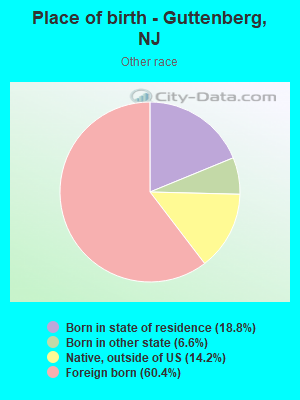
Races - Other race alone (%)
Races - Other race alone (% change since 2000)
Racial diversity
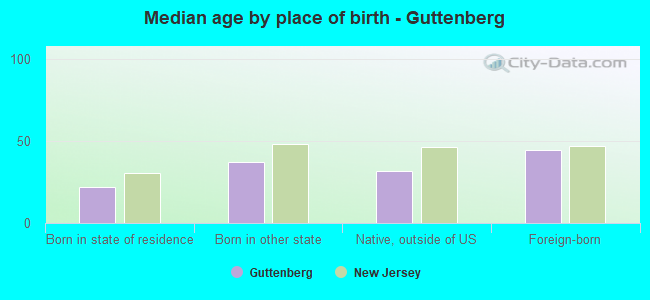
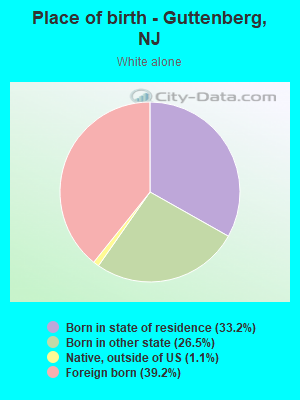
Place of birth - Born in state of residence (%)
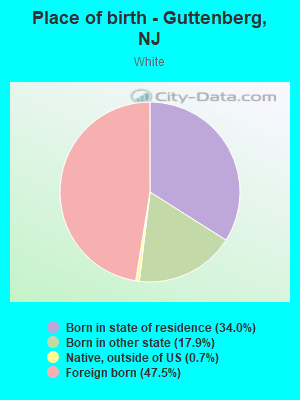
Place of birth - Born in state of residence (%) - White
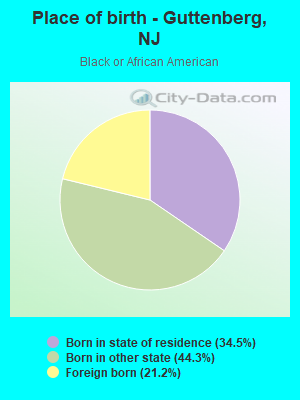
Place of birth - Born in state of residence (%) - Black or African American
Place of birth - Born in state of residence (%) - Asian
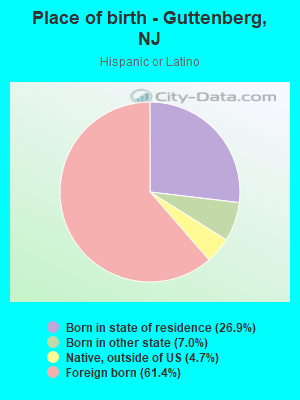
Place of birth - Born in state of residence (%) - Hispanic or Latino
Place of birth - Born in state of residence (%) - American Indian and Alaska Native
Place of birth - Born in state of residence (%) - Multirace
Place of birth - Born in state of residence (%) - Other Race
Place of birth - Born in other state (%)
Place of birth - Born in other state (%) - White
Place of birth - Born in other state (%) - Black or African American
Place of birth - Born in other state (%) - Asian
Place of birth - Born in other state (%) - Hispanic or Latino
Place of birth - Born in other state (%) - American Indian and Alaska Native
Place of birth - Born in other state (%) - Multirace
Place of birth - Born in other state (%) - Other Race
Place of birth - Native, outside of US (%)
Place of birth - Native, outside of US (%) - White
Place of birth - Native, outside of US (%) - Black or African American
Place of birth - Native, outside of US (%) - Asian
Place of birth - Native, outside of US (%) - Hispanic or Latino
Place of birth - Native, outside of US (%) - American Indian and Alaska Native
Place of birth - Native, outside of US (%) - Multirace
Place of birth - Native, outside of US (%) - Other Race
Place of birth - Foreign born (%)
Place of birth - Foreign born (%) - White
Place of birth - Foreign born (%) - Black or African American
Place of birth - Foreign born (%) - Asian
Place of birth - Foreign born (%) - Hispanic or Latino
Place of birth - Foreign born (%) - American Indian and Alaska Native
Place of birth - Foreign born (%) - Multirace
Place of birth - Foreign born (%) - Other Race
Residents speaking English at home (%)
Residents speaking English at home - Born in the United States (%)
Residents speaking English at home - Native, born elsewhere (%)
Residents speaking English at home - Foreign born (%)
Residents speaking Spanish at home (%)
Residents speaking Spanish at home - Born in the United States (%)
Residents speaking Spanish at home - Native, born elsewhere (%)
Residents speaking Spanish at home - Foreign born (%)
Residents speaking other language at home (%)
Residents speaking other language at home - Born in the United States (%)
Residents speaking other language at home - Native, born elsewhere (%)
Residents speaking other language at home - Foreign born (%)
Marital status - Never married (%)
Marital status - Now married (%)
Marital status - Separated (%)
Marital status - Widowed (%)
Marital status - Divorced (%)
Ancestries Reported - Arab (%)
Ancestries Reported - Czech (%)
Ancestries Reported - Danish (%)
Ancestries Reported - Dutch (%)
Ancestries Reported - English (%)
Ancestries Reported - French (%)
Ancestries Reported - French Canadian (%)
Ancestries Reported - German (%)
Ancestries Reported - Greek (%)
Ancestries Reported - Hungarian (%)
Ancestries Reported - Irish (%)
Ancestries Reported - Italian (%)
Ancestries Reported - Lithuanian (%)
Ancestries Reported - Norwegian (%)
Ancestries Reported - Polish (%)
Ancestries Reported - Portuguese (%)
Ancestries Reported - Russian (%)
Ancestries Reported - Scotch-Irish (%)
Ancestries Reported - Scottish (%)
Ancestries Reported - Slovak (%)
Ancestries Reported - Subsaharan African (%)
Ancestries Reported - Swedish (%)
Ancestries Reported - Swiss (%)
Ancestries Reported - Ukrainian (%)
Ancestries Reported - United States (%)
Ancestries Reported - Welsh (%)
Ancestries Reported - West Indian (%)
Ancestries Reported - Other (%)
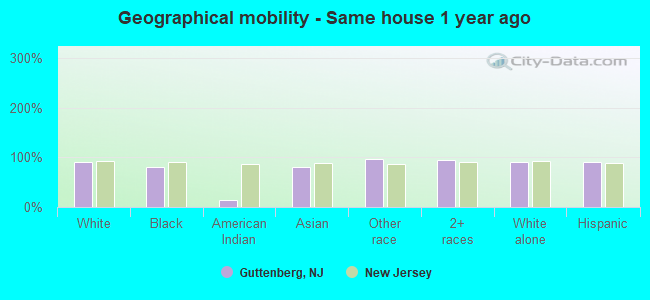
Geographical mobility - Same house 1 year ago (%)
Geographical mobility - Same house 1 year ago (%) - White
Geographical mobility - Same house 1 year ago (%) - Black or African American
Geographical mobility - Same house 1 year ago (%) - Asian
Geographical mobility - Same house 1 year ago (%) - Hispanic or Latino
Geographical mobility - Same house 1 year ago (%) - American Indian and Alaska Native
Geographical mobility - Same house 1 year ago (%) - Multirace
Geographical mobility - Same house 1 year ago (%) - Other Race
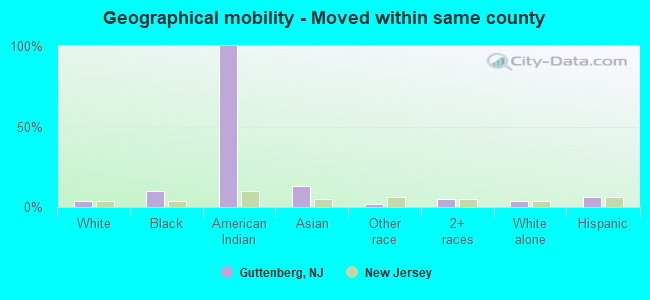
Geographical mobility - Moved within same county (%)
Geographical mobility - Moved within same county (%) - White
Geographical mobility - Moved within same county (%) - Black or African American
Geographical mobility - Moved within same county (%) - Asian
Geographical mobility - Moved within same county (%) - Hispanic or Latino
Geographical mobility - Moved within same county (%) - American Indian and Alaska Native
Geographical mobility - Moved within same county (%) - Multirace
Geographical mobility - Moved within same county (%) - Other Race
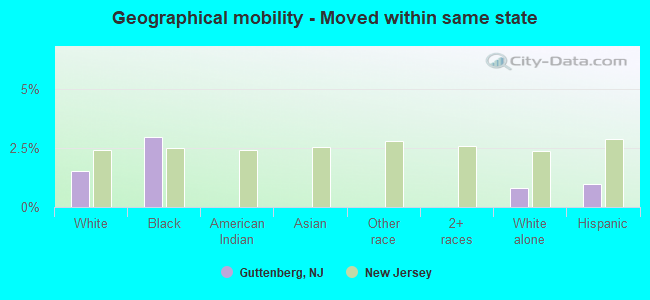
Geographical mobility - Moved from different county within same state (%)
Geographical mobility - Moved from different county within same state (%) - White
Geographical mobility - Moved from different county within same state (%) - Black or African American
Geographical mobility - Moved from different county within same state (%) - Asian
Geographical mobility - Moved from different county within same state (%) - Hispanic or Latino
Geographical mobility - Moved from different county within same state (%) - American Indian and Alaska Native
Geographical mobility - Moved from different county within same state (%) - Multirace
Geographical mobility - Moved from different county within same state (%) - Other Race
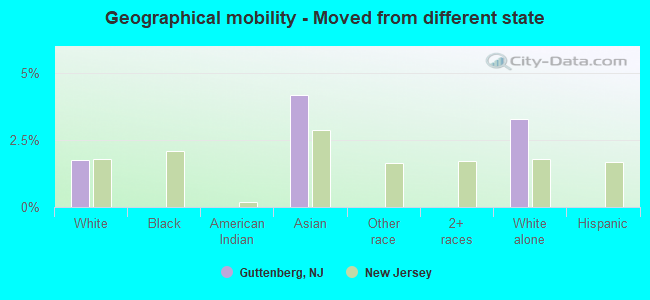
Geographical mobility - Moved from different state (%)
Geographical mobility - Moved from different state (%) - White
Geographical mobility - Moved from different state (%) - Black or African American
Geographical mobility - Moved from different state (%) - Asian
Geographical mobility - Moved from different state (%) - Hispanic or Latino
Geographical mobility - Moved from different state (%) - American Indian and Alaska Native
Geographical mobility - Moved from different state (%) - Multirace
Geographical mobility - Moved from different state (%) - Other Race
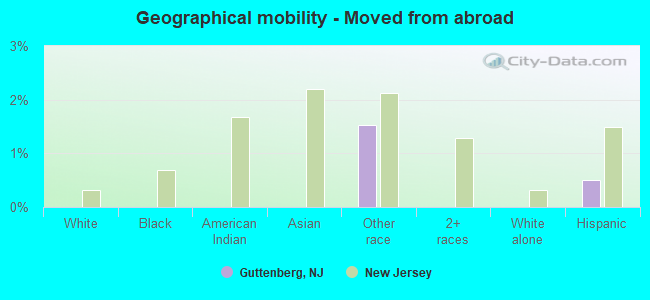
Geographical mobility - Moved from abroad (%)
Geographical mobility - Moved from abroad (%) - White
Geographical mobility - Moved from abroad (%) - Black or African American
Geographical mobility - Moved from abroad (%) - Asian
Geographical mobility - Moved from abroad (%) - Hispanic or Latino
Geographical mobility - Moved from abroad (%) - American Indian and Alaska Native
Geographical mobility - Moved from abroad (%) - Multirace
Geographical mobility - Moved from abroad (%) - Other Race
Place of birth for the foreign-born population - Ireland (%)
Place of birth for the foreign-born population - Denmark (%)
Place of birth for the foreign-born population - Norway (%)
Place of birth for the foreign-born population - Sweden (%)
Place of birth for the foreign-born population - United Kingdom (%)
Place of birth for the foreign-born population - England (%)
Place of birth for the foreign-born population - Scotland (%)
Place of birth for the foreign-born population - Other Northern Europe (%)
Place of birth for the foreign-born population - Austria (%)
Place of birth for the foreign-born population - Belgium (%)
Place of birth for the foreign-born population - France (%)
Place of birth for the foreign-born population - Germany (%)
Place of birth for the foreign-born population - Netherlands (%)
Place of birth for the foreign-born population - Switzerland (%)
Place of birth for the foreign-born population - Other Western Europe (%)
Place of birth for the foreign-born population - Greece (%)
Place of birth for the foreign-born population - Italy (%)
Place of birth for the foreign-born population - Portugal (%)
Place of birth for the foreign-born population - Spain (%)
Place of birth for the foreign-born population - Other Southern Europe (%)
Place of birth for the foreign-born population - Albania (%)
Place of birth for the foreign-born population - Belarus (%)
Place of birth for the foreign-born population - Bosnia and Herzegovina (%)
Place of birth for the foreign-born population - Bulgaria (%)
Place of birth for the foreign-born population - Croatia (%)
Place of birth for the foreign-born population - Czechoslovakia (%)
Place of birth for the foreign-born population - Hungary (%)
Place of birth for the foreign-born population - Latvia (%)
Place of birth for the foreign-born population - Lithuania (%)
Place of birth for the foreign-born population - North Macedonia (Macedonia) (%)
Place of birth for the foreign-born population - Moldova (%)
Place of birth for the foreign-born population - Poland (%)
Place of birth for the foreign-born population - Romania (%)
Place of birth for the foreign-born population - Russia (%)
Place of birth for the foreign-born population - Serbia (%)
Place of birth for the foreign-born population - Ukraine (%)
Place of birth for the foreign-born population - Other Eastern Europe (%)
Place of birth for the foreign-born population - China (%)
Place of birth for the foreign-born population - Hong Kong (%)
Place of birth for the foreign-born population - Taiwan (%)
Place of birth for the foreign-born population - Japan (%)
Place of birth for the foreign-born population - Korea (%)
Place of birth for the foreign-born population - Other Eastern Asia (%)
Place of birth for the foreign-born population - Afghanistan (%)
Place of birth for the foreign-born population - Bangladesh (%)
Place of birth for the foreign-born population - India (%)
Place of birth for the foreign-born population - Iran (%)
Place of birth for the foreign-born population - Kazakhstan (%)
Place of birth for the foreign-born population - Nepal (%)
Place of birth for the foreign-born population - Pakistan (%)
Place of birth for the foreign-born population - Sri Lanka (%)
Place of birth for the foreign-born population - Uzbekistan (%)
Place of birth for the foreign-born population - Other South Central Asia (%)
Place of birth for the foreign-born population - Burma (%)
Place of birth for the foreign-born population - Cambodia (%)
Place of birth for the foreign-born population - Indonesia (%)
Place of birth for the foreign-born population - Laos (%)
Place of birth for the foreign-born population - Malaysia (%)
Place of birth for the foreign-born population - Philippines (%)
Place of birth for the foreign-born population - Singapore (%)
Place of birth for the foreign-born population - Thailand (%)
Place of birth for the foreign-born population - Vietnam (%)
Place of birth for the foreign-born population - Other South Eastern Asia (%)
Place of birth for the foreign-born population - Armenia (%)
Place of birth for the foreign-born population - Iraq (%)
Place of birth for the foreign-born population - Israel (%)
Place of birth for the foreign-born population - Jordan (%)
Place of birth for the foreign-born population - Kuwait (%)
Place of birth for the foreign-born population - Lebanon (%)
Place of birth for the foreign-born population - Saudi Arabia (%)
Place of birth for the foreign-born population - Syria (%)
Place of birth for the foreign-born population - Turkey (%)
Place of birth for the foreign-born population - Yemen (%)
Place of birth for the foreign-born population - Other Western Asia (%)
Place of birth for the foreign-born population - Eritrea (%)
Place of birth for the foreign-born population - Ethiopia (%)
Place of birth for the foreign-born population - Kenya (%)
Place of birth for the foreign-born population - Somalia (%)
Place of birth for the foreign-born population - Uganda (%)
Place of birth for the foreign-born population - Zimbabwe (%)
Place of birth for the foreign-born population - Other Eastern Africa (%)
Place of birth for the foreign-born population - Cameroon (%)
Place of birth for the foreign-born population - Congo (%)
Place of birth for the foreign-born population - Democratic Republic of Congo (Zaire) (%)
Place of birth for the foreign-born population - Other Middle Africa (%)
Place of birth for the foreign-born population - Egypt (%)
Place of birth for the foreign-born population - Morocco (%)
Place of birth for the foreign-born population - Sudan (%)
Place of birth for the foreign-born population - Other Northern Africa (%)
Place of birth for the foreign-born population - South Africa (%)
Place of birth for the foreign-born population - Other Southern Africa (%)
Place of birth for the foreign-born population - Cabo Verde (%)
Place of birth for the foreign-born population - Ghana (%)
Place of birth for the foreign-born population - Liberia (%)
Place of birth for the foreign-born population - Nigeria (%)
Place of birth for the foreign-born population - Senegal (%)
Place of birth for the foreign-born population - Sierra Leone (%)
Place of birth for the foreign-born population - Other Western Africa (%)
Place of birth for the foreign-born population - Australia (%)
Place of birth for the foreign-born population - New Zealand (%)
Place of birth for the foreign-born population - Fiji (%)
Place of birth for the foreign-born population - Micronesia (%)
Place of birth for the foreign-born population - Bahamas (%)
Place of birth for the foreign-born population - Barbados (%)
Place of birth for the foreign-born population - Cuba (%)
Place of birth for the foreign-born population - Dominica (%)
Place of birth for the foreign-born population - Dominican Republic (%)
Place of birth for the foreign-born population - Grenada (%)
Place of birth for the foreign-born population - Haiti (%)
Place of birth for the foreign-born population - Jamaica (%)
Place of birth for the foreign-born population - St. Vincent and the Grenadines (%)
Place of birth for the foreign-born population - Trinidad and Tobago (%)
Place of birth for the foreign-born population - West Indies (%)
Place of birth for the foreign-born population - Other Caribbean (%)
Place of birth for the foreign-born population - Belize (%)
Place of birth for the foreign-born population - Costa Rica (%)
Place of birth for the foreign-born population - El Salvador (%)
Place of birth for the foreign-born population - Guatemala (%)
Place of birth for the foreign-born population - Honduras (%)
Place of birth for the foreign-born population - Mexico (%)
Place of birth for the foreign-born population - Nicaragua (%)
Place of birth for the foreign-born population - Panama (%)
Place of birth for the foreign-born population - Other Central America (%)
Place of birth for the foreign-born population - Argentina (%)
Place of birth for the foreign-born population - Bolivia (%)
Place of birth for the foreign-born population - Brazil (%)
Place of birth for the foreign-born population - Chile (%)
Place of birth for the foreign-born population - Colombia (%)
Place of birth for the foreign-born population - Ecuador (%)
Place of birth for the foreign-born population - Guyana (%)
Place of birth for the foreign-born population - Peru (%)
Place of birth for the foreign-born population - Uruguay (%)
Place of birth for the foreign-born population - Venezuela (%)
Place of birth for the foreign-born population - Other South America (%)
Place of birth for the foreign-born population - Canada (%)
Place of birth for the foreign-born population - Other Northern America (%)
Place of birth for the foreign-born population - Other (%)
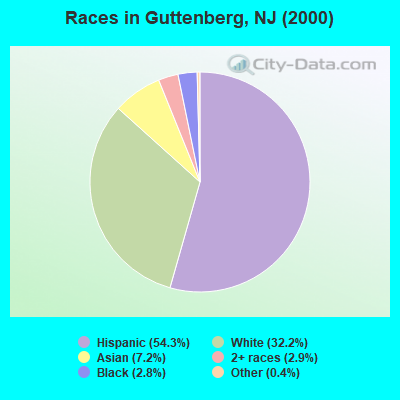
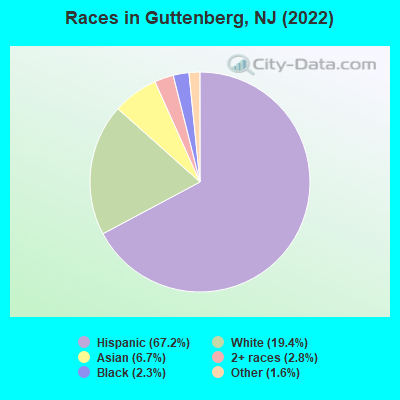
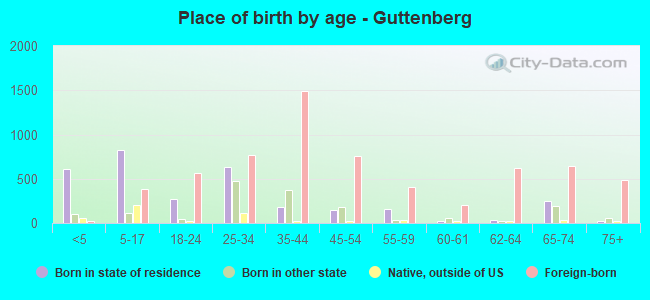
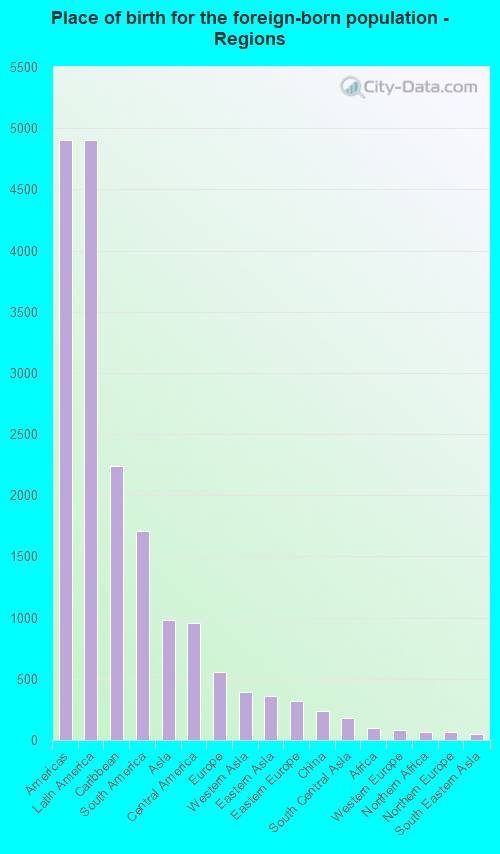
According to 2022 data, the most numerous races in Guttenberg, NJ are White alone (2,259 residents), Hispanic (7,806 residents), and Black alone (267 residents). 24.9% of Guttenberg residents speak English at home. 56.6% of Guttenberg, NJ residents are foreign-born (41.0% born in Latin America, 8.2% born in Asia), which is 59.4% greater than the foreign-born rate of 23.0% across the entire state of New Jersey.
Race distribution in Guttenberg
2000 2022
5,557,209 66.0% White alone 1,117,191 13.3% Hispanic 1,096,171 13.0% Black alone 477,012 5.7% Asian alone 133,689 1.6% Two or more races 19,565 0.2% Other race alone 11,338 0.1% American Indian alone 2,175 0.03% Native Hawaiian and Other
4,766,476 51.5% White alone 2,028,470 21.9% Hispanic 1,111,632 12.0% Black alone 923,546 10.0% Asian alone 332,237 3.6% Two or more races 89,847 1.0% Other race alone 8,557 0.09% American Indian alone 934 0.01% Native Hawaiian and Other
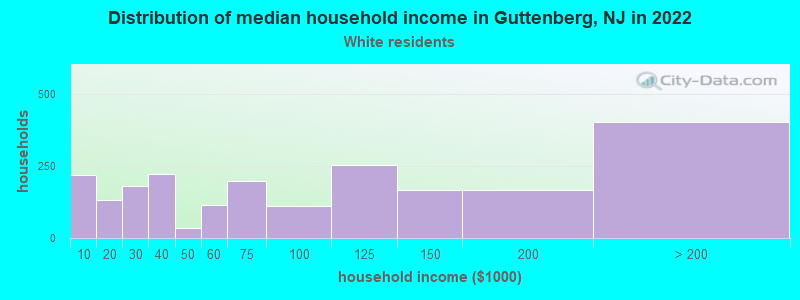
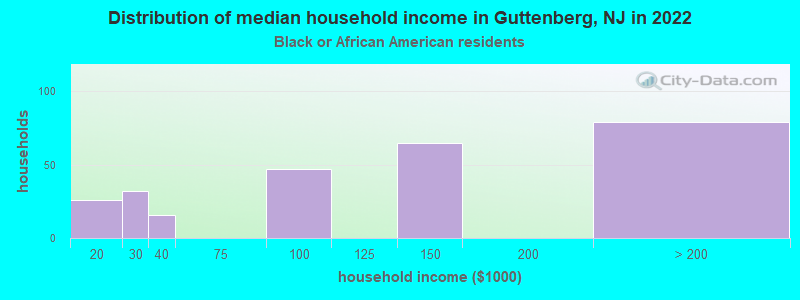
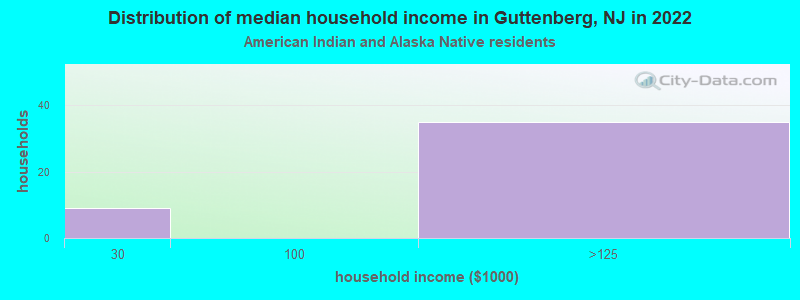
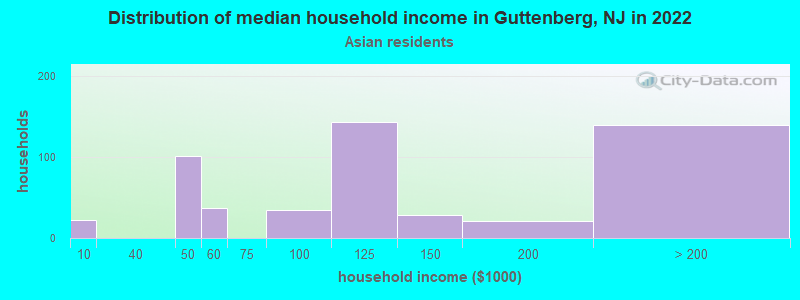
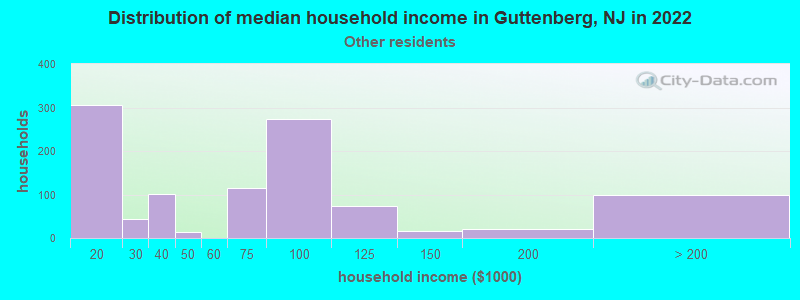
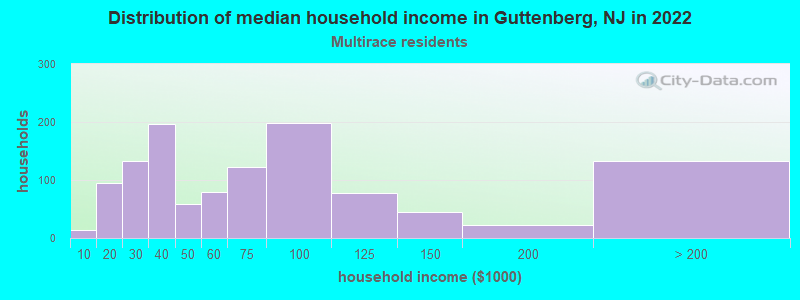
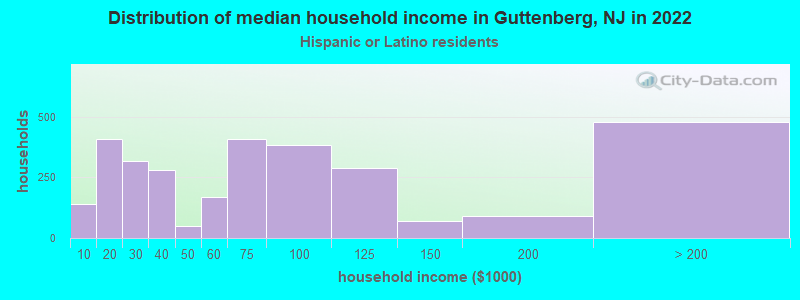
Income and house value in Guttenberg Median household income in 2022 $89,391 White non-Hispanic householders$149,608 Black householders$114,123 Asian householders$69,262 Some other race householders$59,657 Two or more races householders$69,815 Hispanic or Latino race householdersMedian 2022 house value $318,594 White Non-Hispanic householders$444,137 Black or African American householders$532,965 Some other race householders$278,800 Two or more races householders$378,049 Hispanic or Latino householders
Median age by race in Guttenberg
38.0 Median age for White residents36.7 42.0 40.7 Median age for Black or African American residents39.9 41.7 -705,128,204.4 Median age for American Indian / Alaska Native residents-666,666,666.0 -678,632,478.0 37.2 Median age for Asian residents35.2 54.2 -804,177,544.9 Median age for Native Hawaiian / Pacific Islander residents-860,335,194.7 -713,070,378.3 29.7 Median age for Other race residents32.6 28.6 39.3 Median age for Two or more races residents34.7 45.1 50.3 Median age for White alone residents44.0 55.3 35.4 Median age for Hispanic or Latino residents31.6 39.9
Owner/renter occupied households by race in Guttenberg
House owners and renters - White residents 889 40.7% Owner occupied1,295 59.3% Renter occupiedHouse owners and renters - Black or African American residents 198 69.8% Owner occupied85 30.2% Renter occupiedHouse owners and renters - American Indian / Alaska Native residents 53 100.0% Renter occupiedHouse owners and renters - Asian residents 322 64.8% Owner occupied175 35.2% Renter occupiedHouse owners and renters - Other race residents 272 26.0% Owner occupied775 74.0% Renter occupiedHouse owners and renters - Two or more races residents 512 42.4% Owner occupied694 57.6% Renter occupiedHouse owners and renters - White alone residents 687 53.9% Owner occupied588 46.1% Renter occupiedHouse owners and renters - Hispanic or Latino residents 945 30.5% Owner occupied2,159 69.5% Renter occupied
Language usage in Guttenberg
English speakers - Total 24.9% of residents of Guttenberg speak English at home.
61.6% of residents speak Spanish at home 3,338 49.9% Speak English very well3,355 50.1% Speak English less than very well11.7% of residents speak other language at home 1,000 78.9% Speak English very well267 21.1% Speak English less than very well
English speakers - Born in the United States 57.9% of residents of Guttenberg speak English at home.
27.6% of residents speak Spanish at home 406 95.3% Speak English very well20 4.7% Speak English less than very well12.3% of residents speak other language at home 190 100.0% Speak English very well
English speakers - Native, born elsewhere 26.5% of residents of Guttenberg speak English at home.
48.3% of residents speak Spanish at home 187 87.0% Speak English very well28 13.0% Speak English less than very well22.0% of residents speak other language at home 98 100.0% Speak English very well
English speakers - Foreign-born 7.7% of residents of Guttenberg speak English at home.
75.8% of residents speak Spanish at home 1,554 32.9% Speak English very well3,172 67.1% Speak English less than very well15.9% of residents speak other language at home 720 72.4% Speak English very well274 27.6% Speak English less than very well
White (Caucasian) - Speak only English Native:
62.1% (1,106)Foreign-born:
13.3% (252)
White (Caucasian) - Speak another language Native:
29.8% (530)Foreign-born:
82.9% (1,566)
Black or African American - Speak only English Native:
87.2% (343)Foreign-born:
14.0% (15)
Black or African American - Speak another language Native:
10.2% (40)Foreign-born:
75.9% (83)
American Indian / Alaska Native - Speak another language Native:
95.2% (150)Foreign-born:
100.0% (12)
Asian - Speak only English Native:
83.1% (216)Foreign-born:
24.6% (142)
Asian - Speak another language Native:
24.0% (62)Foreign-born:
76.0% (440)
Other race - Speak another language Native:
81.5% (951)Foreign-born:
98.9% (1,925)
Two or more races - Speak only English Native:
35.2% (344)Foreign-born:
4.6% (56)
Two or more races - Speak another language Native:
59.6% (582)Foreign-born:
94.6% (1,149)
White alone - Speak only English Native:
85.6% (1,094)Foreign-born:
28.7% (249)
White alone - Speak another language Native:
14.3% (183)Foreign-born:
72.1% (626)
Hispanic or Latino - Speak only English Native:
22.5% (542)Foreign-born:
2.5% (117)
Hispanic or Latino - Speak another language Native:
75.2% (1,812)Foreign-born:
96.6% (4,595)
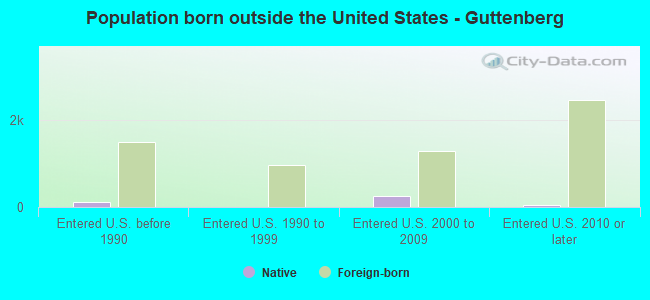
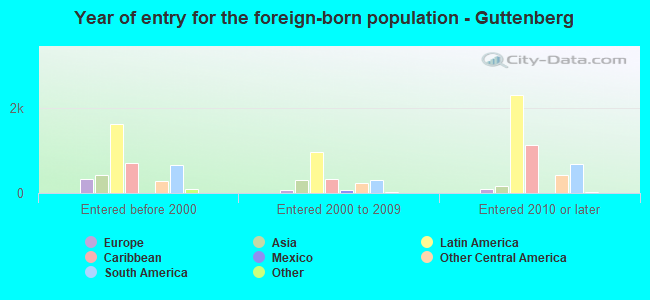
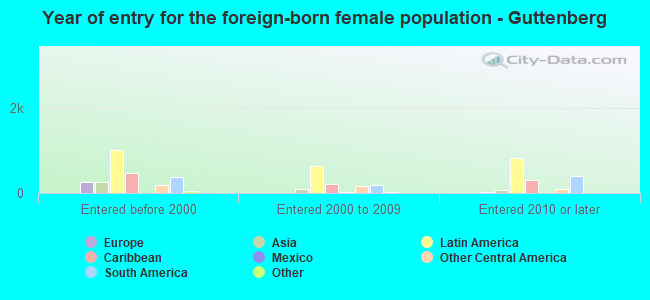
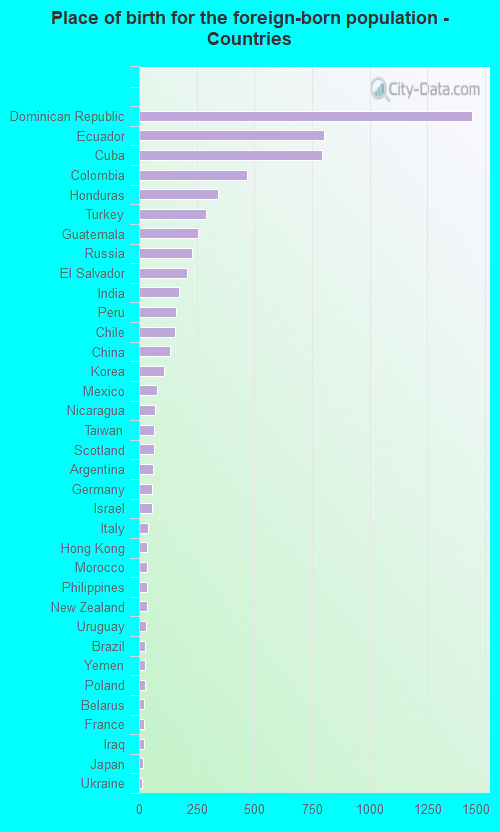
Foreign-born residents in Guttenberg 6,582 residents are foreign born (41.0% Latin America , 8.2% Asia ).
This city:
56.6%New Jersey:
23.2%
Marital status for residents in Guttenberg Marital status - White (Caucasian) population 15 years and over
Males 48.3% Never married47.1% Now married0.0% Separated1.2% Widowed3.5% DivorcedFemales 35.9% Never married34.9% Now married1.9% Separated11.6% Widowed15.8% DivorcedWomen who gave birth in the past 12 months Now married:
24.7% (15)Unmarried:
75.3% (45)
Women who did not give birth in the past 12 months Now married:
35.0% (348)Unmarried:
65.0% (646)
Marital status - Black or African American population 15 years and over
Males 44.9% Never married55.1% Now married0.0% Separated0.0% Widowed0.0% DivorcedFemales 51.4% Never married6.0% Now married0.0% Separated0.0% Widowed42.6% DivorcedWomen who did not give birth in the past 12 months Now married:
0.0% (0)Unmarried:
100.0% (232)
Marital status - American Indian / Alaska Native population 15 years and over
Males 100.0% Never married0.0% Now married0.0% Separated0.0% Widowed0.0% DivorcedFemales 100.0% Never married0.0% Now married0.0% Separated0.0% Widowed0.0% DivorcedWomen who did not give birth in the past 12 months Now married:
0.0% (0)Unmarried:
100.0% (63)
Marital status - Asian population 15 years and over
Males 15.9% Never married67.8% Now married6.6% Separated0.0% Widowed9.6% DivorcedFemales 22.7% Never married64.0% Now married0.0% Separated4.0% Widowed9.3% DivorcedWomen who did not give birth in the past 12 months Now married:
68.4% (129)Unmarried:
31.6% (60)
Marital status - Other race population 15 years and over
Males 52.8% Never married24.9% Now married15.9% Separated0.0% Widowed6.4% DivorcedFemales 58.9% Never married28.4% Now married3.6% Separated0.0% Widowed9.1% DivorcedWomen who gave birth in the past 12 months Now married:
100.0% (10)Unmarried:
0.0% (0)
Women who did not give birth in the past 12 months Now married:
31.0% (262)Unmarried:
69.0% (583)
Marital status - Two or more races population 15 years and over
Males 30.2% Never married57.1% Now married0.0% Separated6.8% Widowed5.9% DivorcedFemales 47.2% Never married37.4% Now married1.5% Separated6.4% Widowed7.5% DivorcedWomen who did not give birth in the past 12 months Now married:
30.4% (160)Unmarried:
69.6% (365)
Marital status - White alone, not Hispanic / Latino population 15 years and over
Males 31.8% Never married59.6% Now married0.0% Separated2.6% Widowed6.0% DivorcedFemales 28.6% Never married42.3% Now married1.6% Separated11.3% Widowed16.3% DivorcedWomen who gave birth in the past 12 months Now married:
60.0% (12)Unmarried:
40.0% (8)
Women who did not give birth in the past 12 months Now married:
45.7% (191)Unmarried:
54.3% (227)
Marital status - Hispanic or Latino population 15 years and over
Males 52.9% Never married35.9% Now married5.5% Separated1.5% Widowed4.2% DivorcedFemales 48.2% Never married30.1% Now married1.9% Separated7.0% Widowed12.9% DivorcedWomen who gave birth in the past 12 months Now married:
23.1% (14)Unmarried:
76.9% (48)
Women who did not give birth in the past 12 months Now married:
27.5% (539)Unmarried:
72.5% (1,420)
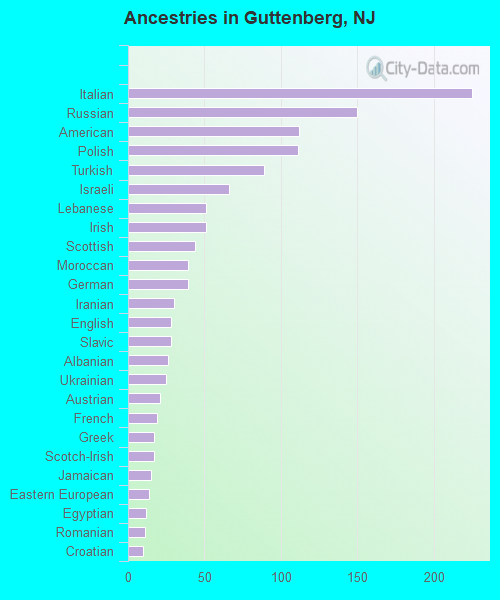
Ancestries in Guttenberg
225 2.8% Italian150 1.9% Russian112 1.4% American111 1.4% Polish89 1.1% Turkish66 0.8% Israeli51 0.6% Lebanese51 0.6% Irish44 0.6% Scottish39 0.5% Moroccan39 0.5% German30 0.4% Iranian28 0.4% English28 0.4% Slavic26 0.3% Albanian25 0.3% Ukrainian21 0.3% Austrian19 0.2% French17 0.2% Greek17 0.2% Scotch-Irish15 0.2% Jamaican14 0.2% Eastern European12 0.2% Egyptian11 0.1% Romanian10 0.1% Croatian9 0.1% European
Children Nativity (place of birth) in Guttenberg
Children under 6 years - Living with two parents Both parents native 77 100.0% NativeBoth parents foreign-born 78 100.0% NativeOne native, one foreign-born parent 185 100.0% NativeChildren under 6 years - Living with one parent Native parent 28 100.0% NativeForeign-born parent 470 92.9% Native36 7.1% Foreign-bornChildren 6 to 17 years - Living with two parents Both parents native 73 100.0% NativeBoth parents foreign-born 366 81.5% Native83 18.5% Foreign-bornOne native, one foreign-born parent 132 100.0% NativeChildren 6 to 17 years - Living with one parent Native parent 217 100.0% Foreign-bornForeign-born parent 493 69.7% Native215 30.3% Foreign-born
Grandparents responsible for own grandchildren in Guttenberg
Grandparents (30 to 59 years) White / Caucasian 17 55.0% Responsible for grandchildren14 45.0% Not responsible for grandchildrenOther race 105 100.0% Responsible for grandchildrenHispanic or Latino 103 81.0% Responsible for grandchildren24 19.0% Not responsible for grandchildren
Grandparents (60 years and over) White / Caucasian 117 100.0% Not responsible for grandchildrenOther race 83 100.0% Not responsible for grandchildrenHispanic or Latino 256 100.0% Not responsible for grandchildren