Jellico, Tennessee Submit your own pictures of this city and show them to the world
OSM Map
General Map
Google Map
MSN Map
OSM Map
General Map
Google Map
MSN Map
OSM Map
General Map
Google Map
MSN Map
OSM Map
General Map
Google Map
MSN Map
Please wait while loading the map...
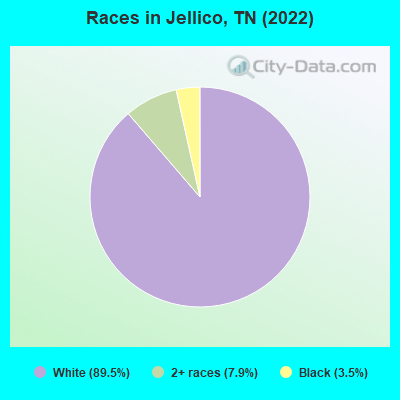
Population in 2022: 2,103 (0% urban, 100% rural). Population change since 2000: -14.1%Males: 1,038 Females: 1,065
March 2022 cost of living index in Jellico: 77.0 (low, U.S. average is 100) Percentage of residents living in poverty in 2022: 26.9%for White Non-Hispanic residents , 22.0% for two or more races residents )
Profiles of local businesses
Business Search - 14 Million verified businesses
Data:
Median household income ($)
Median household income (% change since 2000)
Household income diversity
Ratio of average income to average house value (%)
Ratio of average income to average rent
Median household income ($) - White
Median household income ($) - Black or African American
Median household income ($) - Asian
Median household income ($) - Hispanic or Latino
Median household income ($) - American Indian and Alaska Native
Median household income ($) - Multirace
Median household income ($) - Other Race
Median household income for houses/condos with a mortgage ($)
Median household income for apartments without a mortgage ($)
Races - White alone (%)
Races - White alone (% change since 2000)
Races - Black alone (%)
Races - Black alone (% change since 2000)
Races - American Indian alone (%)
Races - American Indian alone (% change since 2000)
Races - Asian alone (%)
Races - Asian alone (% change since 2000)
Races - Hispanic (%)
Races - Hispanic (% change since 2000)
Races - Native Hawaiian and Other Pacific Islander alone (%)
Races - Native Hawaiian and Other Pacific Islander alone (% change since 2000)
Races - Two or more races (%)
Races - Two or more races (% change since 2000)
Races - Other race alone (%)
Races - Other race alone (% change since 2000)
Racial diversity
Unemployment (%)
Unemployment (% change since 2000)
Unemployment (%) - White
Unemployment (%) - Black or African American
Unemployment (%) - Asian
Unemployment (%) - Hispanic or Latino
Unemployment (%) - American Indian and Alaska Native
Unemployment (%) - Multirace
Unemployment (%) - Other Race
Population density (people per square mile)
Population - Males (%)
Population - Females (%)
Population - Males (%) - White
Population - Males (%) - Black or African American
Population - Males (%) - Asian
Population - Males (%) - Hispanic or Latino
Population - Males (%) - American Indian and Alaska Native
Population - Males (%) - Multirace
Population - Males (%) - Other Race
Population - Females (%) - White
Population - Females (%) - Black or African American
Population - Females (%) - Asian
Population - Females (%) - Hispanic or Latino
Population - Females (%) - American Indian and Alaska Native
Population - Females (%) - Multirace
Population - Females (%) - Other Race
Coronavirus confirmed cases (May 16, 2024)
Deaths caused by coronavirus (May 16, 2024)
Coronavirus confirmed cases (per 100k population) (May 16, 2024)
Deaths caused by coronavirus (per 100k population) (May 16, 2024)
Daily increase in number of cases (May 16, 2024)
Weekly increase in number of cases (May 16, 2024)
Cases doubled (in days) (May 16, 2024)
Hospitalized patients (Apr 18, 2022)
Negative test results (Apr 18, 2022)
Total test results (Apr 18, 2022)
COVID Vaccine doses distributed (per 100k population) (Sep 19, 2023)
COVID Vaccine doses administered (per 100k population) (Sep 19, 2023)
COVID Vaccine doses distributed (Sep 19, 2023)
COVID Vaccine doses administered (Sep 19, 2023)
Likely homosexual households (%)
Likely homosexual households (% change since 2000)
Likely homosexual households - Lesbian couples (%)
Likely homosexual households - Lesbian couples (% change since 2000)
Likely homosexual households - Gay men (%)
Likely homosexual households - Gay men (% change since 2000)
Cost of living index
Median gross rent ($)
Median contract rent ($)
Median monthly housing costs ($)
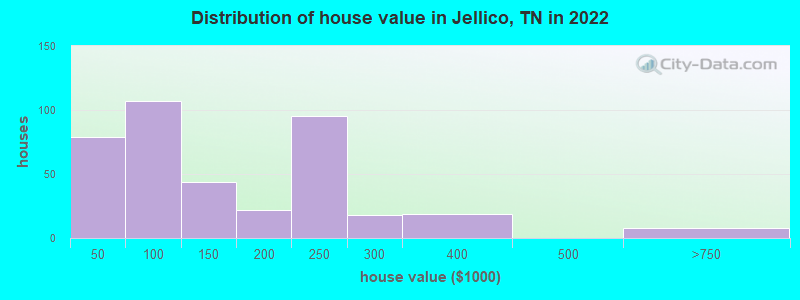
Median house or condo value ($)
Median house or condo value ($ change since 2000)
Mean house or condo value by units in structure - 1, detached ($)
Mean house or condo value by units in structure - 1, attached ($)
Mean house or condo value by units in structure - 2 ($)
Mean house or condo value by units in structure by units in structure - 3 or 4 ($)
Mean house or condo value by units in structure - 5 or more ($)
Mean house or condo value by units in structure - Boat, RV, van, etc. ($)
Mean house or condo value by units in structure - Mobile home ($)
Median house or condo value ($) - White
Median house or condo value ($) - Black or African American
Median house or condo value ($) - Asian
Median house or condo value ($) - Hispanic or Latino
Median house or condo value ($) - American Indian and Alaska Native
Median house or condo value ($) - Multirace
Median house or condo value ($) - Other Race
Median resident age
Resident age diversity
Median resident age - Males
Median resident age - Females
Median resident age - White
Median resident age - Black or African American
Median resident age - Asian
Median resident age - Hispanic or Latino
Median resident age - American Indian and Alaska Native
Median resident age - Multirace
Median resident age - Other Race
Median resident age - Males - White
Median resident age - Males - Black or African American
Median resident age - Males - Asian
Median resident age - Males - Hispanic or Latino
Median resident age - Males - American Indian and Alaska Native
Median resident age - Males - Multirace
Median resident age - Males - Other Race
Median resident age - Females - White
Median resident age - Females - Black or African American
Median resident age - Females - Asian
Median resident age - Females - Hispanic or Latino
Median resident age - Females - American Indian and Alaska Native
Median resident age - Females - Multirace
Median resident age - Females - Other Race
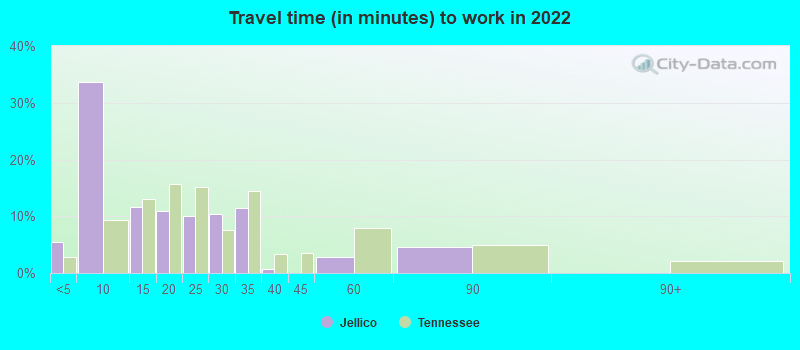
Commute - mean travel time to work (minutes)
Travel time to work - Less than 5 minutes (%)
Travel time to work - Less than 5 minutes (% change since 2000)
Travel time to work - 5 to 9 minutes (%)
Travel time to work - 5 to 9 minutes (% change since 2000)
Travel time to work - 10 to 19 minutes (%)
Travel time to work - 10 to 19 minutes (% change since 2000)
Travel time to work - 20 to 29 minutes (%)
Travel time to work - 20 to 29 minutes (% change since 2000)
Travel time to work - 30 to 39 minutes (%)
Travel time to work - 30 to 39 minutes (% change since 2000)
Travel time to work - 40 to 59 minutes (%)
Travel time to work - 40 to 59 minutes (% change since 2000)
Travel time to work - 60 to 89 minutes (%)
Travel time to work - 60 to 89 minutes (% change since 2000)
Travel time to work - 90 or more minutes (%)
Travel time to work - 90 or more minutes (% change since 2000)
Marital status - Never married (%)
Marital status - Now married (%)
Marital status - Separated (%)
Marital status - Widowed (%)
Marital status - Divorced (%)
Median family income ($)
Median family income (% change since 2000)
Median non-family income ($)
Median non-family income (% change since 2000)
Median per capita income ($)
Median per capita income (% change since 2000)
Median family income ($) - White
Median family income ($) - Black or African American
Median family income ($) - Asian
Median family income ($) - Hispanic or Latino
Median family income ($) - American Indian and Alaska Native
Median family income ($) - Multirace
Median family income ($) - Other Race
Median year house/condo built
Median year apartment built
Year house built - Built 2005 or later (%)
Year house built - Built 2000 to 2004 (%)
Year house built - Built 1990 to 1999 (%)
Year house built - Built 1980 to 1989 (%)
Year house built - Built 1970 to 1979 (%)
Year house built - Built 1960 to 1969 (%)
Year house built - Built 1950 to 1959 (%)
Year house built - Built 1940 to 1949 (%)
Year house built - Built 1939 or earlier (%)
Average household size
Household density (households per square mile)
Average household size - White
Average household size - Black or African American
Average household size - Asian
Average household size - Hispanic or Latino
Average household size - American Indian and Alaska Native
Average household size - Multirace
Average household size - Other Race
Occupied housing units (%)
Vacant housing units (%)
Owner occupied housing units (%)
Renter occupied housing units (%)
Vacancy status - For rent (%)
Vacancy status - For sale only (%)
Vacancy status - Rented or sold, not occupied (%)
Vacancy status - For seasonal, recreational, or occasional use (%)
Vacancy status - For migrant workers (%)
Vacancy status - Other vacant (%)
Residents with income below the poverty level (%)
Residents with income below 50% of the poverty level (%)
Children below poverty level (%)
Poor families by family type - Married-couple family (%)
Poor families by family type - Male, no wife present (%)
Poor families by family type - Female, no husband present (%)
Poverty status for native-born residents (%)
Poverty status for foreign-born residents (%)
Poverty among high school graduates not in families (%)
Poverty among people who did not graduate high school not in families (%)
Residents with income below the poverty level (%) - White
Residents with income below the poverty level (%) - Black or African American
Residents with income below the poverty level (%) - Asian
Residents with income below the poverty level (%) - Hispanic or Latino
Residents with income below the poverty level (%) - American Indian and Alaska Native
Residents with income below the poverty level (%) - Multirace
Residents with income below the poverty level (%) - Other Race
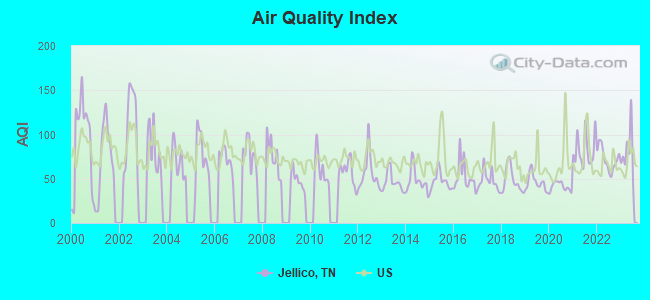
Air pollution - Air Quality Index (AQI)
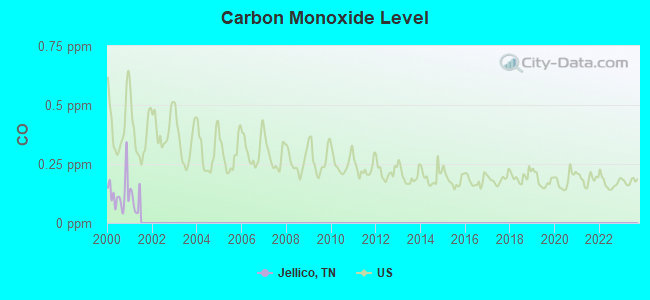
Air pollution - CO
Air pollution - NO2
Air pollution - SO2
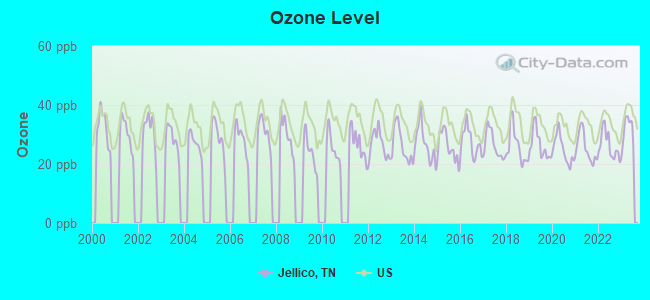
Air pollution - Ozone
Air pollution - PM10
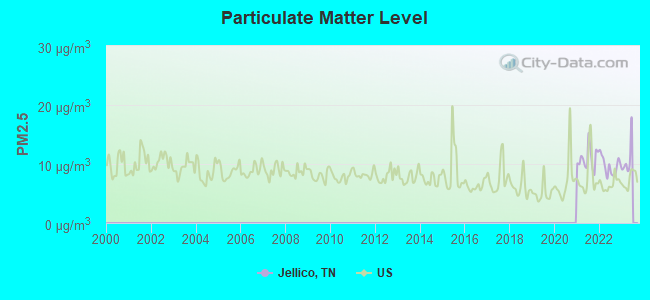
Air pollution - PM25
Air pollution - Pb
Crime - Murders per 100,000 population
Crime - Rapes per 100,000 population
Crime - Robberies per 100,000 population
Crime - Assaults per 100,000 population
Crime - Burglaries per 100,000 population
Crime - Thefts per 100,000 population
Crime - Auto thefts per 100,000 population
Crime - Arson per 100,000 population
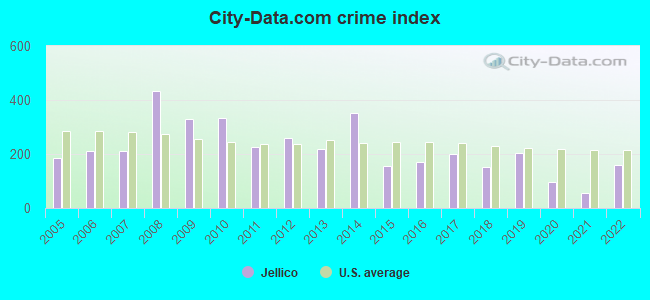
Crime - City-data.com crime index
Crime - Violent crime index
Crime - Property crime index
Crime - Murders per 100,000 population (5 year average)
Crime - Rapes per 100,000 population (5 year average)
Crime - Robberies per 100,000 population (5 year average)
Crime - Assaults per 100,000 population (5 year average)
Crime - Burglaries per 100,000 population (5 year average)
Crime - Thefts per 100,000 population (5 year average)
Crime - Auto thefts per 100,000 population (5 year average)
Crime - Arson per 100,000 population (5 year average)
Crime - City-data.com crime index (5 year average)
Crime - Violent crime index (5 year average)
Crime - Property crime index (5 year average)
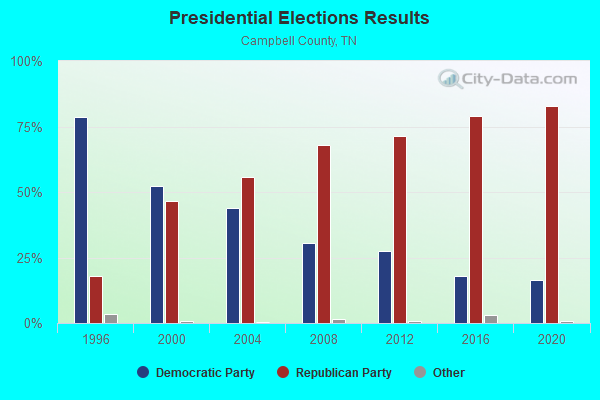
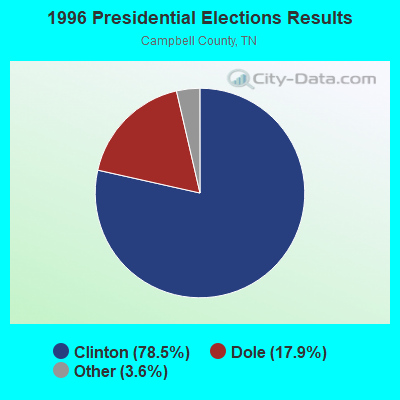
1996 Presidential Elections Results (%) - Democratic Party (Clinton)
1996 Presidential Elections Results (%) - Republican Party (Dole)
1996 Presidential Elections Results (%) - Other
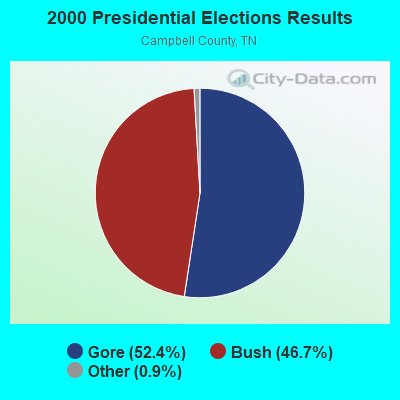
2000 Presidential Elections Results (%) - Democratic Party (Gore)
2000 Presidential Elections Results (%) - Republican Party (Bush)
2000 Presidential Elections Results (%) - Other
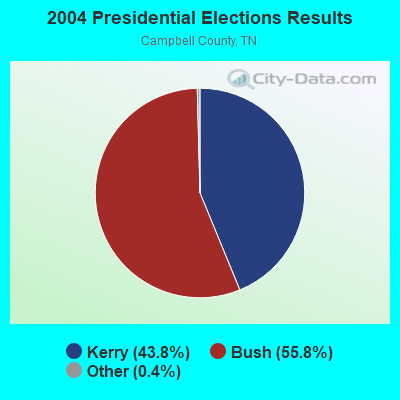
2004 Presidential Elections Results (%) - Democratic Party (Kerry)
2004 Presidential Elections Results (%) - Republican Party (Bush)
2004 Presidential Elections Results (%) - Other
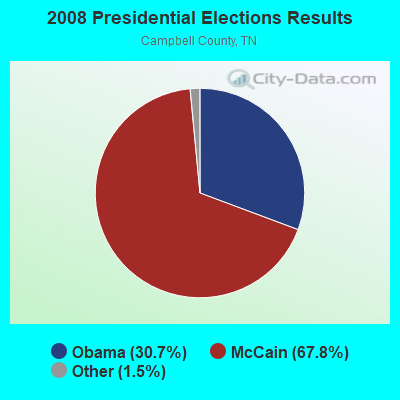
2008 Presidential Elections Results (%) - Democratic Party (Obama)
2008 Presidential Elections Results (%) - Republican Party (McCain)
2008 Presidential Elections Results (%) - Other
2012 Presidential Elections Results (%) - Democratic Party (Obama)
2012 Presidential Elections Results (%) - Republican Party (Romney)
2012 Presidential Elections Results (%) - Other
2016 Presidential Elections Results (%) - Democratic Party (Clinton)
2016 Presidential Elections Results (%) - Republican Party (Trump)
2016 Presidential Elections Results (%) - Other
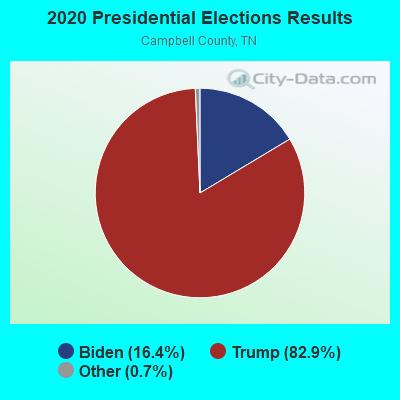
2020 Presidential Elections Results (%) - Democratic Party (Biden)
2020 Presidential Elections Results (%) - Republican Party (Trump)
2020 Presidential Elections Results (%) - Other
Ancestries Reported - Arab (%)
Ancestries Reported - Czech (%)
Ancestries Reported - Danish (%)
Ancestries Reported - Dutch (%)
Ancestries Reported - English (%)
Ancestries Reported - French (%)
Ancestries Reported - French Canadian (%)
Ancestries Reported - German (%)
Ancestries Reported - Greek (%)
Ancestries Reported - Hungarian (%)
Ancestries Reported - Irish (%)
Ancestries Reported - Italian (%)
Ancestries Reported - Lithuanian (%)
Ancestries Reported - Norwegian (%)
Ancestries Reported - Polish (%)
Ancestries Reported - Portuguese (%)
Ancestries Reported - Russian (%)
Ancestries Reported - Scotch-Irish (%)
Ancestries Reported - Scottish (%)
Ancestries Reported - Slovak (%)
Ancestries Reported - Subsaharan African (%)
Ancestries Reported - Swedish (%)
Ancestries Reported - Swiss (%)
Ancestries Reported - Ukrainian (%)
Ancestries Reported - United States (%)
Ancestries Reported - Welsh (%)
Ancestries Reported - West Indian (%)
Ancestries Reported - Other (%)
Educational Attainment - No schooling completed (%)
Educational Attainment - Less than high school (%)
Educational Attainment - High school or equivalent (%)
Educational Attainment - Less than 1 year of college (%)
Educational Attainment - 1 or more years of college (%)
Educational Attainment - Associate degree (%)
Educational Attainment - Bachelor's degree (%)
Educational Attainment - Master's degree (%)
Educational Attainment - Professional school degree (%)
Educational Attainment - Doctorate degree (%)
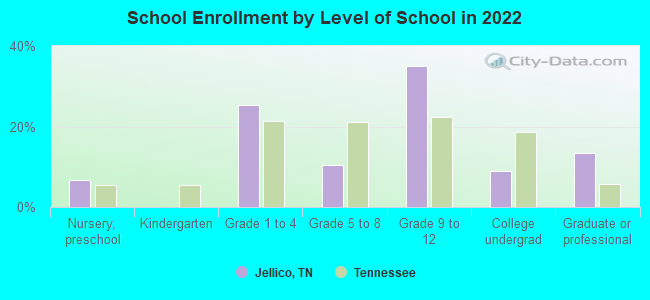
School Enrollment - Nursery, preschool (%)
School Enrollment - Kindergarten (%)
School Enrollment - Grade 1 to 4 (%)
School Enrollment - Grade 5 to 8 (%)
School Enrollment - Grade 9 to 12 (%)
School Enrollment - College undergrad (%)
School Enrollment - Graduate or professional (%)
School Enrollment - Not enrolled in school (%)
School enrollment - Public schools (%)
School enrollment - Private schools (%)
School enrollment - Not enrolled (%)
Median number of rooms in houses and condos
Median number of rooms in apartments
Housing units lacking complete plumbing facilities (%)
Housing units lacking complete kitchen facilities (%)
Density of houses
Urban houses (%)
Rural houses (%)
Households with people 60 years and over (%)
Households with people 65 years and over (%)
Households with people 75 years and over (%)
Households with one or more nonrelatives (%)
Households with no nonrelatives (%)
Population in households (%)
Family households (%)
Nonfamily households (%)
Population in families (%)
Family households with own children (%)
Median number of bedrooms in owner occupied houses
Mean number of bedrooms in owner occupied houses
Median number of bedrooms in renter occupied houses
Mean number of bedrooms in renter occupied houses
Median number of vehichles in owner occupied houses
Mean number of vehichles in owner occupied houses
Median number of vehichles in renter occupied houses
Mean number of vehichles in renter occupied houses
Mortgage status - with mortgage (%)
Mortgage status - with second mortgage (%)
Mortgage status - with home equity loan (%)
Mortgage status - with both second mortgage and home equity loan (%)
Mortgage status - without a mortgage (%)
Average family size
Average family size - White
Average family size - Black or African American
Average family size - Asian
Average family size - Hispanic or Latino
Average family size - American Indian and Alaska Native
Average family size - Multirace
Average family size - Other Race
Geographical mobility - Same house 1 year ago (%)
Geographical mobility - Moved within same county (%)
Geographical mobility - Moved from different county within same state (%)
Geographical mobility - Moved from different state (%)
Geographical mobility - Moved from abroad (%)
Place of birth - Born in state of residence (%)
Place of birth - Born in other state (%)
Place of birth - Native, outside of US (%)
Place of birth - Foreign born (%)
Housing units in structures - 1, detached (%)
Housing units in structures - 1, attached (%)
Housing units in structures - 2 (%)
Housing units in structures - 3 or 4 (%)
Housing units in structures - 5 to 9 (%)
Housing units in structures - 10 to 19 (%)
Housing units in structures - 20 to 49 (%)
Housing units in structures - 50 or more (%)
Housing units in structures - Mobile home (%)
Housing units in structures - Boat, RV, van, etc. (%)
House/condo owner moved in on average (years ago)
Renter moved in on average (years ago)
Year householder moved into unit - Moved in 1999 to March 2000 (%)
Year householder moved into unit - Moved in 1995 to 1998 (%)
Year householder moved into unit - Moved in 1990 to 1994 (%)
Year householder moved into unit - Moved in 1980 to 1989 (%)
Year householder moved into unit - Moved in 1970 to 1979 (%)
Year householder moved into unit - Moved in 1969 or earlier (%)
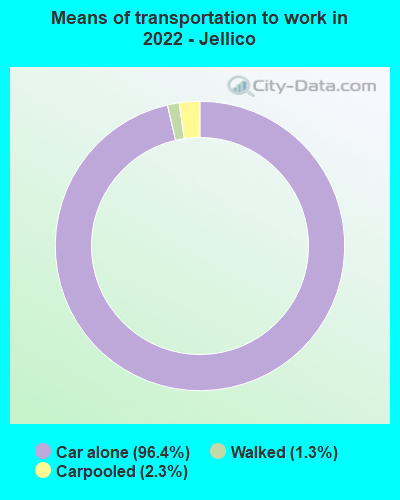
Means of transportation to work - Drove car alone (%)
Means of transportation to work - Carpooled (%)
Means of transportation to work - Public transportation (%)
Means of transportation to work - Bus or trolley bus (%)
Means of transportation to work - Streetcar or trolley car (%)
Means of transportation to work - Subway or elevated (%)
Means of transportation to work - Railroad (%)
Means of transportation to work - Ferryboat (%)
Means of transportation to work - Taxicab (%)
Means of transportation to work - Motorcycle (%)
Means of transportation to work - Bicycle (%)
Means of transportation to work - Walked (%)
Means of transportation to work - Other means (%)
Working at home (%)
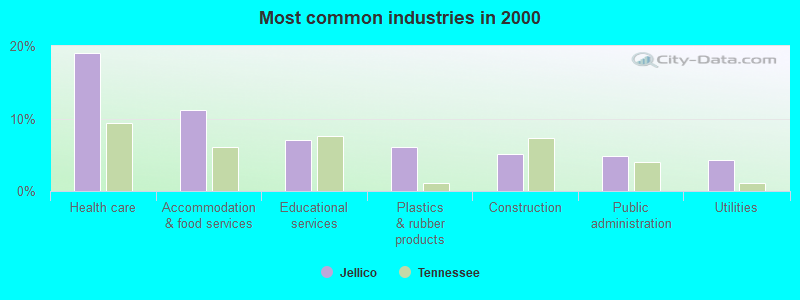
Industry diversity
Most Common Industries - Agriculture, forestry, fishing and hunting, and mining (%)
Most Common Industries - Agriculture, forestry, fishing and hunting (%)
Most Common Industries - Mining, quarrying, and oil and gas extraction (%)
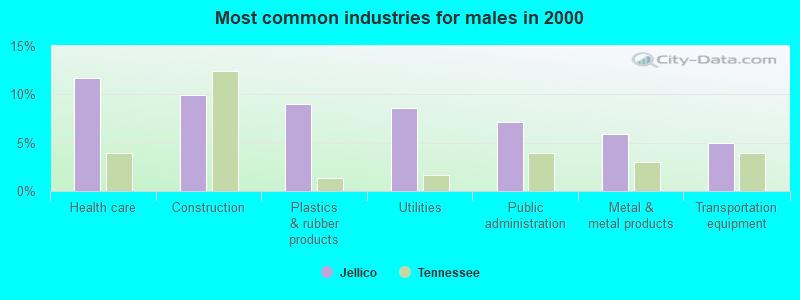
Most Common Industries - Construction (%)
Most Common Industries - Manufacturing (%)
Most Common Industries - Wholesale trade (%)
Most Common Industries - Retail trade (%)
Most Common Industries - Transportation and warehousing, and utilities (%)
Most Common Industries - Transportation and warehousing (%)
Most Common Industries - Utilities (%)
Most Common Industries - Information (%)
Most Common Industries - Finance and insurance, and real estate and rental and leasing (%)
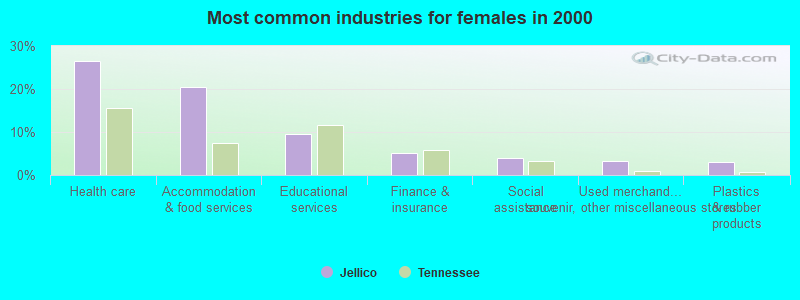
Most Common Industries - Finance and insurance (%)
Most Common Industries - Real estate and rental and leasing (%)
Most Common Industries - Professional, scientific, and management, and administrative and waste management services (%)
Most Common Industries - Professional, scientific, and technical services (%)
Most Common Industries - Management of companies and enterprises (%)
Most Common Industries - Administrative and support and waste management services (%)
Most Common Industries - Educational services, and health care and social assistance (%)
Most Common Industries - Educational services (%)
Most Common Industries - Health care and social assistance (%)
Most Common Industries - Arts, entertainment, and recreation, and accommodation and food services (%)
Most Common Industries - Arts, entertainment, and recreation (%)
Most Common Industries - Accommodation and food services (%)
Most Common Industries - Other services, except public administration (%)
Most Common Industries - Public administration (%)
Occupation diversity
Most Common Occupations - Management, business, science, and arts occupations (%)
Most Common Occupations - Management, business, and financial occupations (%)
Most Common Occupations - Management occupations (%)
Most Common Occupations - Business and financial operations occupations (%)
Most Common Occupations - Computer, engineering, and science occupations (%)
Most Common Occupations - Computer and mathematical occupations (%)
Most Common Occupations - Architecture and engineering occupations (%)
Most Common Occupations - Life, physical, and social science occupations (%)
Most Common Occupations - Education, legal, community service, arts, and media occupations (%)
Most Common Occupations - Community and social service occupations (%)
Most Common Occupations - Legal occupations (%)
Most Common Occupations - Education, training, and library occupations (%)
Most Common Occupations - Arts, design, entertainment, sports, and media occupations (%)
Most Common Occupations - Healthcare practitioners and technical occupations (%)
Most Common Occupations - Health diagnosing and treating practitioners and other technical occupations (%)
Most Common Occupations - Health technologists and technicians (%)
Most Common Occupations - Service occupations (%)
Most Common Occupations - Healthcare support occupations (%)
Most Common Occupations - Protective service occupations (%)
Most Common Occupations - Fire fighting and prevention, and other protective service workers including supervisors (%)
Most Common Occupations - Law enforcement workers including supervisors (%)
Most Common Occupations - Food preparation and serving related occupations (%)
Most Common Occupations - Building and grounds cleaning and maintenance occupations (%)
Most Common Occupations - Personal care and service occupations (%)
Most Common Occupations - Sales and office occupations (%)
Most Common Occupations - Sales and related occupations (%)
Most Common Occupations - Office and administrative support occupations (%)
Most Common Occupations - Natural resources, construction, and maintenance occupations (%)
Most Common Occupations - Farming, fishing, and forestry occupations (%)
Most Common Occupations - Construction and extraction occupations (%)
Most Common Occupations - Installation, maintenance, and repair occupations (%)
Most Common Occupations - Production, transportation, and material moving occupations (%)
Most Common Occupations - Production occupations (%)
Most Common Occupations - Transportation occupations (%)
Most Common Occupations - Material moving occupations (%)
People in Group quarters - Institutionalized population (%)
People in Group quarters - Correctional institutions (%)
People in Group quarters - Federal prisons and detention centers (%)
People in Group quarters - Halfway houses (%)
People in Group quarters - Local jails and other confinement facilities (including police lockups) (%)
People in Group quarters - Military disciplinary barracks (%)
People in Group quarters - State prisons (%)
People in Group quarters - Other types of correctional institutions (%)
People in Group quarters - Nursing homes (%)
People in Group quarters - Hospitals/wards, hospices, and schools for the handicapped (%)
People in Group quarters - Hospitals/wards and hospices for chronically ill (%)
People in Group quarters - Hospices or homes for chronically ill (%)
People in Group quarters - Military hospitals or wards for chronically ill (%)
People in Group quarters - Other hospitals or wards for chronically ill (%)
People in Group quarters - Hospitals or wards for drug/alcohol abuse (%)
People in Group quarters - Mental (Psychiatric) hospitals or wards (%)
People in Group quarters - Schools, hospitals, or wards for the mentally retarded (%)
People in Group quarters - Schools, hospitals, or wards for the physically handicapped (%)
People in Group quarters - Institutions for the deaf (%)
People in Group quarters - Institutions for the blind (%)
People in Group quarters - Orthopedic wards and institutions for the physically handicapped (%)
People in Group quarters - Wards in general hospitals for patients who have no usual home elsewhere (%)
People in Group quarters - Wards in military hospitals for patients who have no usual home elsewhere (%)
People in Group quarters - Juvenile institutions (%)
People in Group quarters - Long-term care (%)
People in Group quarters - Homes for abused, dependent, and neglected children (%)
People in Group quarters - Residential treatment centers for emotionally disturbed children (%)
People in Group quarters - Training schools for juvenile delinquents (%)
People in Group quarters - Short-term care, detention or diagnostic centers for delinquent children (%)
People in Group quarters - Type of juvenile institution unknown (%)
People in Group quarters - Noninstitutionalized population (%)
People in Group quarters - College dormitories (includes college quarters off campus) (%)
People in Group quarters - Military quarters (%)
People in Group quarters - On base (%)
People in Group quarters - Barracks, unaccompanied personnel housing (UPH), (Enlisted/Officer), ;and similar group living quarters for military personnel (%)
People in Group quarters - Transient quarters for temporary residents (%)
People in Group quarters - Military ships (%)
People in Group quarters - Group homes (%)
People in Group quarters - Homes or halfway houses for drug/alcohol abuse (%)
People in Group quarters - Homes for the mentally ill (%)
People in Group quarters - Homes for the mentally retarded (%)
People in Group quarters - Homes for the physically handicapped (%)
People in Group quarters - Other group homes (%)
People in Group quarters - Religious group quarters (%)
People in Group quarters - Dormitories (%)
People in Group quarters - Agriculture workers' dormitories on farms (%)
People in Group quarters - Job Corps and vocational training facilities (%)
People in Group quarters - Other workers' dormitories (%)
People in Group quarters - Crews of maritime vessels (%)
People in Group quarters - Other nonhousehold living situations (%)
People in Group quarters - Other noninstitutional group quarters (%)
Residents speaking English at home (%)
Residents speaking English at home - Born in the United States (%)
Residents speaking English at home - Native, born elsewhere (%)
Residents speaking English at home - Foreign born (%)
Residents speaking Spanish at home (%)
Residents speaking Spanish at home - Born in the United States (%)
Residents speaking Spanish at home - Native, born elsewhere (%)
Residents speaking Spanish at home - Foreign born (%)
Residents speaking other language at home (%)
Residents speaking other language at home - Born in the United States (%)
Residents speaking other language at home - Native, born elsewhere (%)
Residents speaking other language at home - Foreign born (%)
Class of Workers - Employee of private company (%)
Class of Workers - Self-employed in own incorporated business (%)
Class of Workers - Private not-for-profit wage and salary workers (%)
Class of Workers - Local government workers (%)
Class of Workers - State government workers (%)
Class of Workers - Federal government workers (%)
Class of Workers - Self-employed workers in own not incorporated business and Unpaid family workers (%)
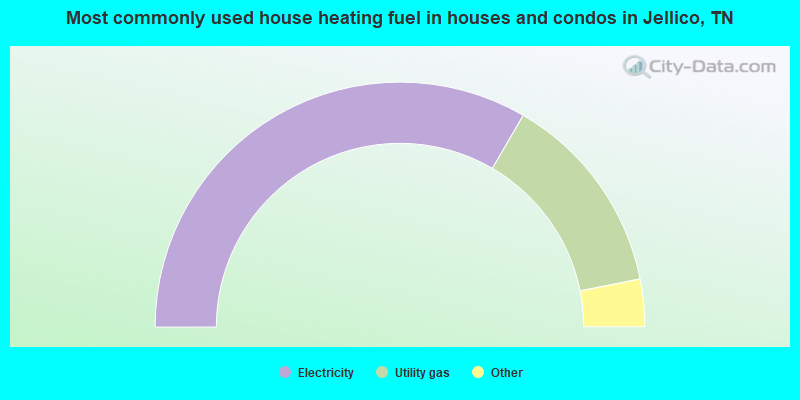
House heating fuel used in houses and condos - Utility gas (%)
House heating fuel used in houses and condos - Bottled, tank, or LP gas (%)
House heating fuel used in houses and condos - Electricity (%)
House heating fuel used in houses and condos - Fuel oil, kerosene, etc. (%)
House heating fuel used in houses and condos - Coal or coke (%)
House heating fuel used in houses and condos - Wood (%)
House heating fuel used in houses and condos - Solar energy (%)
House heating fuel used in houses and condos - Other fuel (%)
House heating fuel used in houses and condos - No fuel used (%)
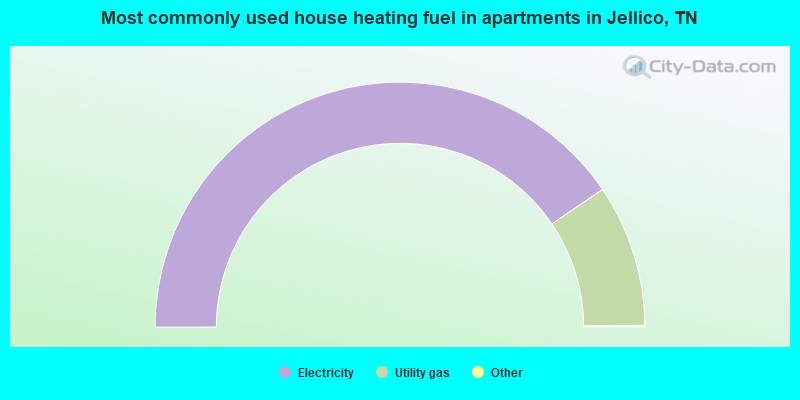
House heating fuel used in apartments - Utility gas (%)
House heating fuel used in apartments - Bottled, tank, or LP gas (%)
House heating fuel used in apartments - Electricity (%)
House heating fuel used in apartments - Fuel oil, kerosene, etc. (%)
House heating fuel used in apartments - Coal or coke (%)
House heating fuel used in apartments - Wood (%)
House heating fuel used in apartments - Solar energy (%)
House heating fuel used in apartments - Other fuel (%)
House heating fuel used in apartments - No fuel used (%)
Armed forces status - In Armed Forces (%)
Armed forces status - Civilian (%)
Armed forces status - Civilian - Veteran (%)
Armed forces status - Civilian - Nonveteran (%)
Fatal accidents locations in years 2005-2021
Fatal accidents locations in 2005
Fatal accidents locations in 2006
Fatal accidents locations in 2007
Fatal accidents locations in 2008
Fatal accidents locations in 2009
Fatal accidents locations in 2010
Fatal accidents locations in 2011
Fatal accidents locations in 2012
Fatal accidents locations in 2013
Fatal accidents locations in 2014
Fatal accidents locations in 2015
Fatal accidents locations in 2016
Fatal accidents locations in 2017
Fatal accidents locations in 2018
Fatal accidents locations in 2019
Fatal accidents locations in 2020
Fatal accidents locations in 2021
Alcohol use - People drinking some alcohol every month (%)
Alcohol use - People not drinking at all (%)
Alcohol use - Average days/month drinking alcohol
Alcohol use - Average drinks/week
Alcohol use - Average days/year people drink much
Audiometry - Average condition of hearing (%)
Audiometry - People that can hear a whisper from across a quiet room (%)
Audiometry - People that can hear normal voice from across a quiet room (%)
Audiometry - Ears ringing, roaring, buzzing (%)
Audiometry - Had a job exposure to loud noise (%)
Audiometry - Had off-work exposure to loud noise (%)
Blood Pressure & Cholesterol - Has high blood pressure (%)
Blood Pressure & Cholesterol - Checking blood pressure at home (%)
Blood Pressure & Cholesterol - Frequently checking blood cholesterol (%)
Blood Pressure & Cholesterol - Has high cholesterol level (%)
Consumer Behavior - Money monthly spent on food at supermarket/grocery store
Consumer Behavior - Money monthly spent on food at other stores
Consumer Behavior - Money monthly spent on eating out
Consumer Behavior - Money monthly spent on carryout/delivered foods
Consumer Behavior - Income spent on food at supermarket/grocery store (%)
Consumer Behavior - Income spent on food at other stores (%)
Consumer Behavior - Income spent on eating out (%)
Consumer Behavior - Income spent on carryout/delivered foods (%)
Current Health Status - General health condition (%)
Current Health Status - Blood donors (%)
Current Health Status - Has blood ever tested for HIV virus (%)
Current Health Status - Left-handed people (%)
Dermatology - People using sunscreen (%)
Diabetes - Diabetics (%)
Diabetes - Had a blood test for high blood sugar (%)
Diabetes - People taking insulin (%)
Diet Behavior & Nutrition - Diet health (%)
Diet Behavior & Nutrition - Milk product consumption (# of products/month)
Diet Behavior & Nutrition - Meals not home prepared (#/week)
Diet Behavior & Nutrition - Meals from fast food or pizza place (#/week)
Diet Behavior & Nutrition - Ready-to-eat foods (#/month)
Diet Behavior & Nutrition - Frozen meals/pizza (#/month)
Drug Use - People that ever used marijuana or hashish (%)
Drug Use - Ever used hard drugs (%)
Drug Use - Ever used any form of cocaine (%)
Drug Use - Ever used heroin (%)
Drug Use - Ever used methamphetamine (%)
Health Insurance - People covered by health insurance (%)
Kidney Conditions-Urology - Avg. # of times urinating at night
Medical Conditions - People with asthma (%)
Medical Conditions - People with anemia (%)
Medical Conditions - People with psoriasis (%)
Medical Conditions - People with overweight (%)
Medical Conditions - Elderly people having difficulties in thinking or remembering (%)
Medical Conditions - People who ever received blood transfusion (%)
Medical Conditions - People having trouble seeing even with glass/contacts (%)
Medical Conditions - People with arthritis (%)
Medical Conditions - People with gout (%)
Medical Conditions - People with congestive heart failure (%)
Medical Conditions - People with coronary heart disease (%)
Medical Conditions - People with angina pectoris (%)
Medical Conditions - People who ever had heart attack (%)
Medical Conditions - People who ever had stroke (%)
Medical Conditions - People with emphysema (%)
Medical Conditions - People with thyroid problem (%)
Medical Conditions - People with chronic bronchitis (%)
Medical Conditions - People with any liver condition (%)
Medical Conditions - People who ever had cancer or malignancy (%)
Mental Health - People who have little interest in doing things (%)
Mental Health - People feeling down, depressed, or hopeless (%)
Mental Health - People who have trouble sleeping or sleeping too much (%)
Mental Health - People feeling tired or having little energy (%)
Mental Health - People with poor appetite or overeating (%)
Mental Health - People feeling bad about themself (%)
Mental Health - People who have trouble concentrating on things (%)
Mental Health - People moving or speaking slowly or too fast (%)
Mental Health - People having thoughts they would be better off dead (%)
Oral Health - Average years since last visit a dentist
Oral Health - People embarrassed because of mouth (%)
Oral Health - People with gum disease (%)
Oral Health - General health of teeth and gums (%)
Oral Health - Average days a week using dental floss/device
Oral Health - Average days a week using mouthwash for dental problem
Oral Health - Average number of teeth
Pesticide Use - Households using pesticides to control insects (%)
Pesticide Use - Households using pesticides to kill weeds (%)
Physical Activity - People doing vigorous-intensity work activities (%)
Physical Activity - People doing moderate-intensity work activities (%)
Physical Activity - People walking or bicycling (%)
Physical Activity - People doing vigorous-intensity recreational activities (%)
Physical Activity - People doing moderate-intensity recreational activities (%)
Physical Activity - Average hours a day doing sedentary activities
Physical Activity - Average hours a day watching TV or videos
Physical Activity - Average hours a day using computer
Physical Functioning - People having limitations keeping them from working (%)
Physical Functioning - People limited in amount of work they can do (%)
Physical Functioning - People that need special equipment to walk (%)
Physical Functioning - People experiencing confusion/memory problems (%)
Physical Functioning - People requiring special healthcare equipment (%)
Prescription Medications - Average number of prescription medicines taking
Preventive Aspirin Use - Adults 40+ taking low-dose aspirin (%)
Reproductive Health - Vaginal deliveries (%)
Reproductive Health - Cesarean deliveries (%)
Reproductive Health - Deliveries resulted in a live birth (%)
Reproductive Health - Pregnancies resulted in a delivery (%)
Reproductive Health - Women breastfeeding newborns (%)
Reproductive Health - Women that had a hysterectomy (%)
Reproductive Health - Women that had both ovaries removed (%)
Reproductive Health - Women that have ever taken birth control pills (%)
Reproductive Health - Women taking birth control pills (%)
Reproductive Health - Women that have ever used Depo-Provera or injectables (%)
Reproductive Health - Women that have ever used female hormones (%)
Sexual Behavior - People 18+ that ever had sex (vaginal, anal, or oral) (%)
Sexual Behavior - Males 18+ that ever had vaginal sex with a woman (%)
Sexual Behavior - Males 18+ that ever performed oral sex on a woman (%)
Sexual Behavior - Males 18+ that ever had anal sex with a woman (%)
Sexual Behavior - Males 18+ that ever had any sex with a man (%)
Sexual Behavior - Females 18+ that ever had vaginal sex with a man (%)
Sexual Behavior - Females 18+ that ever performed oral sex on a man (%)
Sexual Behavior - Females 18+ that ever had anal sex with a man (%)
Sexual Behavior - Females 18+ that ever had any kind of sex with a woman (%)
Sexual Behavior - Average age people first had sex
Sexual Behavior - Average number of female sex partners in lifetime (males 18+)
Sexual Behavior - Average number of female vaginal sex partners in lifetime (males 18+)
Sexual Behavior - Average age people first performed oral sex on a woman (18+)
Sexual Behavior - Average number of woman performed oral sex on in lifetime (18+)
Sexual Behavior - Average number of male sex partners in lifetime (males 18+)
Sexual Behavior - Average number of male anal sex partners in lifetime (males 18+)
Sexual Behavior - Average age people first performed oral sex on a man (18+)
Sexual Behavior - Average number of male oral sex partners in lifetime (18+)
Sexual Behavior - People using protection when performing oral sex (%)
Sexual Behavior - Average number of times people have vaginal or anal sex a year
Sexual Behavior - People having sex without condom (%)
Sexual Behavior - Average number of male sex partners in lifetime (females 18+)
Sexual Behavior - Average number of male vaginal sex partners in lifetime (females 18+)
Sexual Behavior - Average number of female sex partners in lifetime (females 18+)
Sexual Behavior - Circumcised males 18+ (%)
Sleep Disorders - Average hours sleeping at night
Sleep Disorders - People that has trouble sleeping (%)
Smoking-Cigarette Use - People smoking cigarettes (%)
Taste & Smell - People 40+ having problems with smell (%)
Taste & Smell - People 40+ having problems with taste (%)
Taste & Smell - People 40+ that ever had wisdom teeth removed (%)
Taste & Smell - People 40+ that ever had tonsils teeth removed (%)
Taste & Smell - People 40+ that ever had a loss of consciousness because of a head injury (%)
Taste & Smell - People 40+ that ever had a broken nose or other serious injury to face or skull (%)
Taste & Smell - People 40+ that ever had two or more sinus infections (%)
Weight - Average height (inches)
Weight - Average weight (pounds)
Weight - Average BMI
Weight - People that are obese (%)
Weight - People that ever were obese (%)
Weight - People trying to lose weight (%)
According to our research of Tennessee and other state lists, there were 5 registered sex offenders living in Jellico, Tennessee as of May 16, 2024 . The ratio of all residents to sex offenders in Jellico is 506 to 1.The ratio of registered sex offenders to all residents in this city is lower than the state average.
Officers per 1,000 residents here:
2.37Tennessee average:
2.57
Latest news from Jellico, TN collected exclusively by city-data.com from local newspapers, TV, and radio stations
Ancestries: American (29.1%), English (10.1%), German (4.9%), Scottish (4.8%), Irish (4.0%), European (3.8%).
Current Local Time:
Land area: 4.36 square miles.
Population density: 483 people per square mile (low).
17 residents are foreign born
This city:
0.9%Tennessee:
5.4%
Median real estate property taxes paid for housing units with mortgages in 2022: $946 (0.4%)Median real estate property taxes paid for housing units with no mortgage in 2022: $513 (0.6%)
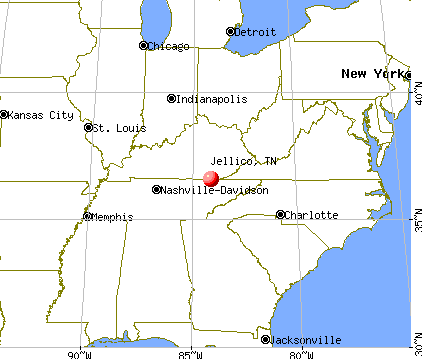
Nearest city with pop. 50,000+: Knoxville, TN
Nearest city with pop. 200,000+: Fayette, KY
Nearest city with pop. 1,000,000+: Chicago, IL
Nearest cities:
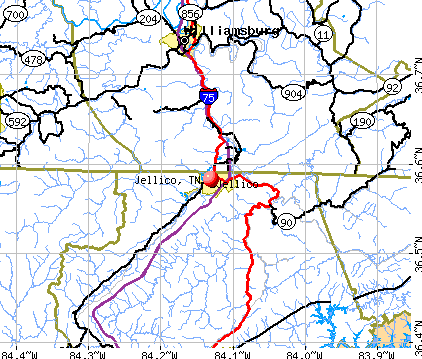
Latitude: 36.58 N, Longitude: 84.13 W
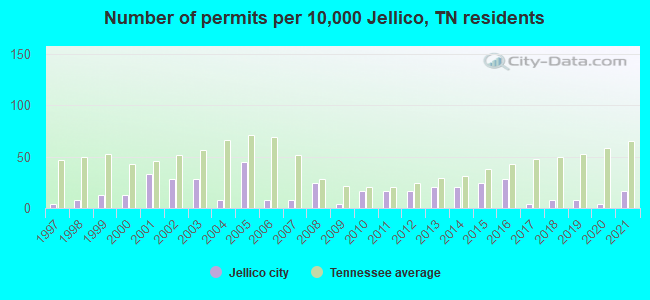
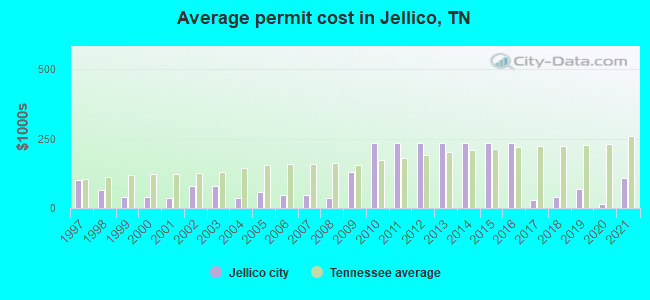
Single-family new house construction building permits:
2021: 4 buildings , average cost: $108,3002020: 1 building , cost: $15,0002019: 2 buildings , average cost: $67,5002018: 2 buildings , average cost: $40,0002017: 1 building , cost: $30,0002016: 7 buildings , average cost: $234,5002015: 6 buildings , average cost: $234,5002014: 5 buildings , average cost: $234,5002013: 5 buildings , average cost: $234,5002012: 4 buildings , average cost: $234,5002011: 4 buildings , average cost: $234,5002010: 4 buildings , average cost: $234,5002009: 1 building , cost: $130,0002008: 6 buildings , average cost: $36,2002007: 2 buildings , average cost: $44,5002006: 2 buildings , average cost: $44,5002005: 11 buildings , average cost: $56,7002004: 2 buildings , average cost: $35,0002003: 7 buildings , average cost: $78,2002002: 7 buildings , average cost: $78,2002001: 8 buildings , average cost: $35,5002000: 3 buildings , average cost: $40,7001999: 3 buildings , average cost: $40,7001998: 2 buildings , average cost: $65,0001997: 1 building , cost: $100,000Unemployment in December 2023:
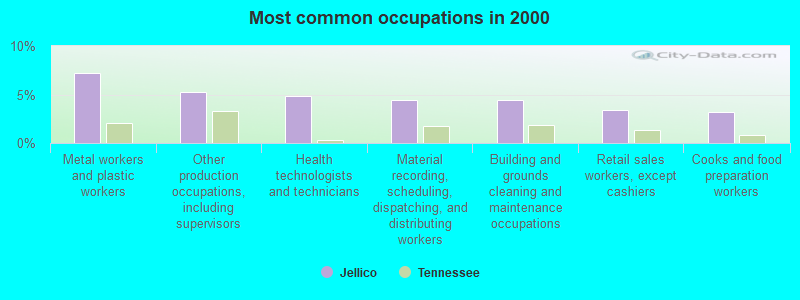
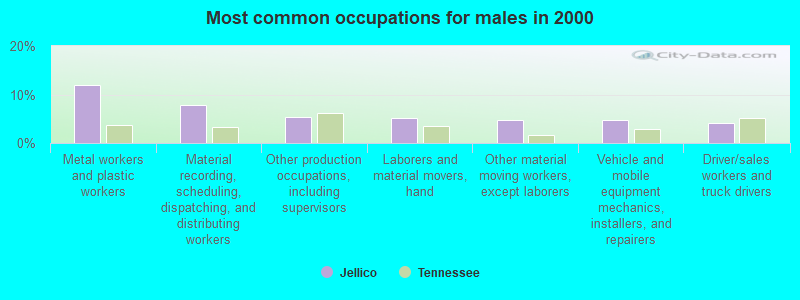
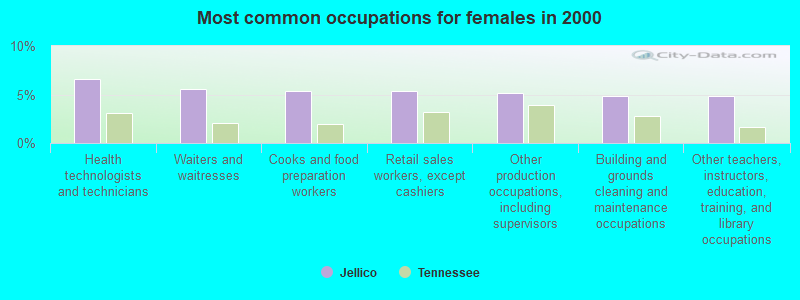
Most common occupations in Jellico, TN (%)
Both Males Females
Metal workers and plastic workers (7.2%)
Other production occupations, including supervisors (5.3%)
Health technologists and technicians (4.8%)
Material recording, scheduling, dispatching, and distributing workers (4.4%)
Building and grounds cleaning and maintenance occupations (4.4%)
Retail sales workers, except cashiers (3.4%)
Cooks and food preparation workers (3.2%)
Metal workers and plastic workers (11.9%)
Material recording, scheduling, dispatching, and distributing workers (7.8%)
Other production occupations, including supervisors (5.5%)
Laborers and material movers, hand (5.2%)
Other material moving workers, except laborers (4.8%)
Vehicle and mobile equipment mechanics, installers, and repairers (4.8%)
Driver/sales workers and truck drivers (4.0%)
Health technologists and technicians (6.6%)
Waiters and waitresses (5.6%)
Cooks and food preparation workers (5.4%)
Retail sales workers, except cashiers (5.4%)
Other production occupations, including supervisors (5.1%)
Building and grounds cleaning and maintenance occupations (4.9%)
Other teachers, instructors, education, training, and library occupations (4.9%)
Tornado activity:
Jellico-area historical tornado activity is below Tennessee state average. It is 21% smaller than the overall U.S. average.
On 4/3/1974, a category F4 (max. wind speeds 207-260 mph) tornado 25.0 miles away from the Jellico city center .
On 3/12/1967, a category F3 (max. wind speeds 158-206 mph) tornado 6.0 miles away from the city center injured 5 people and caused between $50,000 and $500,000 in damages.
Earthquake activity:
Jellico-area historical earthquake activity is significantly above Tennessee state average. It is 80% greater than the overall U.S. average. On 7/27/1980 at 18:52:21, a magnitude 5.2 (5.1 MB, 4.7 MS, 5.0 UK, 5.2 UK, Class: Moderate, Intensity: VI - VII) earthquake occurred 112.7 miles away from the city center On 11/30/1973 at 07:48:41, a magnitude 4.7 (4.7 MB, 4.6 ML, Class: Light, Intensity: IV - V) earthquake occurred 55.0 miles away from Jellico center On 8/9/2020 at 12:07:37, a magnitude 5.1 (5.1 MW, Depth: 4.7 mi) earthquake occurred 169.0 miles away from Jellico center On 4/18/2008 at 09:36:59, a magnitude 5.4 (5.1 MB, 4.8 MS, 5.4 MW, 5.2 MW) earthquake occurred 243.2 miles away from Jellico center On 4/29/2003 at 08:59:39, a magnitude 4.9 (4.4 MB, 4.6 MW, 4.9 LG) earthquake occurred 167.3 miles away from Jellico center On 9/7/1988 at 02:28:09, a magnitude 4.6 (4.5 MB, 4.6 LG) earthquake occurred 108.8 miles away from the city center Magnitude types: regional Lg-wave magnitude (LG), body-wave magnitude (MB), local magnitude (ML), surface-wave magnitude (MS), moment magnitude (MW) Natural disasters: The number of natural disasters in Campbell County (19) is greater than the US average (15).Major Disasters (Presidential) Declared: 14Emergencies Declared: 2Floods: 14, Storms: 12, Tornadoes: 5, Winter Storms: 4, Winds: 3, Flash Flood: 1, Heavy Rain: 1, Hurricane: 1, Ice Storm: 1, Landslide: 1, Mudslide: 1, Snowfall: 1, Other: 1 (Note: some incidents may be assigned to more than one category). Hospitals and medical centers in Jellico: JELLICO COMMUNITY HOSPITAL (Voluntary non-profit - Church, provides emergency services, 188 HOSPITAL LANE) SUNBELT HOMECARE (149 HEALTH CARE LANE)
BEECH TREE MANOR (240 HOSPITAL LANE, PO BOX 300)
Heliports located in Jellico: Colleges/universities with over 2000 students nearest to Jellico:
University of the Cumberlands (about 11 miles; Williamsburg, KY ; Full-time enrollment: 3,585)
Lincoln Memorial University (about 27 miles; Harrogate, TN ; FT enrollment: 3,706)
Somerset Community College (about 43 miles; Somerset, KY ; FT enrollment: 4,698)
Pellissippi State Community College (about 44 miles; Knoxville, TN ; FT enrollment: 7,271)
The University of Tennessee-Knoxville (about 45 miles; Knoxville, TN ; FT enrollment: 25,483)
Walters State Community College (about 55 miles; Morristown, TN ; FT enrollment: 4,359)
Roane State Community College (about 56 miles; Harriman, TN ; FT enrollment: 4,302)
Public high schools in Jellico: JELLICO HIGH SCHOOL Students: 345, Location: 141 HIGH SCHOOL LA, Grades: 9-12)JELLICO LEARNING ACADEMY Location: 141 HIGH SCHOOL RD, Grades: 6-12)
Public elementary/middle school in Jellico: JELLICO ELEMENTARY Location: 551 SUNSET TR, Grades: PK-8)
Private elementary/middle school in Jellico:
See full list of schools located in Jellico Library in Jellico: JELLICO PUBLIC LIBRARY Operating income: $48,714; Location: 104 NORTH MAIN STREET; 12,313 books ; 218 audio materials ; 750 video materials ; 32 state licensed databases ; 52 print serial subscriptions )
User-submitted facts and corrections:
The Church of God of the Mountain Assembly is not listed in the church category. It is the founding headquarters for this church group and is huge to the community. You also need to include the Douglas Cemetary that is up on the hill behind the Exxon by the interstate.
Notable locations in Jellico: (A) , Oswego Industrial Park (B) , Jellico Fire Department (C) , Jellico Life Saving and Rescue Squad (D) , North Regional EMS (E) . Display/hide their locations on the map
Churches in Jellico include: (A) , Tannery Hollow Missionary Baptist Church (B) , Jellico United Methodist Church (C) , Jellico Church of God (D) , First Baptist Church (E) , Crouches Creek Baptist Church (F) , Oswego Missionary Baptist Church (G) . Display/hide their locations on the map
Cemeteries: (1) , Crouches Creek Cemetery (2) . Display/hide their locations on the map
Streams, rivers, and creeks: (A) , Archer Branch (B) . Display/hide their locations on the map
Park in Jellico: (1) . Display/hide its location on the map
Hotels:
Courts:
Birthplace of: Larry Douglas (baseball) - Baseball player.
Campbell County has a predicted average indoor radon screening level less than 2 pCi/L (pico curies per liter) - Low Potential Drinking water stations with addresses in Jellico and their reported violations in the past:
JELLICO WATER DEPT (Population served: 4,726, Surface water):
Past health violations:
MCL, Average - Between OCT-2011 and DEC-2011, Contaminant: Total Haloacetic Acids (HAA5). Follow-up actions: St Public Notif requested (JAN-23-2012), St Violation/Reminder Notice (JAN-23-2012), St Compliance achieved (FEB-16-2012), St Public Notif received (MAR-01-2012)
MCL, Average - Between JUL-2011 and SEP-2011, Contaminant: Total Haloacetic Acids (HAA5). Follow-up actions: St Public Notif requested (NOV-02-2011), St Violation/Reminder Notice (NOV-02-2011), St Public Notif received (NOV-23-2011), St Compliance achieved (FEB-16-2012)
Past monitoring violations:
Monitoring of Treatment (SWTR-Filter) - In AUG-2011. Follow-up actions: St Violation/Reminder Notice (NOV-26-2012)
Monitoring of Treatment (SWTR-Filter) - In JUL-2011. Follow-up actions: St Violation/Reminder Notice (NOV-26-2012)
Failure Submit IDSE/Subpart V Plan Rpt - In JUL-01-2010, Contaminant: DBP STAGE 2. Follow-up actions: St Violation/Reminder Notice (OCT-08-2010), St Public Notif requested (OCT-08-2010), St Compliance achieved (APR-07-2011)
Monitoring, Routine (IDSE) - Between JUL-2009 and SEP-2009, Contaminant: TTHM. Follow-up actions: St Compliance achieved (DEC-31-2009), St Public Notif received (JUN-17-2010), St Public Notif requested (JUL-27-2010), St Violation/Reminder Notice (JUL-27-2010)
Monitoring, Routine (IDSE) - Between JUL-2009 and SEP-2009, Contaminant: Total Haloacetic Acids (HAA5). Follow-up actions: St Compliance achieved (DEC-31-2009), St Public Notif received (JUN-17-2010), St Public Notif requested (JUL-27-2010), St Violation/Reminder Notice (JUL-27-2010)
4 other older monitoring violations
Average household size: This city:
2.2 peopleTennessee:
2.5 people
Percentage of family households: This city:
58.4%Whole state:
67.3%
Percentage of households with unmarried partners: This city:
3.8%Whole state:
5.8%
Likely homosexual households (counted as self-reported same-sex unmarried-partner households)
Lesbian couples: 0.1% of all households Gay men: 0.0% of all households
92 people in nursing facilities/skilled-nursing facilities in 2010people in nursing homes in 2000
Banks with branches in Jellico (2011 data):
Union Bank: at 1075 Fifth Street, branch established on 1918/01/01. Info updated 2010/01/15: Bank assets: $62.8 mil, Deposits: $54.2 mil, local headquarters , positive income , Commercial Lending Specialization, 1 total offices
First State Financial, Inc.: Jellico Branch at 992 Fifth Street, branch established on 2003/12/17. Info updated 2010/03/30: Bank assets: $402.8 mil, Deposits: $350.5 mil, headquarters in Pineville, KY, positive income , Commercial Lending Specialization, 11 total offices , Holding Company: First State Bancshares, Inc.
First Volunteer Bank of Tennessee: Jellico Branch at 189 Fifth Street, branch established on 1905/03/28. Info updated 2008/10/30: Bank assets: $641.6 mil, Deposits: $561.9 mil, headquarters in Chattanooga, TN, positive income , Commercial Lending Specialization, 23 total offices , Holding Company: First Volunteer Corporation
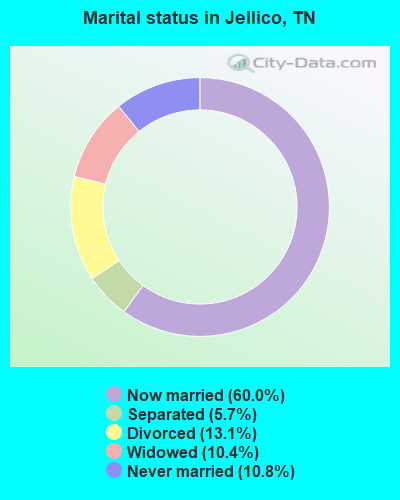
For population 15 years and over in Jellico:
Never married: 10.8%Now married: 60.0%Separated: 5.7%Widowed: 10.4%Divorced: 13.1% For population 25 years and over in Jellico:
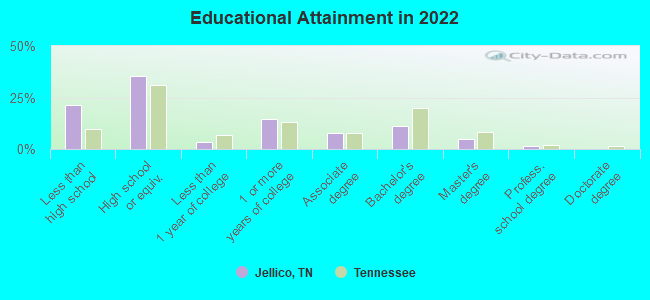
High school or higher: 75.5%Bachelor's degree or higher: 16.4%Graduate or professional degree: 6.1%Unemployed: 4.4%Mean travel time to work (commute): 23.7 minutes
Education Gini index (Inequality in education) Here:
13.0Tennessee average:
11.4
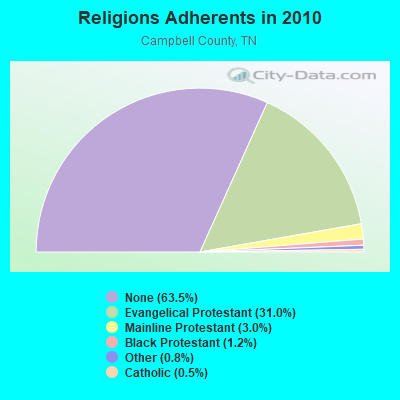
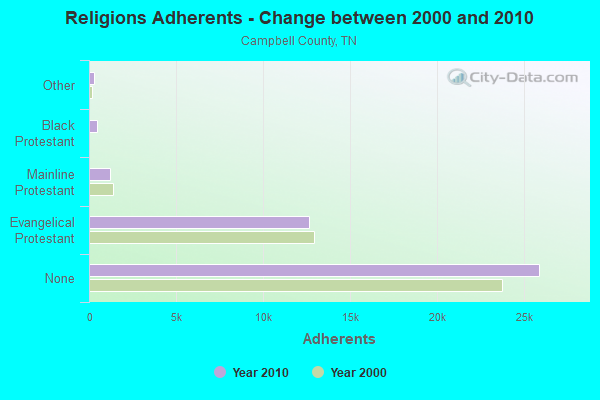
Religion statistics for Jellico, TN (based on Campbell County data)
Religion Adherents Congregations Evangelical Protestant 12,641 56 Mainline Protestant 1,231 9 Black Protestant 481 3 Other 311 3 Catholic 190 1 None 25,862 -
Source: Clifford Grammich, Kirk Hadaway, Richard Houseal, Dale E.Jones, Alexei Krindatch, Richie Stanley and Richard H.Taylor. 2012. 2010 U.S.Religion Census: Religious Congregations & Membership Study. Association of Statisticians of American Religious Bodies. Jones, Dale E., et al. 2002. Congregations and Membership in the United States 2000. Nashville, TN: Glenmary Research Center. Graphs represent county-level data
Food Environment Statistics: Number of grocery stores : 10This county :
2.46 / 10,000 pop.State :
1.99 / 10,000 pop.
Number of supercenters and club stores : 1Here :
0.25 / 10,000 pop.Tennessee :
0.17 / 10,000 pop.
Number of convenience stores (no gas) : 1Here :
0.25 / 10,000 pop.Tennessee :
0.65 / 10,000 pop.
Number of convenience stores (with gas) : 28Here :
6.88 / 10,000 pop.Tennessee :
5.16 / 10,000 pop.
Number of full-service restaurants : 14Campbell County :
3.44 / 10,000 pop.Tennessee :
6.56 / 10,000 pop.
Adult diabetes rate : Here :
13.3%Tennessee :
11.4%
Adult obesity rate : Campbell County :
30.7%Tennessee :
30.2%
Low-income preschool obesity rate : Here :
15.7%Tennessee :
13.5%
Health and Nutrition:
Average overall health of teeth and gums : This city:
51.6%Tennessee:
46.1%
People feeling badly about themselves : Jellico:
19.6%Tennessee:
21.0%
People not drinking alcohol at all : Average hours sleeping at night : Overweight people : Jellico:
40.9%Tennessee:
33.9%
General health condition : This city:
57.5%Tennessee:
55.9%
Average condition of hearing : Jellico:
79.7%Tennessee:
79.1%
More about Health and Nutrition of Jellico, TN Residents
Local government employment and payroll (March 2022)
Function
Full-time employees
Monthly full-time payroll
Average yearly full-time wage
Part-time employees
Monthly part-time payroll
Financial Administration
26 $66,783 $30,823 7 $950 Police Protection - Officers
6 $18,600 $37,200 0 $0 Streets and Highways
4 $10,274 $30,822 0 $0 Firefighters
4 $10,407 $31,221 9 $180 Local Libraries
2 $5,204 $31,224 0 $0 Judicial and Legal
1 $2,768 $33,216 1 $1,000 Solid Waste Management
0 $0 3 $1,766
Totals for Government
43 $114,036 $31,824 20 $3,896
Jellico government finances - Expenditure in 2017 (per resident):
Construction - Water Utilities: $503,000 ($239.18)
Sewerage: $464,000 ($220.64)Electric Utilities: $334,000 ($158.82)Current Operations - Electric Utilities: $8,456,000 ($4020.92)
Sewerage: $694,000 ($330.00)Water Utilities: $656,000 ($311.94)Police Protection: $621,000 ($295.29)General - Other: $353,000 ($167.86)Regular Highways: $274,000 ($130.29)Local Fire Protection: $219,000 ($104.14)Solid Waste Management: $184,000 ($87.49)Financial Administration: $129,000 ($61.34)Parks and Recreation: $84,000 ($39.94)Judicial and Legal Services: $84,000 ($39.94)General Public Buildings: $74,000 ($35.19)Libraries: $66,000 ($31.38)Housing and Community Development: $61,000 ($29.01)Parking Facilities: $41,000 ($19.50)Central Staff Services: $26,000 ($12.36)Protective Inspection and Regulation - Other: $6,000 ($2.85)General - Interest on Debt: $8,000 ($3.80)
Water Utilities - Interest on Debt: $81,000 ($38.52)
Jellico government finances - Revenue in 2017 (per resident):
Charges - Sewerage: $866,000 ($411.79)
Solid Waste Management: $178,000 ($84.64)Other: $23,000 ($10.94)Local Intergovernmental - General Local Government Support: $127,000 ($60.39)
Miscellaneous - Fines and Forfeits: $110,000 ($52.31)
General Revenue - Other: $94,000 ($44.70)Rents: $60,000 ($28.53)Sale of Property: $51,000 ($24.25)Donations From Private Sources: $47,000 ($22.35)Interest Earnings: $28,000 ($13.31)Revenue - Electric Utilities: $9,171,000 ($4360.91)
Water Utilities: $937,000 ($445.55)State Intergovernmental - Water Utilities: $537,000 ($255.35)
General Local Government Support: $224,000 ($106.51)Highways: $71,000 ($33.76)Electric Utilities: $2,000 ($0.95)Tax - Alcoholic Beverage Sales: $612,000 ($291.01)
Property: $587,000 ($279.13)Other Selective Sales: $52,000 ($24.73)Occupation and Business License - Other: $50,000 ($23.78)Alcoholic Beverage License: $28,000 ($13.31)Public Utilities Sales: $27,000 ($12.84)
Jellico government finances - Debt in 2017 (per resident):
Long Term Debt - Beginning Outstanding - Unspecified Public Purpose: $4,128,000 ($1962.91)
Outstanding Unspecified Public Purpose: $3,901,000 ($1854.97)Retired Unspecified Public Purpose: $227,000 ($107.94)
Jellico government finances - Cash and Securities in 2017 (per resident):
Other Funds - Cash and Securities: $2,981,000 ($1417.50)
Businesses in Jellico, TN
Name Count Name Count
Arby's 1 Subway 1 Days Inn 1 U-Haul 1 Hardee's 1 Wendy's 1 Rite Aid 1
Strongest AM radio stations in Jellico:
WJJT (1540 AM; 1 kW; JELLICO, TN; Owner: DOUGLAS BROADCASTING CORPORATION)
WKVL (850 AM; daytime; 50 kW; KNOXVILLE, TN; Owner: HORNE RADIO, LLC)
WEKC (710 AM; daytime; 4 kW; WILLIAMSBURG, KY; Owner: GERALD PARKS)
WEZJ (1440 AM; 2 kW; WILLIAMSBURG, KY; Owner: WHITLEY BROADCASTING CO., INC.)
WMIK (560 AM; 2 kW; MIDDLESBORO, KY; Owner: GATEWAY BROADCASTING, INC.)
WQBB (1040 AM; daytime; 10 kW; POWELL, TN; Owner: JOURNAL BROADCAST CORPORATION)
WNOX (990 AM; 10 kW; KNOXVILLE, TN)
WKDP (1330 AM; 5 kW; CORBIN, KY; Owner: EUBANKS BROADCASTING, INC.)
WVLZ (1180 AM; daytime; 10 kW; KNOXVILLE, TN; Owner: KIRKLAND WIRELESS BROADCASTERS, INC.)
WRJZ (620 AM; 5 kW; KNOXVILLE, TN; Owner: TENNESSEE MEDIA ASSOCIATES, INC)
WLAF (1450 AM; 1 kW; LA FOLLETTE, TN; Owner: CAMPBELL COUNTY B/CING. CORP.)
WFGW (1010 AM; 50 kW; BLACK MOUNTAIN, NC; Owner: BLUE RIDGE BROADCASTING CORP.)
WWAM (820 AM; daytime; 50 kW; JASPER, TN; Owner: SHELTON BROADCASTING SYSTEM)
Strongest FM radio stations in Jellico:
WEKX (102.7 FM; JELLICO, TN; Owner: WHITLEY BROADCASTING CO., INC.)
WMIK-FM (92.7 FM; MIDDLESBORO, KY; Owner: GATEWAY BROADCASTING, INC.)
WEZJ-FM (104.3 FM; WILLIAMSBURG, KY; Owner: WHITLEY BROADCASTING CO., INC.)
WDVX (89.9 FM; CLINTON, TN; Owner: CUMBERLAND COMMUNITIES COMMUNI CORP.)
WIMZ-FM (103.5 FM; KNOXVILLE, TN; Owner: SOUTH CENTRAL COMM., CORP.)
WOKI-FM (100.3 FM; OAK RIDGE, TN; Owner: OAK RIDGE FM, INC.)
WQLA-FM (104.9 FM; LA FOLLETTE, TN; Owner: LAFOLLETTE BROADCASTERS, INC.)
WCTU (105.9 FM; TAZEWELL, TN; Owner: STAIR COMPANY, INC)
WUOT (91.9 FM; KNOXVILLE, TN; Owner: UNIVERSITY OF TENNESSEE)
WRIL (106.3 FM; PINEVILLE, KY; Owner: PINE HILLS BROADCASTING, INC.)
WJXB-FM (97.5 FM; KNOXVILLE, TN; Owner: SOUTH CENTRAL COMMUNICATIONS CORP.)
WIVK-FM (107.7 FM; KNOXVILLE, TN; Owner: CITADEL BROADCASTING COMPANY)
WKDP-FM (99.5 FM; CORBIN, KY; Owner: EUBANKS BROADCASTING, INC.)
WWST (102.1 FM; SEVIERVILLE, TN; Owner: JOURNAL BROADCAST CORPORATION)
WCTT-FM (107.3 FM; CORBIN, KY; Owner: ENCORE COMMUNICATIONS, INC.)
WYLV (89.1 FM; ALCOA, TN; Owner: FOOTHILLS BROADCASTING, INC.)
WRMX-FM (106.7 FM; NORRIS, TN; Owner: SOUTH CENTRAL COMMUNICATIONS CORPORATION)
WECO-FM (101.3 FM; WARTBURG, TN; Owner: MORGAN COUNTY BROADCASTING CO., INC.)
WYFC (95.3 FM; CLINTON, TN; Owner: BIBLE BROADCASTING NETWORK, INC.)
WHAY (105.9 FM; WHITLEY CITY, KY; Owner: TIM LAVENDER)
TV broadcast stations around Jellico:
WPXK (Channel 54; JELLICO, TN; Owner: PAXSON KNOXVILLE LICENSE, INC.)
WKOP-TV (Channel 15; KNOXVILLE, TN; Owner: EAST TENNESSEE PUBLIC COMMUNICATIONS CORP.)
WVLT-TV (Channel 8; KNOXVILLE, TN; Owner: WVLT LICENSEE CORP.)
WBIR-TV (Channel 10; KNOXVILLE, TN; Owner: GANNETT PACIFIC CORPORATION)
WATE-TV (Channel 6; KNOXVILLE, TN; Owner: WATE, G.P.)
WTNZ (Channel 43; KNOXVILLE, TN; Owner: RAYCOM AMERICA, INC.)
WEEE-LP (Channel 32; KNOXVILLE, TN; Owner: TIGER EYE BROADCASTING CORPORATION)
WEZK-LP (Channel 28; KNOXVILLE, TN; Owner: SOUTH CENTRAL COMMUNICATIONS CORP.)
National Bridge Inventory (NBI) Statistics 42 Number of bridges423ft / 129m Total length $12,806,000 Total costs135,733 Total average daily traffic42,362 Total average daily truck traffic
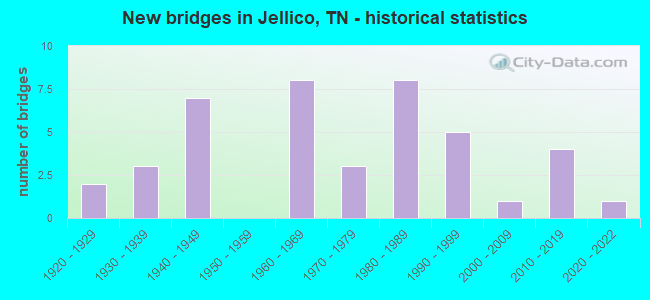
New bridges - historical statistics
2 1920-1929 3 1930-1939 7 1940-1949 8 1960-1969 3 1970-1979 8 1980-1989 5 1990-1999 1 2000-2009 4 2010-2019 1 2020-2022
See full National Bridge Inventory statistics for Jellico, TN
FCC Registered Cell Phone Towers: 2 (
See the full list of FCC Registered Cell Phone Towers in Jellico )
FCC Registered Antenna Towers: 24 (
See the full list of FCC Registered Antenna Towers )
FCC Registered Broadcast Land Mobile Towers: 6
Pine Mountan (Lat: 36.573972 Lon: -84.103250), Call Sign: KUZ950, Licensee ID: L00085455, Assigned Frequencies: 155.370 MHz, Grant Date: 02/10/2000, Expiration Date: 04/03/2005, Cancellation Date: 06/04/2005, Registrant: City Of Jellico, Jellico, TN 37762 2.5 Mi S (Lat: 36.551194 Lon: -84.145750), Call Sign: WDH839, Licensee ID: L00085455, Assigned Frequencies: 460.350 MHz, Grant Date: 12/08/1999, Expiration Date: 04/03/2005, Cancellation Date: 06/04/2005, Registrant: Jellico, Town Of, Jellico, TN 37762, Phone: (423) 784-6351 4371 Hwy 297 (Lat: 36.529250 Lon: -84.199111), Type: Pole, Structure height: 8 m, Call Sign: WPPZ477, Assigned Frequencies: 173.287 MHz, Grant Date: 03/17/2015, Expiration Date: 03/29/2025, Certifier: Woody Swafford, Registrant: Overbay Communications, 122 Rusty Raod, Jacksboro, TN 37757, Phone: (865) 617-2500, Fax: (423) 566-6533, Email:
In Yard 100 Ft S Of State Line (Lat: 36.591194 Lon: -84.126861), Call Sign: KSS890, Licensee ID: L00008014, Assigned Frequencies: 160.245 MHz, 160.950 MHz, Grant Date: 12/18/2003, Expiration Date: 03/16/2014, Cancellation Date: 11/20/2009, Registrant: Norfolk Southern Railway Company, 1200 Peachtree Street, Ne, Box 123, Atlanta, GA 30309, Phone: (404) 582-6224, Fax: (404) 582-6209, Email:
Pine Mountain (Lat: 36.572778 Lon: -84.101944), Type: Building, Structure height: 15 m, Overall height: 19 m, Call Sign: WPSH648, Assigned Frequencies: 462.875 MHz, Grant Date: 04/30/2001, Expiration Date: 04/30/2011, Cancellation Date: 06/10/2004, Certifier: Signature On File, Registrant: National License Corporation, 9050 Briarclift Road, Indianapolis, IN 46256, Phone: (317) 849-5866, Fax: (800) 841-0516 EXISTING WELL 3, 101-1021 Creekmore Housley Dr (Lat: 36.569972 Lon: -84.146694), Type: Pole, Structure height: 9.1 m, Call Sign: WQYF340, Assigned Frequencies: 154.478 MHz, Grant Date: 09/08/2016, Expiration Date: 09/08/2026, Certifier: Joe D Carroll, Registrant: Overbay Communications, 122 Rusty Road, Jacksboro, TN 37757, Phone: (865) 607-2500, Fax: (423) 566-6533, Email:
FCC Registered Microwave Towers: 3
Pine Mtn (Lat: 36.572833 Lon: -84.100194), Overall height: 15.2 m, Call Sign: WMV238, Assigned Frequencies: 488.000 MHz, Grant Date: 11/21/1995, Expiration Date: 08/01/2005, Cancellation Date: 03/24/2003, Phone: (615) 826-0792 1 Huddleston Cemetery Rd (Lat: 36.577278 Lon: -84.106583), Overall height: 15.2 m, Call Sign: WMV239, Licensee ID: L00185542, Assigned Frequencies: 788.000 MHz, Grant Date: 09/27/1994, Expiration Date: 08/01/2005, Cancellation Date: 03/24/2003, Registrant: Paxson Knoxville License, Inc., 601 Clearwater Park Road, West Palm Beach, FL 33401 Elk GAP, Stinking Creek Road (Lat: 36.427583 Lon: -84.302167), Type: Mast, Structure height: 86.9 m, Overall height: 90.8 m, Call Sign: WQGS833, Assigned Frequencies: 6034.15 MHz, Grant Date: 03/07/2017, Expiration Date: 04/09/2027, Cancellation Date: 07/05/2023, Certifier: Gregory M Romano, Registrant: Cellco Partnership, 5055 Northpointe Pkwy, Alpharetta, GA 30022, Phone: (770) 797-1070, Email:
FCC Registered Paging Towers: 1
Highway 25 West And I-75 (Lat: 36.540611 Lon: -84.117139), Overall height: 11.3 m, Call Sign: KNKP574, Assigned Frequencies: 931.737 MHz, Grant Date: 04/19/1999, Expiration Date: 04/01/2009, Cancellation Date: 03/09/2005, Registrant: Piper & Marbury L.L.P., 1200 Nineteenth Street, Nw, Washington, DC 20036, Phone: (202) 861-3913, Fax: (202) 223-2085 FCC Registered Amateur Radio Licenses: 17 (
See the full list of FCC Registered Amateur Radio Licenses in Jellico )
Most common first names in Jellico, TN among deceased individuals Name Count Lived (average)
James 74 72.1 years John 59 75.9 years William 51 73.2 years Mary 44 79.3 years George 41 76.0 years Charles 26 74.0 years Robert 22 72.7 years Joe 20 74.4 years Martha 19 82.1 years Edna 18 76.6 years
Most common last names in Jellico, TN among deceased individuals Last name Count Lived (average)
Douglas 49 72.6 years Bowlin 45 75.9 years Davis 42 75.8 years Lawson 41 74.4 years Perkins 41 78.4 years Smith 33 75.2 years Lay 29 75.0 years Siler 29 75.9 years Baird 28 76.7 years Leach 25 75.4 years
Jellico compared to Tennessee state average:
Median household income below state average. Median house value below state average. Unemployed percentage significantly below state average. Black race population percentage significantly below state average. Hispanic race population percentage significantly below state average. Median age above state average. Foreign-born population percentage significantly below state average. Length of stay since moving in significantly above state average. Institutionalized population percentage above state average. Number of college students significantly below state average.
Top Patent Applicants
Total of 1 patent application in 2008-2024.


 Recent articles from our blog. Our writers, many of them Ph.D. graduates or candidates, create easy-to-read articles on a wide variety of topics.

 (43.5 miles
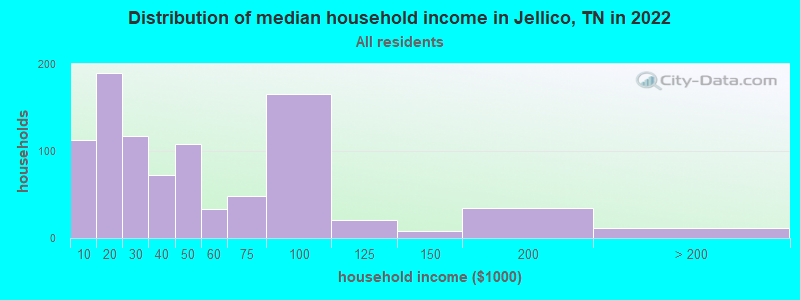


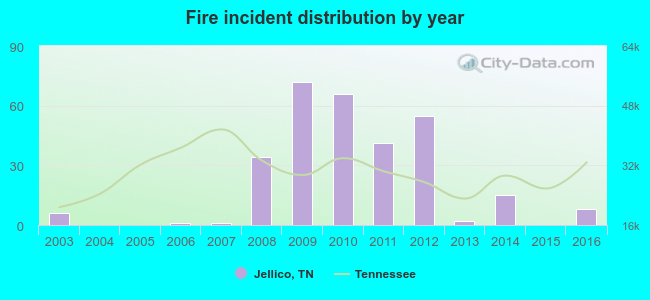 According to the data from the years 2003 - 2016 the average number of fire incidents per year is 22. The highest number of reported fires - 72 took place in 2009, and the least - 0 in 2004. The data has an increasing trend.
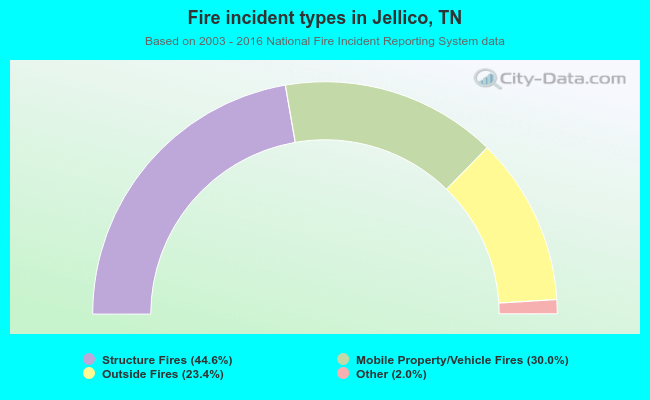 When looking into fire subcategories, the most reports belonged to: Structure Fires (44.6%), and Mobile Property/Vehicle Fires (30.0%).