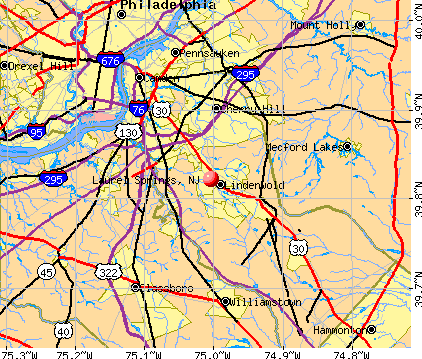
Laurel Springs, New Jersey
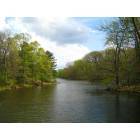
Laurel Springs: laurel lake from the laurel rd. bridge, spring, 2008
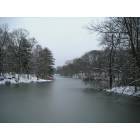
Laurel Springs: laurel lake from the laurel rd. bridge, winter 2007
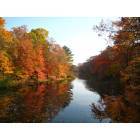
Laurel Springs: laure lake from the laurel rd. bridge,fall 2007
- add
your


Submit your own pictures of this borough and show them to the world
- OSM Map
- General Map
- Google Map
- MSN Map
Population change since 2000: +0.3%
 |
| Males: 967 | |
| Females: 1,009 |
| Median resident age: | 35.9 years |
| New Jersey median age: | 40.4 years |
Zip codes: 08021.
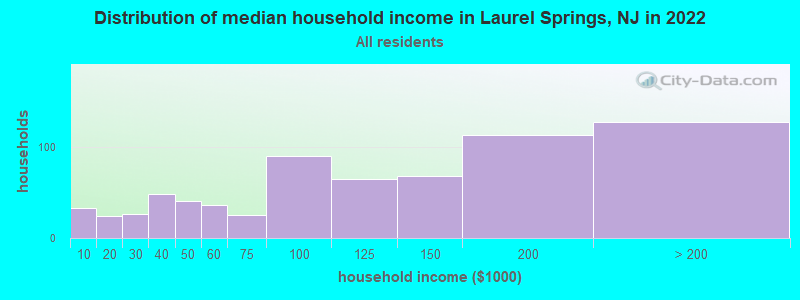
| Laurel Springs: | $113,172 |
| NJ: | $96,346 |
Estimated per capita income in 2022: $42,345 (it was $23,254 in 2000)
Laurel Springs borough income, earnings, and wages data
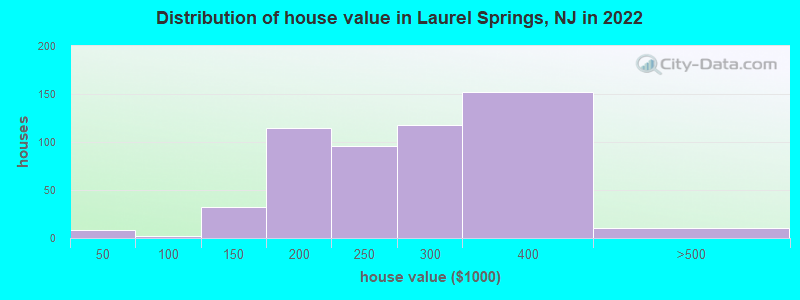
Estimated median house or condo value in 2022: $261,518 (it was $111,100 in 2000)
| Laurel Springs: | $261,518 |
| NJ: | $428,900 |
Mean prices in 2022: all housing units: $301,398; detached houses: $333,075; townhouses or other attached units: $186,015; in 2-unit structures: $226,244; in 3-to-4-unit structures: $276,796; in 5-or-more-unit structures: $162,522; mobile homes: $66,350
Median gross rent in 2022: $965.
Laurel Springs, NJ residents, houses, and apartments details
(4.6% for White Non-Hispanic residents, 12.7% for Black residents, 64.3% for Hispanic or Latino residents, 100.0% for American Indian residents, 100.0% for other race residents)
Detailed information about poverty and poor residents in Laurel Springs, NJ
Compare current foreclosures near Laurel Springs, NJ:
| Photo | Address | Area | Beds / Baths | Price | Details |
|---|---|---|---|---|---|

|
#1
Edwards Ave
Barrington, NJ 08007
|
1,112 sq. feet
|
1 baths 3 beds |
$325,500
|
show details |

|
#2
Watson Blvd
Clementon, NJ 08021
|
1,268 sq. feet
|
1 baths 3 beds |
$289,900
|
show details |

|
#3
Princeton Ave
Philadelphia, PA 19149
|
1,224 sq. feet
|
1 baths 3 beds |
$215,000
|
show details |

|
#4
N Front St Apt B
Philadelphia, PA 19123
|
2,491 sq. feet
|
2 baths 3 beds |
$659,500
|
show details |

|
#5
S 8th St
Philadelphia, PA 19148
|
1,170 sq. feet
|
1 baths 3 beds |
$178,500
|
show details |

|
#6
Jessamine Ave
Oaklyn, NJ 08107
|
864 sq. feet
|
2 baths 5 beds |
$399,900
|
show details |

|
#7
Yeadon Ave
Lansdowne, PA 19050
|
1,388 sq. feet
|
1 baths 3 beds |
$273,000
|
show details |

|
#8
Harvey Ave
Pennsauken, NJ 08110
|
1,555 sq. feet
|
2 baths 4 beds |
$415,000
|
show details |

|
#9
Fries Mill Rd
Franklinville, NJ 08322
|
2,266 sq. feet
|
2 baths 3 beds |
$389,900
|
show details |

|
#10
N 59th St
Philadelphia, PA 19151
|
1,244 sq. feet
|
1 baths 3 beds |
$241,500
|
show details |
| Photo | Address | Area | Beds / Baths | Price | Details |
|---|---|---|---|---|---|

|
#11
Kershaw St
Philadelphia, PA 19131
|
1,284 sq. feet
|
1 baths 3 beds |
$139,900
|
show details |

|
#12
Covered Bridge Rd
Cherry Hill, NJ 08034
|
1,343 sq. feet
|
1 baths 3 beds |
$450,000
|
show details |

|
#13
Christian St
Philadelphia, PA 19146
|
1,612 sq. feet
|
2 baths 5 beds |
$449,900
|
show details |

|
#14
Cooper St
Woodbury, NJ 08096
|
936 sq. feet
|
1 baths 3 beds |
$255,000
|
show details |

|
#15
W Olney Ave
Philadelphia, PA 19120
|
1,782 sq. feet
|
2 baths 4 beds |
$112,500
|
show details |

|
#16
Broadway
Westville, NJ 08093
|
1,548 sq. feet
|
1 baths 3 beds |
$259,900
|
show details |

|
#17
Edgewood Ave
Audubon, NJ 08106
|
1,250 sq. feet
|
1 baths 4 beds |
$375,000
|
show details |

|
#18
W Oakdale Street
Philadelphia, PA 19132
|
1,152 sq. feet
|
2 baths 3 beds |
$108,900
|
show details |

|
#19
Foxglove Dr
Riverside, NJ 08075
|
840 sq. feet
|
1 baths 2 beds |
$113,683
|
show details |

|
#20
Browning Rd
Merchantville, NJ 08109
|
2,376 sq. feet
|
3 baths 5 beds |
$489,900
|
show details |
| Photo | Address | Area | Beds / Baths | Price | Details |
|---|---|---|---|---|---|

|
#21
N Forklanding Rd
Maple Shade, NJ 08052
|
1,450 sq. feet
|
1 baths 3 beds |
$259,900
|
show details |

|
#22
Scattergood St
Philadelphia, PA 19124
|
992 sq. feet
|
1 baths 3 beds |
$65,864
|
show details |

|
#23
N Bambrey St
Philadelphia, PA 19121
|
964 sq. feet
|
1 baths 3 beds |
$107,333
|
show details |

|
#24
E Wishart St
Philadelphia, PA 19134
|
1,064 sq. feet
|
1 baths 3 beds |
$1,290,613
|
show details |

|
#25
W Oakdale St
Philadelphia, PA 19132
|
1,134 sq. feet
|
1 baths 3 beds |
$1,322,645
|
show details |

|
#26
44th St
Pennsauken, NJ 08110
|
- sq. feet
|
1 baths 3 beds |
$94,900
|
show details |

|
#27
N Newkirk St
Philadelphia, PA 19132
|
960 sq. feet
|
1 baths 3 beds |
$1,128,765
|
show details |

|
#28
Leonard St
Philadelphia, PA 19149
|
1,024 sq. feet
|
1 baths 3 beds |
$54,557
|
show details |

|
#29
Cope St
Camden, NJ 08104
|
1,084 sq. feet
|
1 baths 3 beds |
show details | |

|
#30
S 21st St Apt 5
Philadelphia, PA 19103
|
532 sq. feet
|
1 baths 1 beds |
show details |
| Photo | Address | Area | Beds / Baths | Price | Details |
|---|---|---|---|---|---|

|
#31
E Sanger St
Philadelphia, PA 19124
|
1,379 sq. feet
|
1 baths 3 beds |
show details | |

|
#32
Phoebe Pl
Philadelphia, PA 19153
|
1,360 sq. feet
|
1 baths 3 beds |
show details | |

|
#33
Haworth St
Philadelphia, PA 19124
|
1,339 sq. feet
|
2 baths 3 beds |
show details | |

|
#34
N 56th St
Philadelphia, PA 19131
|
1,434 sq. feet
|
1 baths 3 beds |
show details | |

|
#35
Washington Ave
Runnemede, NJ 08078
|
1,008 sq. feet
|
1 baths 2 beds |
show details | |

|
#36
F St
Philadelphia, PA 19134
|
960 sq. feet
|
1 baths 3 beds |
show details | |

|
#37
N Hutchinson St
Philadelphia, PA 19141
|
1,088 sq. feet
|
1 baths 3 beds |
show details | |

|
#38
E Carey St
Philadelphia, PA 19124
|
1,050 sq. feet
|
1 baths 3 beds |
show details | |

|
#39
W Chestnut St
Clayton, NJ 08312
|
1,629 sq. feet
|
2 baths 4 beds |
show details | |

|
#40
Brown St
Lawnside, NJ 08045
|
936 sq. feet
|
1 baths 3 beds |
show details |
| Photo | Address | Area | Beds / Baths | Price | Details |
|---|---|---|---|---|---|

|
#41
N Congress Rd
Camden, NJ 08104
|
1,368 sq. feet
|
1 baths 3 beds |
show details | |

|
#42
E Sanger St
Philadelphia, PA 19124
|
1,186 sq. feet
|
1 baths 3 beds |
show details | |

|
#43
Vista St
Philadelphia, PA 19136
|
1,702 sq. feet
|
2 baths 3 beds |
show details | |

|
#44
Mohawk Dr
Wenonah, NJ 08090
|
2,224 sq. feet
|
3 baths 4 beds |
show details | |

|
#45
Loretto Ave
Philadelphia, PA 19124
|
910 sq. feet
|
1 baths 3 beds |
show details | |

|
#46
N 64th St
Philadelphia, PA 19151
|
2,427 sq. feet
|
3 baths 5 beds |
show details | |

|
#47
Roselyn St
Philadelphia, PA 19120
|
1,200 sq. feet
|
1 baths 3 beds |
show details | |

|
#48
Hirst Ave
Lansdowne, PA 19050
|
1,524 sq. feet
|
1 baths 3 beds |
show details | |

|
#49
Dorel St
Philadelphia, PA 19142
|
1,170 sq. feet
|
1 baths 3 beds |
show details | |

|
Check over 1 million property listings on Foreclosure.com!
|
browse all offers | |||


- 1,70284.6%White alone
- 944.7%Asian alone
- 773.8%Black alone
- 582.9%Hispanic
- 341.7%Two or more races
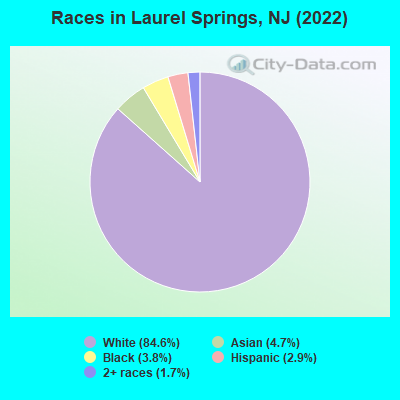
Races in Laurel Springs detailed stats: ancestries, foreign born residents, place of birth
According to our research of New Jersey and other state lists, there was 1 registered sex offender living in Laurel Springs, New Jersey as of May 21, 2024.
The ratio of all residents to sex offenders in Laurel Springs is 1,946 to 1.
The ratio of registered sex offenders to all residents in this city is near the state average.
Type |
2009 |
2010 |
2011 |
2012 |
2013 |
2014 |
2015 |
2016 |
2017 |
2018 |
2019 |
2020 |
2021 |
2022 |
|---|---|---|---|---|---|---|---|---|---|---|---|---|---|---|
| Murders (per 100,000) | 0 (0.0) | 0 (0.0) | 0 (0.0) | 0 (0.0) | 0 (0.0) | 0 (0.0) | 0 (0.0) | 0 (0.0) | 0 (0.0) | 0 (0.0) | 0 (0.0) | 0 (0.0) | 0 (0.0) | 0 (0.0) |
| Rapes (per 100,000) | 0 (0.0) | 1 (52.4) | 0 (0.0) | 0 (0.0) | 0 (0.0) | 0 (0.0) | 0 (0.0) | 0 (0.0) | 0 (0.0) | 0 (0.0) | 0 (0.0) | 0 (0.0) | 0 (0.0) | 0 (0.0) |
| Robberies (per 100,000) | 1 (52.7) | 3 (157.2) | 1 (52.2) | 1 (52.2) | 1 (52.6) | 2 (105.5) | 0 (0.0) | 0 (0.0) | 2 (105.9) | 0 (0.0) | 1 (53.8) | 1 (53.8) | 0 (0.0) | 1 (50.7) |
| Assaults (per 100,000) | 11 (580.2) | 0 (0.0) | 4 (209.0) | 1 (52.2) | 0 (0.0) | 0 (0.0) | 1 (53.5) | 1 (53.5) | 0 (0.0) | 2 (107.8) | 1 (53.8) | 4 (215.1) | 1 (51.7) | 3 (152.2) |
| Burglaries (per 100,000) | 15 (791.1) | 9 (471.7) | 23 (1,202) | 29 (1,514) | 19 (999.5) | 12 (633.2) | 18 (962.6) | 8 (427.8) | 24 (1,271) | 5 (269.4) | 6 (322.6) | 1 (53.8) | 2 (103.4) | 2 (101.5) |
| Thefts (per 100,000) | 40 (2,110) | 38 (1,992) | 31 (1,620) | 44 (2,296) | 24 (1,262) | 20 (1,055) | 33 (1,765) | 35 (1,872) | 19 (1,006) | 16 (862.1) | 12 (645.2) | 11 (591.4) | 13 (671.8) | 12 (608.8) |
| Auto thefts (per 100,000) | 2 (105.5) | 1 (52.4) | 2 (104.5) | 2 (104.4) | 1 (52.6) | 3 (158.3) | 0 (0.0) | 0 (0.0) | 0 (0.0) | 1 (53.9) | 1 (53.8) | 0 (0.0) | 1 (51.7) | 1 (50.7) |
| Arson (per 100,000) | 0 (0.0) | 0 (0.0) | 0 (0.0) | 0 (0.0) | 0 (0.0) | 0 (0.0) | 0 (0.0) | 0 (0.0) | 1 (53.0) | 0 (0.0) | 0 (0.0) | 0 (0.0) | 0 (0.0) | 0 (0.0) |
| City-Data.com crime index | 280.1 | 206.0 | 214.7 | 232.3 | 140.5 | 130.9 | 148.7 | 115.5 | 161.0 | 79.2 | 79.6 | 86.6 | 48.6 | 81.2 |
The City-Data.com crime index weighs serious crimes and violent crimes more heavily. Higher means more crime, U.S. average is 246.1. It adjusts for the number of visitors and daily workers commuting into cities.
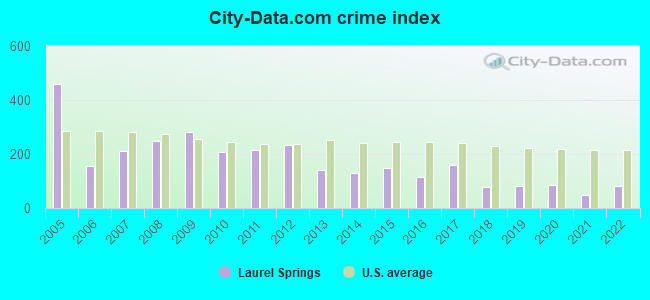
Crime rate in Laurel Springs detailed stats: murders, rapes, robberies, assaults, burglaries, thefts, arson
Full-time law enforcement employees in 2021, including police officers: 7 (7 officers - 7 male; 0 female).
| Officers per 1,000 residents here: | 3.62 |
| New Jersey average: | 5.53 |
 Recent articles from our blog. Our writers, many of them Ph.D. graduates or candidates, create easy-to-read articles on a wide variety of topics.


Latest news from Laurel Springs, NJ collected exclusively by city-data.com from local newspapers, TV, and radio stations
Ancestries: Irish (30.0%), Italian (13.1%), English (7.1%), American (6.9%), German (4.3%), Czechoslovakian (2.9%).
Current Local Time: EST time zone
Elevation: 82 feet
Land area: 0.47 square miles.
Population density: 4,226 people per square mile (average).

107 residents are foreign born (2.3% Asia, 1.9% Europe, 0.7% Latin America).
| This borough: | 5.3% |
| New Jersey: | 23.2% |
Median real estate property taxes paid for housing units with mortgages in 2022: $9,161 (3.1%)
Median real estate property taxes paid for housing units with no mortgage in 2022: $7,833 (3.8%)
Nearest city with pop. 50,000+: Camden, NJ  (9.6 miles , pop. 79,904).
Nearest city with pop. 200,000+: Philadelphia, PA (14.3 miles , pop. 1,517,550).
Nearest cities:
), ), ), ), ), )Latitude: 39.82 N, Longitude: 75.00 W
Area code: 856
| Here: | 4.9% |
| New Jersey: | 4.5% |
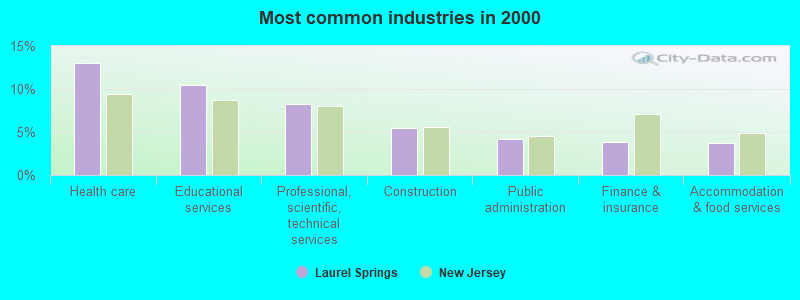
- Health care (13.0%)
- Educational services (10.5%)
- Professional, scientific, technical services (8.3%)
- Construction (5.5%)
- Public administration (4.1%)
- Finance & insurance (3.8%)
- Accommodation & food services (3.7%)
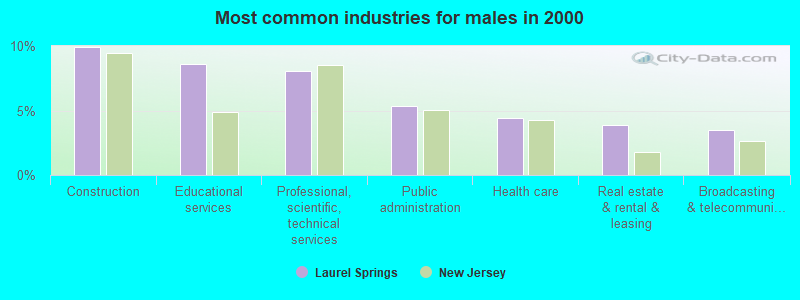
- Construction (9.9%)
- Educational services (8.6%)
- Professional, scientific, technical services (8.1%)
- Public administration (5.3%)
- Health care (4.4%)
- Real estate & rental & leasing (3.9%)
- Broadcasting & telecommunications (3.5%)
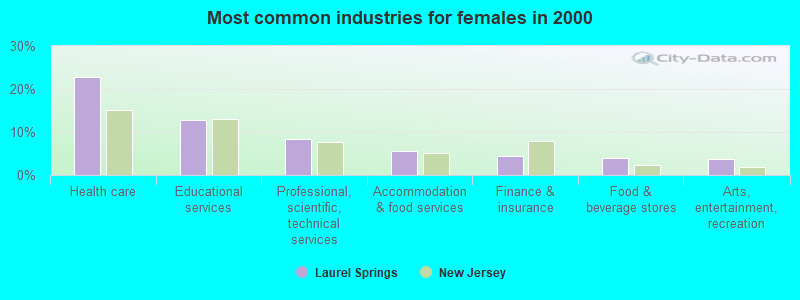
- Health care (22.9%)
- Educational services (12.7%)
- Professional, scientific, technical services (8.5%)
- Accommodation & food services (5.5%)
- Finance & insurance (4.4%)
- Food & beverage stores (4.0%)
- Arts, entertainment, recreation (3.8%)
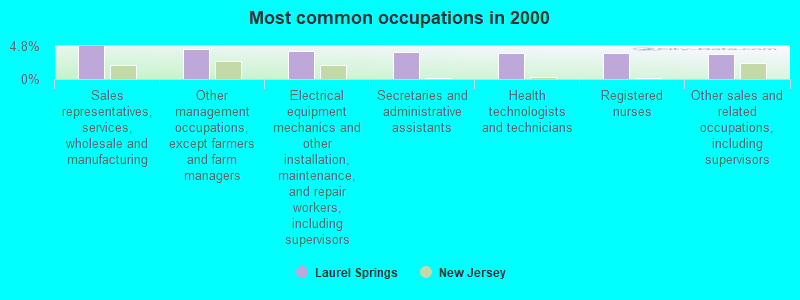
- Sales representatives, services, wholesale and manufacturing (4.8%)
- Other management occupations, except farmers and farm managers (4.4%)
- Electrical equipment mechanics and other installation, maintenance, and repair workers, including supervisors (4.0%)
- Secretaries and administrative assistants (3.9%)
- Health technologists and technicians (3.7%)
- Registered nurses (3.7%)
- Other sales and related occupations, including supervisors (3.6%)
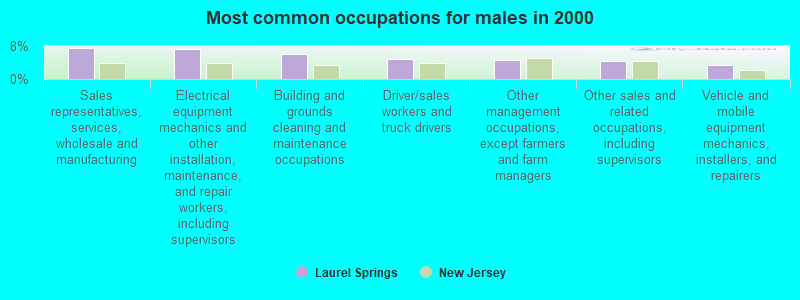
- Sales representatives, services, wholesale and manufacturing (7.5%)
- Electrical equipment mechanics and other installation, maintenance, and repair workers, including supervisors (7.2%)
- Building and grounds cleaning and maintenance occupations (6.1%)
- Driver/sales workers and truck drivers (5.0%)
- Other management occupations, except farmers and farm managers (4.6%)
- Other sales and related occupations, including supervisors (4.4%)
- Vehicle and mobile equipment mechanics, installers, and repairers (3.3%)
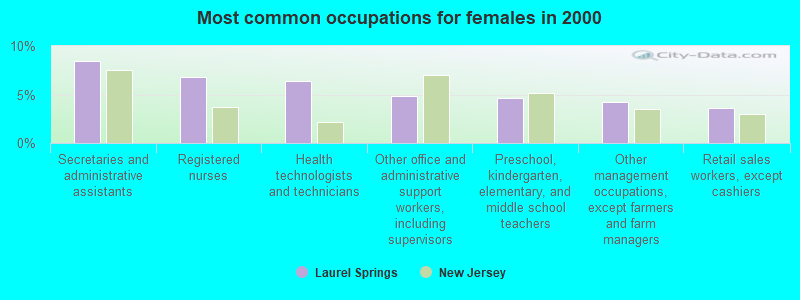
- Secretaries and administrative assistants (8.5%)
- Registered nurses (6.8%)
- Health technologists and technicians (6.4%)
- Other office and administrative support workers, including supervisors (4.9%)
- Preschool, kindergarten, elementary, and middle school teachers (4.7%)
- Other management occupations, except farmers and farm managers (4.2%)
- Retail sales workers, except cashiers (3.6%)
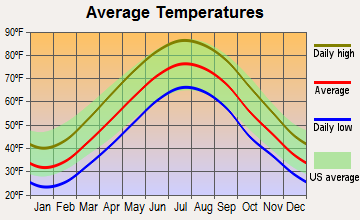
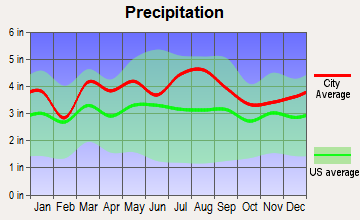
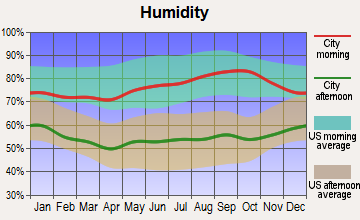
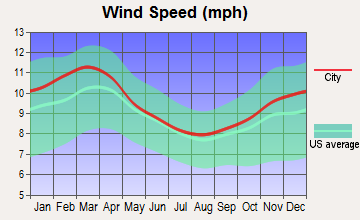
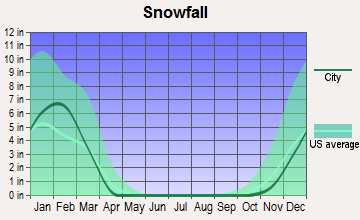
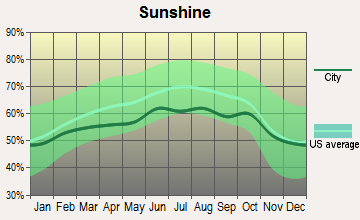
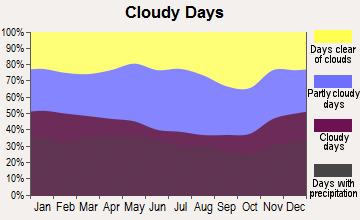
Average climate in Laurel Springs, New Jersey
Based on data reported by over 4,000 weather stations
|
|

(lower is better)
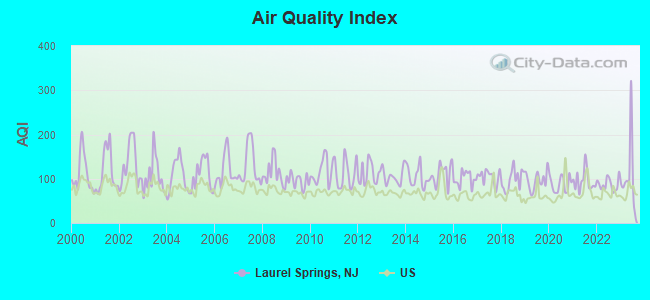
Air Quality Index (AQI) level in 2023 was 109. This is significantly worse than average.
| City: | 109 |
| U.S.: | 73 |
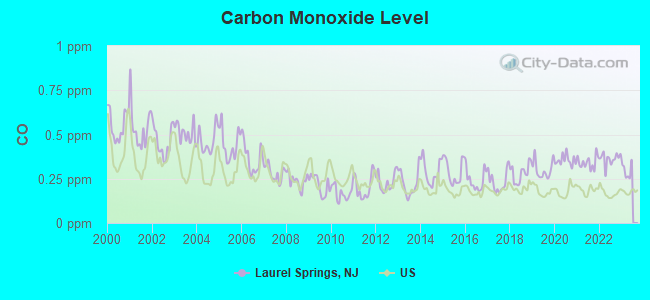
Carbon Monoxide (CO) [ppm] level in 2022 was 0.362. This is significantly worse than average. Closest monitor was 8.6 miles away from the city center.
| City: | 0.362 |
| U.S.: | 0.251 |
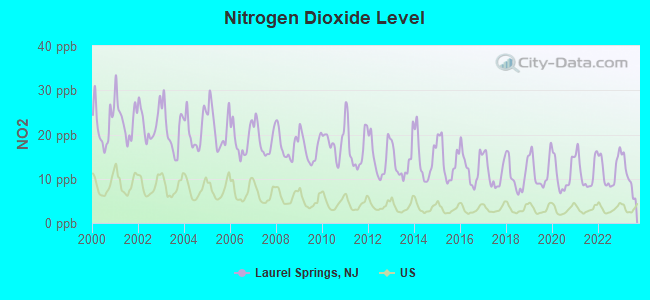
Nitrogen Dioxide (NO2) [ppb] level in 2023 was 10.5. This is significantly worse than average. Closest monitor was 5.9 miles away from the city center.
| City: | 10.5 |
| U.S.: | 5.1 |
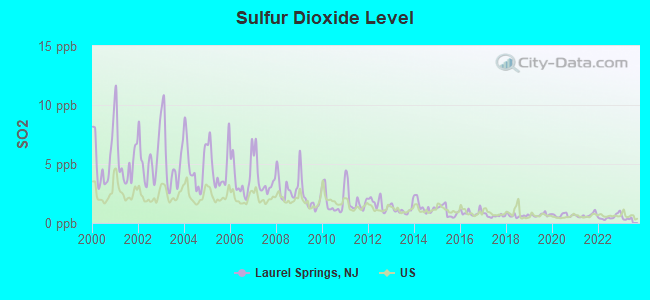
Sulfur Dioxide (SO2) [ppb] level in 2022 was 0.512. This is significantly better than average. Closest monitor was 5.9 miles away from the city center.
| City: | 0.512 |
| U.S.: | 1.515 |
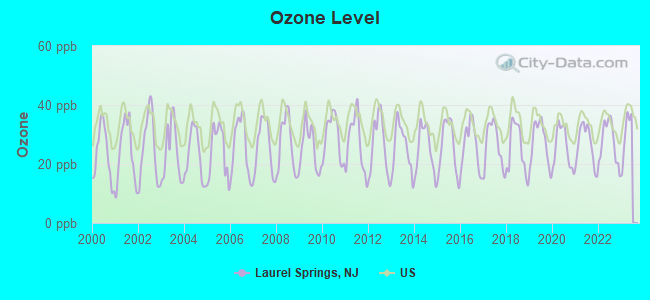
Ozone [ppb] level in 2022 was 27.4. This is better than average. Closest monitor was 9.7 miles away from the city center.
| City: | 27.4 |
| U.S.: | 33.3 |
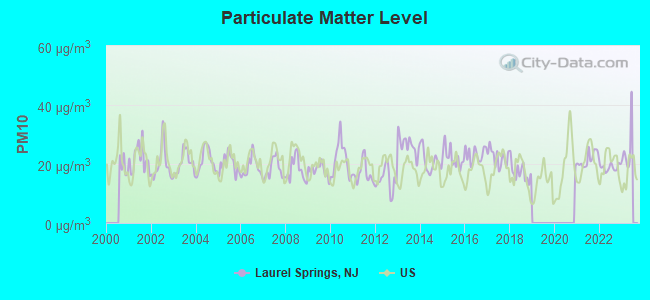
Particulate Matter (PM10) [µg/m3] level in 2022 was 18.9. This is about average. Closest monitor was 8.6 miles away from the city center.
| City: | 18.9 |
| U.S.: | 19.2 |
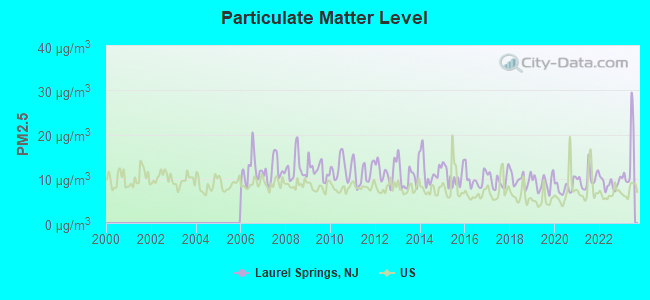
Particulate Matter (PM2.5) [µg/m3] level in 2023 was 14.5. This is significantly worse than average. Closest monitor was 8.6 miles away from the city center.
| City: | 14.5 |
| U.S.: | 8.1 |
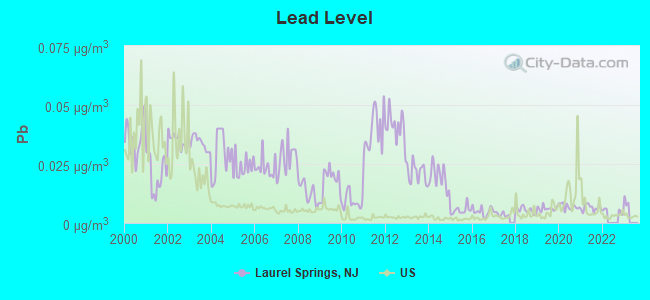
Lead (Pb) [µg/m3] level in 2021 was 0.00650. This is significantly better than average. Closest monitor was 4.0 miles away from the city center.
| City: | 0.00650 |
| U.S.: | 0.00931 |
Tornado activity:
Laurel Springs-area historical tornado activity is slightly above New Jersey state average. It is 15% smaller than the overall U.S. average.
On 3/22/1955, a category F3 (max. wind speeds 158-206 mph) tornado 29.3 miles away from the Laurel Springs borough center killed one person and caused between $50,000 and $500,000 in damages.
On 4/28/1961, a category F3 tornado 31.9 miles away from the borough center caused between $5000 and $50,000 in damages.
Earthquake activity:
Laurel Springs-area historical earthquake activity is significantly above New Jersey state average. It is 66% smaller than the overall U.S. average.On 8/23/2011 at 17:51:04, a magnitude 5.8 (5.8 MW, Depth: 3.7 mi, Class: Moderate, Intensity: VI - VII) earthquake occurred 206.0 miles away from Laurel Springs center
On 1/16/1994 at 01:49:16, a magnitude 4.6 (4.6 MB, 4.6 LG, Depth: 3.1 mi, Class: Light, Intensity: IV - V) earthquake occurred 65.0 miles away from Laurel Springs center
On 1/16/1994 at 00:42:43, a magnitude 4.2 (4.2 MB, 4.0 LG, Depth: 3.1 mi) earthquake occurred 63.5 miles away from the city center
On 11/30/2017 at 21:47:31, a magnitude 4.1 (4.1 MW, Depth: 6.1 mi) earthquake occurred 48.9 miles away from Laurel Springs center
On 10/7/1983 at 10:18:46, a magnitude 5.3 (5.1 MB, 5.3 LG, 5.1 ML) earthquake occurred 287.7 miles away from the city center
On 9/25/1998 at 19:52:52, a magnitude 5.2 (4.8 MB, 4.3 MS, 5.2 LG, 4.5 MW, Depth: 3.1 mi) earthquake occurred 305.5 miles away from Laurel Springs center
Magnitude types: regional Lg-wave magnitude (LG), body-wave magnitude (MB), local magnitude (ML), surface-wave magnitude (MS), moment magnitude (MW)
Natural disasters:
The number of natural disasters in Camden County (21) is greater than the US average (15).Major Disasters (Presidential) Declared: 12
Emergencies Declared: 9
Causes of natural disasters: Hurricanes: 6, Snowstorms: 4, Floods: 3, Storms: 3, Blizzards: 2, Water Shortages: 2, Winter Storms: 2, Heavy Rain: 1, Other: 3 (Note: some incidents may be assigned to more than one category).
Hospitals and medical centers near Laurel Springs:
- KENNEDY UNIVERSITY HOSPITAL - STRATFORD DIV Acute Care Hospitals (about 1 miles away; STRATFORD, NJ)
- KENNEDY TRANSITIONAL STRATFORD (Nursing Home, about 1 miles away; STRATFORD, NJ)
- LAUREL MANOR HEALTHCARE AND REHABILITATION CENTER (Nursing Home, about 1 miles away; STRATFORD, NJ)
- KENNEDY DIALYSIS CENTER VOORHEES (Dialysis Facility, about 2 miles away; VOORHEES, NJ)
- MANORCARE HEALTH SERVICES VOORHEES (Nursing Home, about 2 miles away; VOORHEES, NJ)
- KENNEDY UNIVERSITY HOSPITAL, INC HOME HEALTH CARE (Home Health Center, about 3 miles away; VOORHEES, NJ)
- LIONS GATE (Nursing Home, about 3 miles away; VOORHEES, NJ)
Amtrak stations near Laurel Springs:
- 14 miles: PHILADELPHIA (30TH & MARKET STS.) . Services: ticket office, fully wheelchair accessible, enclosed waiting area, public restrooms, public payphones, snack bar, ATM, paid short-term parking, paid long-term parking, car rental agency, taxi stand, public transit connection.
- 15 miles: NORTH PHILADELPHIA (PHILADELPHIA, 2900 N. BROAD ST.) . Services: ticket office, fully wheelchair accessible, enclosed waiting area, public restrooms, public payphones, paid short-term parking, paid long-term parking, call for taxi service, public transit connection.
- 20 miles: ARDMORE (STATION RD. & LANCASTER AVE.) . Services: enclosed waiting area, public restrooms, public payphones, paid short-term parking, call for car rental service, call for taxi service, public transit connection.
College/University in Laurel Springs:
Colleges/universities with over 2000 students nearest to Laurel Springs:
- Camden County College (about 4 miles; Blackwood, NJ; Full-time enrollment: 9,901)
- Gloucester County College (about 7 miles; Sewell, NJ; FT enrollment: 5,490)
- Rowan University (about 10 miles; Glassboro, NJ; FT enrollment: 10,632)
- Rutgers University-Camden (about 11 miles; Camden, NJ; FT enrollment: 4,949)
- Thomas Jefferson University (about 12 miles; Philadelphia, PA; FT enrollment: 2,139)
- The University of the Arts (about 13 miles; Philadelphia, PA; FT enrollment: 2,198)
- The Art Institute of Philadelphia (about 13 miles; Philadelphia, PA; FT enrollment: 2,432)
Public elementary/middle school in Laurel Springs:
- LAUREL SPRINGS SCHOOL (Students: 181, Location: 623 GRAND AVENUE, Grades: PK-6)
Points of interest:
Notable location: Laurel Springs Fire Department (A). Display/hide its location on the map
Church in Laurel Springs: Saint Pauls Church (A). Display/hide its location on the map
Lake: Laurel Lake (A). Display/hide its location on the map
| This borough: | 2.6 people |
| New Jersey: | 2.7 people |
| This borough: | 69.6% |
| Whole state: | 69.3% |
| This borough: | 5.5% |
| Whole state: | 5.9% |
Likely homosexual households (counted as self-reported same-sex unmarried-partner households)
- Lesbian couples: 0.4% of all households
- Gay men: 0.3% of all households
Banks with branches in Laurel Springs (2011 data):
- Bank of America, National Association: 1345 Chew Landing Road Branch at 1345 Chew Landing Road, branch established on 1970/07/20. Info updated 2009/11/18: Bank assets: $1,451,969.3 mil, Deposits: $1,077,176.8 mil, headquarters in Charlotte, NC, positive income, 5782 total offices, Holding Company: Bank Of America Corporation
For population 15 years and over in Laurel Springs:
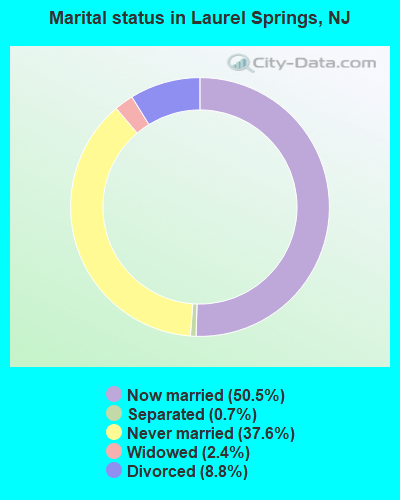
- Never married: 37.6%
- Now married: 50.5%
- Separated: 0.7%
- Widowed: 2.4%
- Divorced: 8.8%
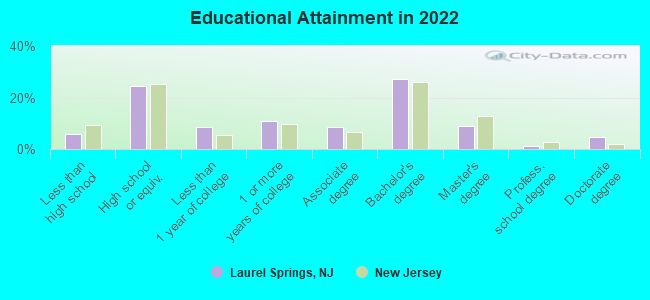
For population 25 years and over in Laurel Springs:
- High school or higher: 94.4%
- Bachelor's degree or higher: 38.8%
- Graduate or professional degree: 12.6%
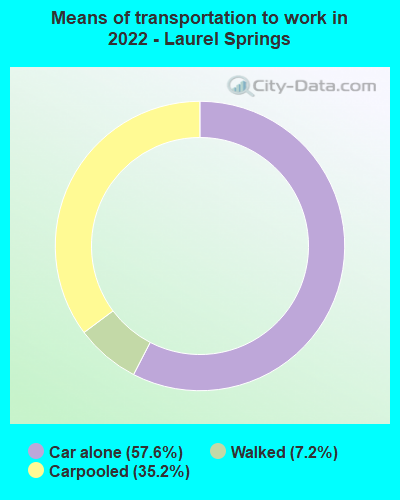
- Unemployed: 4.0%
- Mean travel time to work (commute): 24.6 minutes
| Here: | 12.0 |
| New Jersey average: | 12.8 |
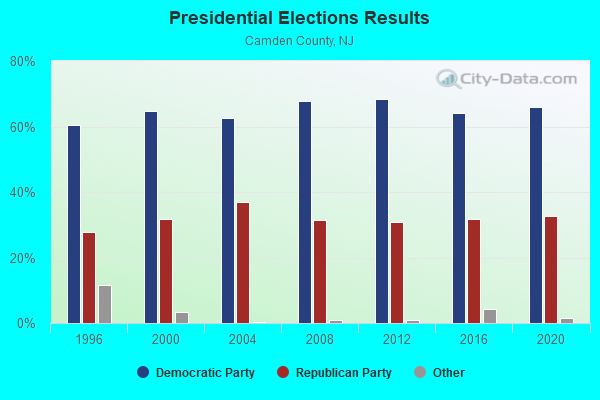
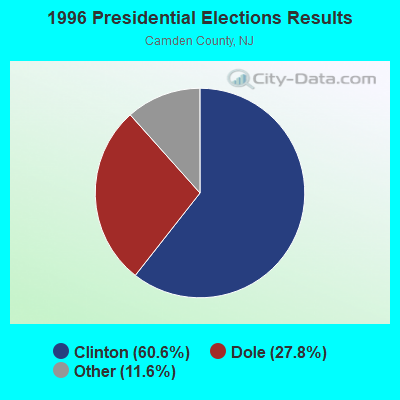
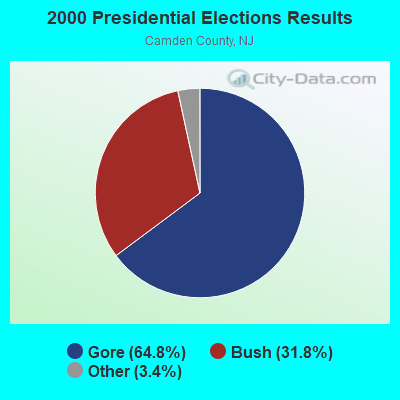
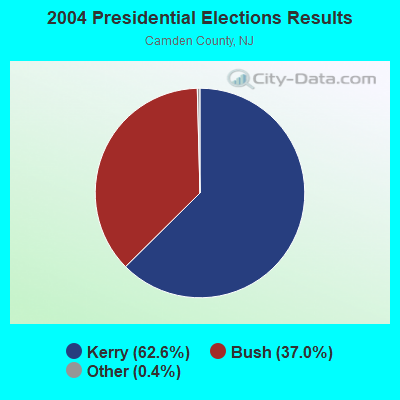
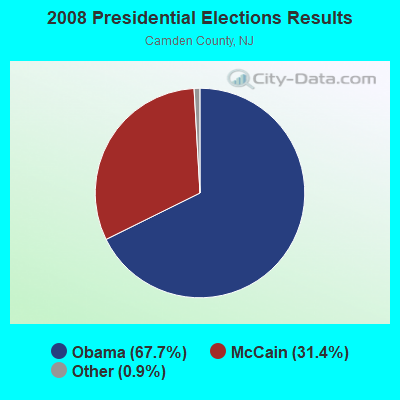

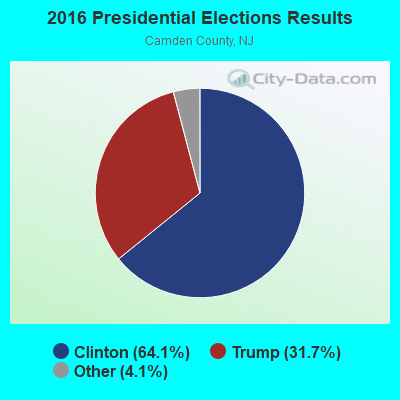
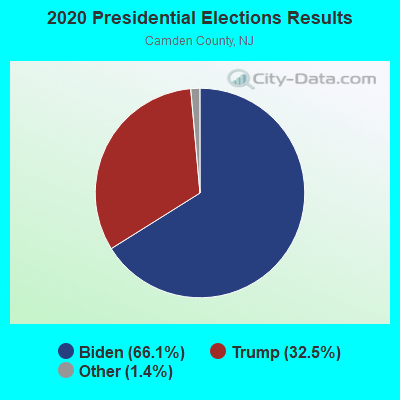
Graphs represent county-level data. Detailed 2008 Election Results
Political contributions by individuals in Laurel Springs, NJ
Religion statistics for Laurel Springs, NJ (based on Camden County data)
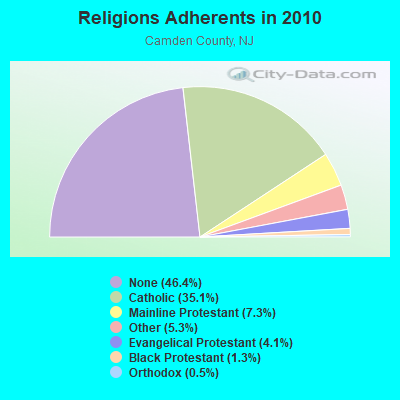
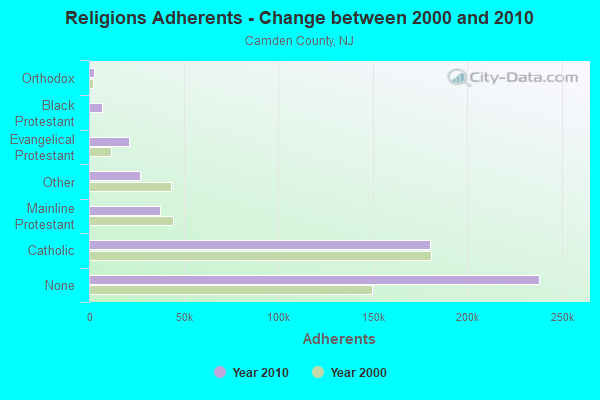
| Religion | Adherents | Congregations |
|---|---|---|
| Catholic | 180,343 | 55 |
| Mainline Protestant | 37,518 | 115 |
| Other | 27,141 | 39 |
| Evangelical Protestant | 21,048 | 130 |
| Black Protestant | 6,925 | 32 |
| Orthodox | 2,500 | 1 |
| None | 238,182 | - |
Food Environment Statistics:
| This county: | 3.00 / 10,000 pop. |
| New Jersey: | 2.90 / 10,000 pop. |
| This county: | 0.04 / 10,000 pop. |
| New Jersey: | 0.06 / 10,000 pop. |
| This county: | 1.86 / 10,000 pop. |
| New Jersey: | 1.76 / 10,000 pop. |
| This county: | 1.02 / 10,000 pop. |
| New Jersey: | 0.81 / 10,000 pop. |
| Here: | 5.20 / 10,000 pop. |
| State: | 7.15 / 10,000 pop. |
| Camden County: | 9.0% |
| New Jersey: | 8.3% |
| Camden County: | 25.8% |
| New Jersey: | 23.3% |
| This county: | 8.6% |
| New Jersey: | 18.0% |
Health and Nutrition:
| Laurel Springs: | 51.8% |
| New Jersey: | 50.6% |
| This city: | 50.1% |
| State: | 48.5% |
| Laurel Springs: | 28.8 |
| New Jersey: | 28.5 |
| Laurel Springs: | 22.0% |
| New Jersey: | 20.0% |
| Laurel Springs: | 10.0% |
| New Jersey: | 11.1% |
| This city: | 6.9 |
| State: | 6.8 |
| Here: | 36.5% |
| State: | 33.6% |
| Laurel Springs: | 58.4% |
| New Jersey: | 56.9% |
| Laurel Springs: | 78.9% |
| New Jersey: | 80.0% |
More about Health and Nutrition of Laurel Springs, NJ Residents
| Local government employment and payroll (March 2022) | |||||
| Function | Full-time employees | Monthly full-time payroll | Average yearly full-time wage | Part-time employees | Monthly part-time payroll |
|---|---|---|---|---|---|
| Police Protection - Officers | 7 | $52,990 | $90,840 | 0 | $0 |
| Other Government Administration | 1 | $6,251 | $75,012 | 3 | $1,373 |
| Financial Administration | 1 | $4,362 | $52,344 | 3 | $6,207 |
| Streets and Highways | 0 | $0 | 5 | $3,882 | |
| Police - Other | 0 | $0 | 4 | $3,463 | |
| Sewerage | 0 | $0 | 1 | $128 | |
| Totals for Government | 9 | $63,603 | $84,804 | 16 | $15,053 |
Laurel Springs government finances - Expenditure in 2017 (per resident):
- Construction - Regular Highways: $576,000 ($291.50)
Local Fire Protection: $47,000 ($23.79)
General - Other: $28,000 ($14.17)
- Current Operations - Police Protection: $668,000 ($338.06)
General - Other: $587,000 ($297.06)
Sewerage: $152,000 ($76.92)
Financial Administration: $151,000 ($76.42)
Regular Highways: $120,000 ($60.73)
Central Staff Services: $108,000 ($54.66)
Judicial and Legal Services: $108,000 ($54.66)
Parks and Recreation: $61,000 ($30.87)
Local Fire Protection: $57,000 ($28.85)
General Public Buildings: $42,000 ($21.26)
Protective Inspection and Regulation - Other: $32,000 ($16.19)
Solid Waste Management: $27,000 ($13.66)
Housing and Community Development: $27,000 ($13.66)
Health - Other: $7,000 ($3.54)
- General - Interest on Debt: $116,000 ($58.70)
- Intergovernmental to Local - Other - Solid Waste Management: $79,000 ($39.98)
Other - Elementary and Secondary Education: $48,000 ($24.29)
- Other Capital Outlay - General - Other: $1,000 ($0.51)
- Total Salaries and Wages: $886,000 ($448.38)
Laurel Springs government finances - Revenue in 2017 (per resident):
- Charges - Sewerage: $130,000 ($65.79)
Solid Waste Management: $10,000 ($5.06)
Other: $1,000 ($0.51)
- Federal Intergovernmental - Housing and Community Development: $23,000 ($11.64)
- Local Intergovernmental - Other: $76,000 ($38.46)
- Miscellaneous - Fines and Forfeits: $77,000 ($38.97)
General Revenue - Other: $9,000 ($4.55)
Interest Earnings: $1,000 ($0.51)
- State Intergovernmental - General Local Government Support: $309,000 ($156.38)
Other: $57,000 ($28.85)
- Tax - Property: $2,387,000 ($1208.00)
Public Utilities Sales: $11,000 ($5.57)
Alcoholic Beverage License: $7,000 ($3.54)
Other License: $2,000 ($1.01)
Laurel Springs government finances - Debt in 2017 (per resident):
- Long Term Debt - Beginning Outstanding - Unspecified Public Purpose: $2,593,000 ($1312.25)
Outstanding Unspecified Public Purpose: $2,353,000 ($1190.79)
Retired Unspecified Public Purpose: $240,000 ($121.46)
Laurel Springs government finances - Cash and Securities in 2017 (per resident):
- Bond Funds - Cash and Securities: $77,000 ($38.97)
- Other Funds - Cash and Securities: $648,000 ($327.94)
6.38% of this county's 2021 resident taxpayers lived in other counties in 2020 ($66,181 average adjusted gross income)
| Here: | 6.38% |
| New Jersey average: | 6.70% |
0.03% of residents moved from foreign countries ($181 average AGI)
Camden County: 0.03% New Jersey average: 0.01%
Top counties from which taxpayers relocated into this county between 2020 and 2021:
| from Burlington County, NJ | |
| from Philadelphia County, PA | |
| from Gloucester County, NJ |
6.36% of this county's 2020 resident taxpayers moved to other counties in 2021 ($78,386 average adjusted gross income)
| Here: | 6.36% |
| New Jersey average: | 7.02% |
0.02% of residents moved to foreign countries ($146 average AGI)
Camden County: 0.02% New Jersey average: 0.02%
Top counties to which taxpayers relocated from this county between 2020 and 2021:
| to Gloucester County, NJ | |
| to Burlington County, NJ | |
| to Philadelphia County, PA |
| Businesses in Laurel Springs, NJ | ||||
| Name | Count | Name | Count | |
|---|---|---|---|---|
| Ace Hardware | 1 | GNC | 1 | |
| Blockbuster | 1 | H&R Block | 1 | |
| FedEx | 3 | Rite Aid | 1 | |
Strongest AM radio stations in Laurel Springs:
- WPHT (1210 AM; 50 kW; PHILADELPHIA, PA; Owner: INFINITY BROADCASTING OPERATIONS, INC.)
- WIP (610 AM; 5 kW; PHILADELPHIA, PA; Owner: INFINITY BROADCASTING CORPORATION OF PHILADELPHIA)
- WPEN (950 AM; 50 kW; PHILADELPHIA, PA; Owner: GREATER PHILADELPHIA RADIO, INC.)
- WVCH (740 AM; 50 kW; CHESTER, PA; Owner: WVCH COMMUNICATIONS, INC.)
- WTMR (800 AM; 5 kW; CAMDEN, NJ; Owner: WTMR LICENSE LIMITED PARTNERSHIP)
- WZZD (990 AM; 50 kW; PHILADELPHIA, PA; Owner: PENNSYLVANIA MEDIA ASSOCIATES, INC.)
- KYW (1060 AM; 50 kW; PHILADELPHIA, PA; Owner: INFINITY BROADCASTING OPERATIONS, INC.)
- WNWR (1540 AM; 50 kW; PHILADELPHIA, PA)
- WWJZ (640 AM; 50 kW; MOUNT HOLLY, NJ; Owner: ABC, INC.)
- WFIL (560 AM; 5 kW; PHILADELPHIA, PA; Owner: PENNSYLVANIA MEDIA ASSOCIATES, INC.)
- WDAS (1480 AM; 5 kW; PHILADELPHIA, PA; Owner: AMFM RADIO LICENSES, L.L.C.)
- WMCA (570 AM; 50 kW; NEW YORK, NY; Owner: SALEM MEDIA OF NEW YORK, LLC)
- WWDB (860 AM; daytime; 10 kW; PHILADELPHIA, PA)
Strongest FM radio stations in Laurel Springs:
- WKDN (106.9 FM; CAMDEN, NJ; Owner: FAMILY STATIONS, INC.)
- WNJS-FM (88.1 FM; BERLIN, NJ; Owner: NEW JERSEY PUBLIC BROADCASTING AUTHORITY)
- WMMR (93.3 FM; PHILADELPHIA, PA; Owner: GREATER BOSTON RADIO, INC.)
- WSJI (89.5 FM; CHERRY HILL, NJ; Owner: BROADCAST LEARNING CENTER, INC.)
- WGLS-FM (89.7 FM; GLASSBORO, NJ; Owner: ROWAN UNIVERSITY)
- WMGK (102.9 FM; PHILADELPHIA, PA; Owner: GREATER PHILADELPHIA RADIO, INC.)
- WMWX (95.7 FM; PHILADELPHIA, PA; Owner: GREATER PHILADELPHIA RADIO, INC.)
- WOGL (98.1 FM; PHILADELPHIA, PA; Owner: INFINITY BROADCASTING OPERATIONS, INC.)
- WBEB (101.1 FM; PHILADELPHIA, PA; Owner: WEAZ-FM RADIO, INC.)
- WRTI (90.1 FM; PHILADELPHIA, PA; Owner: TEMPLE UNIV. OF THE COMMONWEALTH, ET)
- WSNI-FM (104.5 FM; PHILADELPHIA, PA; Owner: AMFM RADIO LICENSES, L.L.C.)
- WPHI-FM (103.9 FM; JENKINTOWN, PA; Owner: RADIO ONE LICENSES, LLC)
- WXTU (92.5 FM; PHILADELPHIA, PA; Owner: WXTU LICENSE LIMITED PARTNERSHIP)
- WHYY-FM (90.9 FM; PHILADELPHIA, PA; Owner: WHYY, INC.)
- WXPN (88.5 FM; PHILADELPHIA, PA; Owner: TRUSTEES OF THE UNIVERSITY OF PENNA.)
- WPTP (96.5 FM; PHILADELPHIA, PA; Owner: WDAS LICENSE LIMITED PARTNERSHIP)
- WDAS-FM (105.3 FM; PHILADELPHIA, PA; Owner: AMFM RADIO LICENSES, L.L.C.)
- WPLY (100.3 FM; MEDIA, PA; Owner: RADIO ONE LICENSES, LLC)
- WYSP (94.1 FM; PHILADELPHIA, PA; Owner: INFINITY BROADCASTING OPERATIONS, INC.)
- WUSL (98.9 FM; PHILADELPHIA, PA; Owner: AMFM RADIO LICENSES, L.L.C.)
TV broadcast stations around Laurel Springs:
- WUVP (Channel 65; VINELAND, NJ; Owner: UNIVISION PHILADELPHIA LLC)
- WNJS (Channel 23; CAMDEN, NJ; Owner: NEW JERSEY PUBLIC BROADCASTING AUTHORITY)
- WWJT-LP (Channel 7; PHILADELPHIA, PA; Owner: PHILADELPHIA TELEVISION NETWORK, INC)
- WPSJ-LP (Channel 8; HAMMONTON, ETC., NJ; Owner: ENGLE BROADCASTING)
- KYW-TV (Channel 3; PHILADELPHIA, PA; Owner: CBS BROADCASTING INC.)
- WPSG (Channel 57; PHILADELPHIA, PA; Owner: VIACOM STATIONS GROUP OF PHILADELPHIA INC.)
- WPHL-TV (Channel 17; PHILADELPHIA, PA; Owner: TRIBUNE TELEVISION COMPANY)
- WPVI-TV (Channel 6; PHILADELPHIA, PA; Owner: ABC, INC.)
- WCAU (Channel 10; PHILADELPHIA, PA; Owner: NBC SUBSIDIARY (WCAU-TV), L.P.)
- WPPX (Channel 61; WILMINGTON, DE; Owner: PAXSON PHILADELPHIA LICENSE, INC.)
- WMCN-TV (Channel 53; ATLANTIC CITY, NJ; Owner: LENFEST BROADCASTING, LLC)
- WGTW (Channel 48; BURLINGTON, NJ; Owner: BRUNSON COMMUNICATIONS, INC.)
- WYBE (Channel 35; PHILADELPHIA, PA; Owner: INDEPENDENCE PUBLIC MEDIA OF PHILADELPHIA, INC.)
- WHYY-TV (Channel 12; WILMINGTON, DE; Owner: WHYY, INC.)
- WTXF-TV (Channel 29; PHILADELPHIA, PA; Owner: FOX TV STATIONS OF PHILADELPHIA)
- WELL-LP (Channel 8; WILLOW GROVE, ETC., PA; Owner: WORD OF GOD FELLOWSHIP, INC.)
- WFPA-CA (Channel 28; PHILADELPHIA, PA; Owner: WXTV LICENSE PARTNERSHIP, G.P.)
- WPHA-LP (Channel 63; PHILADELPHIA, PA; Owner: COMMERCIAL BROADCASTING CORP.)
- WWSI (Channel 62; ATLANTIC CITY, NJ; Owner: HISPANIC BROADCASTERS OF PHILADELPHIA, L.L.C.)
- WNJT (Channel 52; TRENTON, NJ; Owner: NEW JERSEY PUBLIC BROADCASTING AUTHORITY)
- WTSD-CA (Channel 14; WILMINGTON, DE; Owner: PRIORITY COMMUNICATIONS MINISTRIES, INC.)
- W33BT (Channel 33; CAMDEN, NJ; Owner: MEDIACASTING LLC)
- Laurel Springs, New Jersey
- Fatal accident count10
- Vehicles involved in fatal accidents17
- Fatal accidents involving drunk persons:5
- Fatalities10
- Persons involved in fatal accidents21
- Pedestrians involved in fatal accidents1
- New Jersey average
- Fatal accident count7209
- Vehicles involved in fatal accidents10598
- Fatal accidents involving drunk persons2592
- Fatalities7920
- Persons involved in fatal accidents18650
- Pedestrians involved in fatal accidents778
- National Bridge Inventory (NBI) Statistics
- 1Number of bridges
- 16ft / 4.6mTotal length
- $315,000Total costs
- 58,667Total average daily traffic
- 2,933Total average daily truck traffic
- 101,215Total future (year 2040) average daily traffic
FCC Registered Microwave Towers:
3- WPM, 25 Broadway Ave (Lat: 39.824694 Lon: -74.998278), Type: Ltower, Structure height: 48.8 m, Call Sign: WQKK353,
Assigned Frequencies: 10795.0 MHz, 11115.0 MHz, Grant Date: 06/22/2009, Expiration Date: 06/22/2019, Cancellation Date: 08/24/2019, Certifier: Alan Macdonald, Registrant: Telecom Transport Management, Inc., 146 N. Canal Street, Suite 210, Seattle, WA 98103, Phone: (206) 816-6907, Fax: (206) 545-9585, Email:
- PD HQTRS, 1261 Chews Landing Clementon Road (Lat: 39.822333 Lon: -75.041278), Type: Tower, Structure height: 51.8 m, Overall height: 56.6 m, Call Sign: WQOI917,
Assigned Frequencies: 11345.0 MHz, Grant Date: 10/07/2021, Expiration Date: 10/12/2031, Certifier: Chris Jones, Registrant: Wpcs International Incorporated, 1985 Swarthmore Ave, Lakewood, NJ 08701, Phone: (732) 730-9000, Fax: (732) 730-9005, Email:
- LAUREL SPG, 25 Broadway Avenue (Lat: 39.824833 Lon: -74.998500), Overall height: 42.7 m, Call Sign: WHQ559,
Assigned Frequencies: 5945.20 MHz, 5974.85 MHz, 6004.50 MHz, 6034.15 MHz, 6063.80 MHz, 6093.45 MHz, 6123.10 MHz, 6152.75 MHz, Grant Date: 01/03/2001, Expiration Date: 02/01/2011, Cancellation Date: 07/06/2009, Certifier: Karen Zacharia, Registrant: Mci Communications Services, Inc., 2400 N. Glenville Drive, Dept/Loc 71216/107, Richardson, TX 75082, Phone: (972) 729-6406, Fax: (972) 729-2690, Email:
FCC Registered Amateur Radio Licenses:
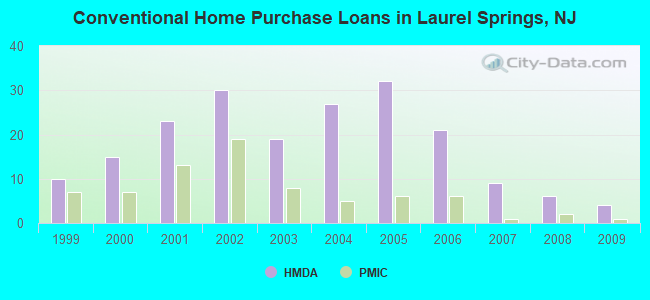
22 (See the full list of FCC Registered Amateur Radio Licenses in Laurel Springs)| Home Mortgage Disclosure Act Aggregated Statistics For Year 2009 (Based on 1 full tract) | ||||||||||
| A) FHA, FSA/RHS & VA Home Purchase Loans | B) Conventional Home Purchase Loans | C) Refinancings | D) Home Improvement Loans | F) Non-occupant Loans on < 5 Family Dwellings (A B C & D) | ||||||
|---|---|---|---|---|---|---|---|---|---|---|
| Number | Average Value | Number | Average Value | Number | Average Value | Number | Average Value | Number | Average Value | |
| LOANS ORIGINATED | 7 | $178,143 | 4 | $142,250 | 53 | $151,434 | 7 | $77,571 | 2 | $113,500 |
| APPLICATIONS APPROVED, NOT ACCEPTED | 1 | $200,000 | 0 | $0 | 6 | $167,333 | 0 | $0 | 0 | $0 |
| APPLICATIONS DENIED | 3 | $162,333 | 1 | $92,000 | 20 | $160,250 | 10 | $31,000 | 3 | $65,000 |
| APPLICATIONS WITHDRAWN | 3 | $218,333 | 0 | $0 | 7 | $210,286 | 0 | $0 | 0 | $0 |
| FILES CLOSED FOR INCOMPLETENESS | 1 | $118,000 | 1 | $64,000 | 1 | $200,000 | 0 | $0 | 0 | $0 |
Detailed HMDA statistics for the following Tracts: 6079.00
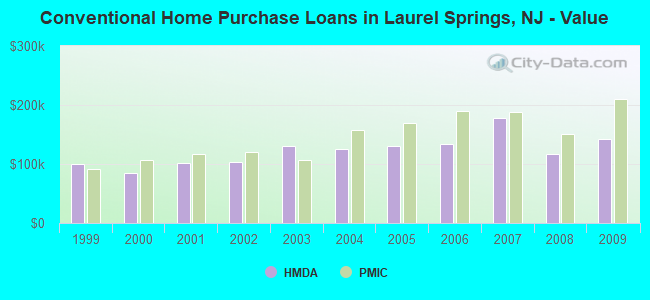
| Private Mortgage Insurance Companies Aggregated Statistics For Year 2009 (Based on 1 full tract) | ||||
| A) Conventional Home Purchase Loans | B) Refinancings | |||
|---|---|---|---|---|
| Number | Average Value | Number | Average Value | |
| LOANS ORIGINATED | 1 | $210,000 | 2 | $173,000 |
| APPLICATIONS APPROVED, NOT ACCEPTED | 0 | $0 | 0 | $0 |
| APPLICATIONS DENIED | 0 | $0 | 0 | $0 |
| APPLICATIONS WITHDRAWN | 0 | $0 | 0 | $0 |
| FILES CLOSED FOR INCOMPLETENESS | 0 | $0 | 0 | $0 |
Detailed PMIC statistics for the following Tracts: 6079.00
2004 - 2018 National Fire Incident Reporting System (NFIRS) incidents
- Fire incident types reported to NFIRS in Laurel Springs, NJ
- 15070.1%Structure Fires
- 3415.9%Outside Fires
- 2210.3%Mobile Property/Vehicle Fires
- 83.7%Other
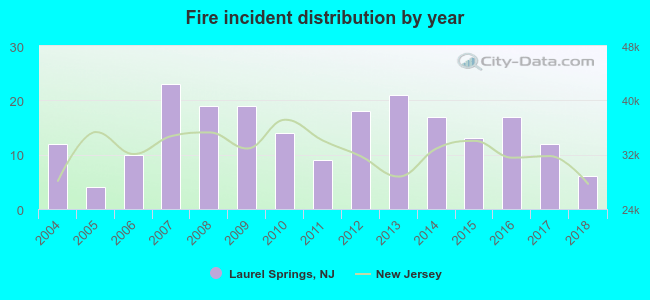 According to the data from the years 2004 - 2018 the average number of fire incidents per year is 14. The highest number of fire incidents - 23 took place in 2007, and the least - 4 in 2005. The data has a dropping trend.
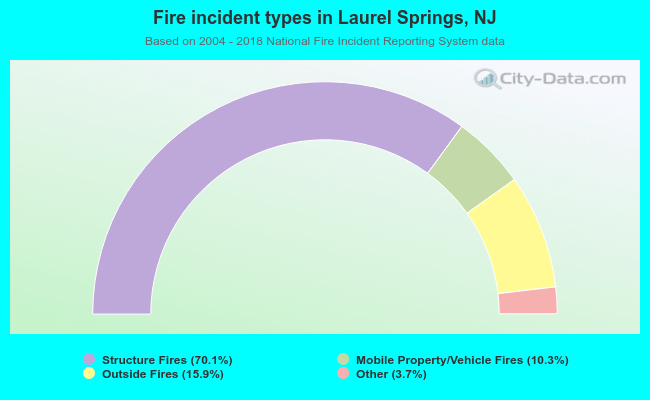 When looking into fire subcategories, the most incidents belonged to: Structure Fires (70.1%), and Outside Fires (15.9%).
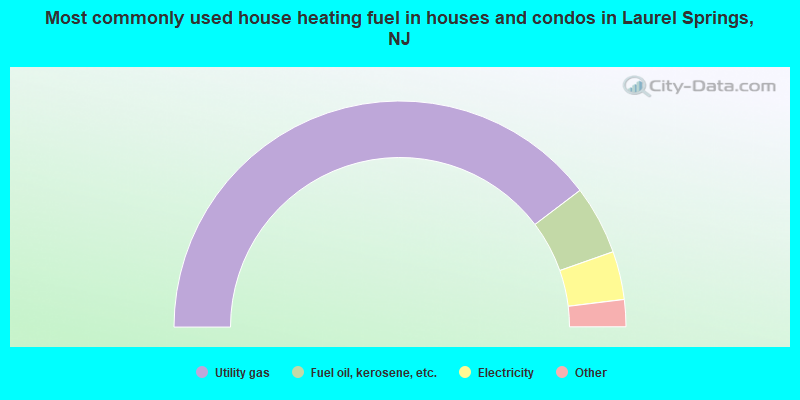
- 79.5%Utility gas
- 9.9%Fuel oil, kerosene, etc.
- 6.9%Electricity
- 2.2%No fuel used
- 1.5%Bottled, tank, or LP gas
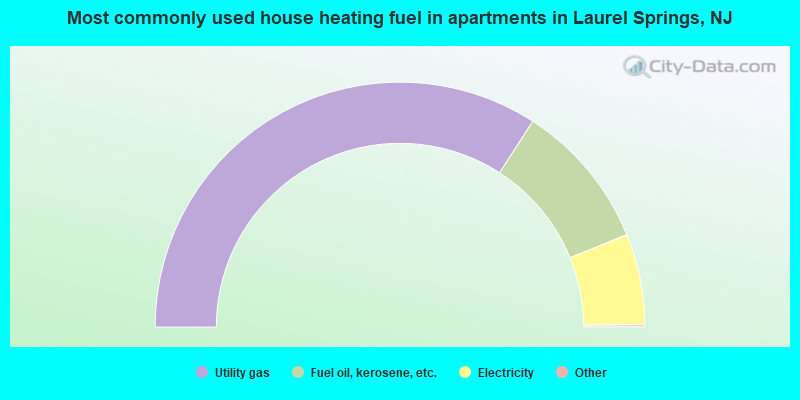
- 68.4%Utility gas
- 19.5%Fuel oil, kerosene, etc.
- 12.0%Electricity
Laurel Springs compared to New Jersey state average:
- Median house value below state average.
- Unemployed percentage significantly below state average.
- Black race population percentage significantly below state average.
- Hispanic race population percentage significantly below state average.
- Foreign-born population percentage significantly below state average.
- Length of stay since moving in significantly above state average.
- House age above state average.

|
|
Total of 6 patent applications in 2008-2024.