Laurel Springs: Fire Incidents, New Jersey (NJ)
Where are fire incidents reported in Laurel Springs, NJ
Something went wrong! Please refresh the page.
|
| |||||||||||||||||||||||||||||||||||||||||||||||||||||||||||||||||||||||||||||||||||||||||||||||||||||||||||||
2004 - 2018 National Fire Incident Reporting System (NFIRS) incidents
- Incident types reported to NFIRS in Laurel Springs, NJ
- 39335.9%Hazardous Condition
- 21419.6%Fire
- 13011.9%Rescue & EMS
- 12811.7%Good Intent Call
- 11410.4%Service Call
- 11010.1%False Alarm
- 30.3%Special Incident
- 20.2%Overpressure Rupture
- Fire incident types reported to NFIRS in Laurel Springs, NJ
- 15070.1%Structure Fires
- 3415.9%Outside Fires
- 2210.3%Mobile Property/Vehicle Fires
- 83.7%Other
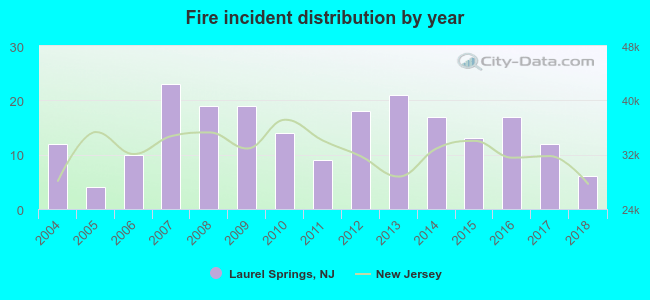 According to the data from the years 2004 - 2018 the average number of fire incidents per year is 14. The highest number of fire incidents - 23 took place in 2007, and the least - 4 in 2005. The data has a decreasing trend.
 33.2% incidents where reported in the morning and 66.8% in the evening. The most fires (19.6%) took place on Saturday, and the least (9.3%) on Monday.
 Based on the 214 incident reports from years 2004 - 2018 most fires (12.1%) took place during January, and the least (4.7%) in April.
 Out of all 1,094 cases reported during the years 2004 - 2018, the most belonged to the categories: Hazardous Condition (35.9%), Fire (19.6%), and Rescue & EMS (11.9%).
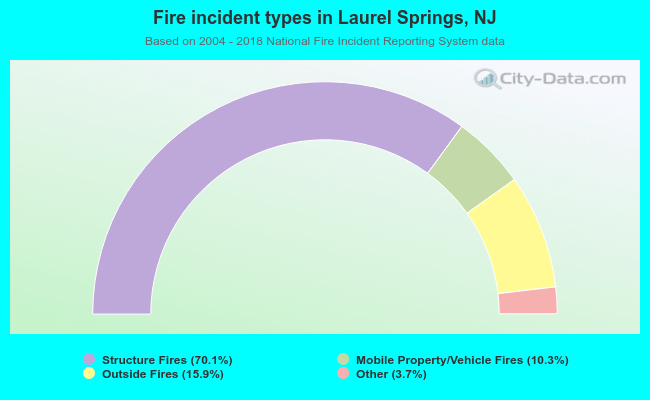 When looking into fire subcategories, the most reports belonged to: Structure Fires (70.1%), and Outside Fires (15.9%).