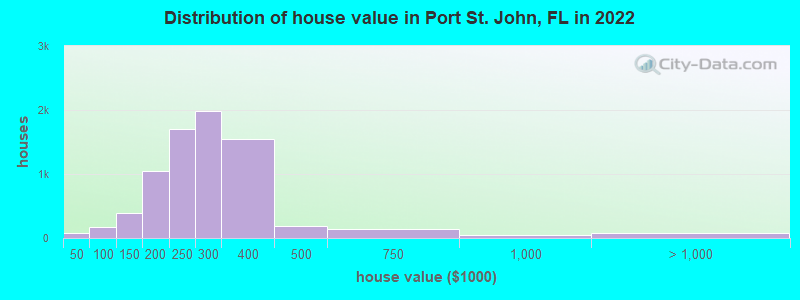
Estimated median house or condo value in 2022: $283,009 (it was $77,800 in 2000)
Port St. John:
$283,009
FL:
$354,100
Mean prices in 2022:all housing units: $380,184; detached houses: $402,429; townhouses or other attached units: $427,011; in 2-unit structures: $268,666; in 3-to-4-unit structures: $223,385; in 5-or-more-unit structures: $377,032; mobile homes: $99,770; occupied boats, rvs, vans, etc.: $140,483
Median gross rent in 2022: $1,510.
March 2022 cost of living index in Port St. John: 89.4 (less than average, U.S. average is 100)
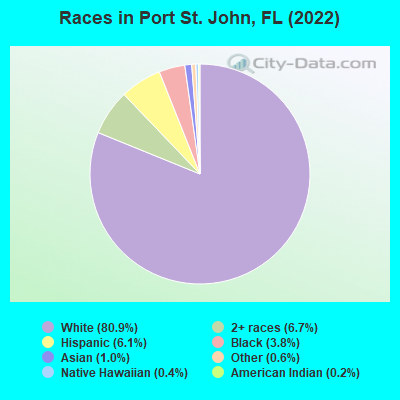
Percentage of residents living in poverty in 2022: 11.3%
(8.9% for White Non-Hispanic residents, 15.2% for Black residents, 34.2% for Hispanic or Latino residents, 12.2% for other race residents, 23.2% for two or more races residents)
Latest news from Port St. John, FL collected exclusively by city-data.com from local newspapers, TV, and radio stations
Ancestries: Irish (12.6%), American (10.8%), German (9.7%), English (8.4%), Italian (5.8%), European (3.1%).
Current Local Time: EST time zone
Elevation: 5 feet
Land area: 3.82 square miles.
Population density: 3,213 people per square mile (average).
1,517 residents are foreign born (3.3% Latin America, 1.7% Europe, 0.7% Asia).
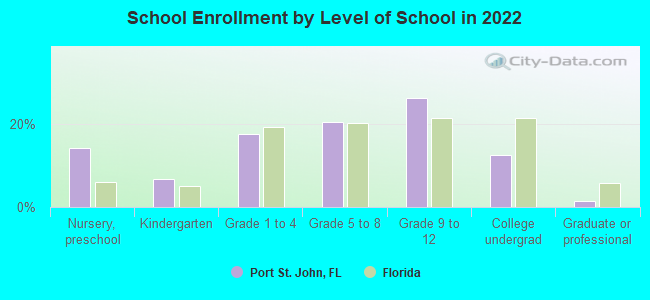
This place:
6.0%
Florida:
21.1%
Median real estate property taxes paid for housing units with mortgages in 2022: $1,568 (0.5%) Median real estate property taxes paid for housing units with no mortgage in 2022: $1,299 (0.5%)
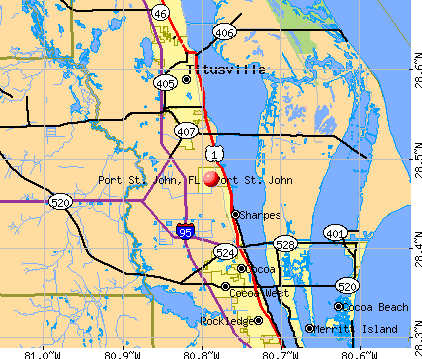
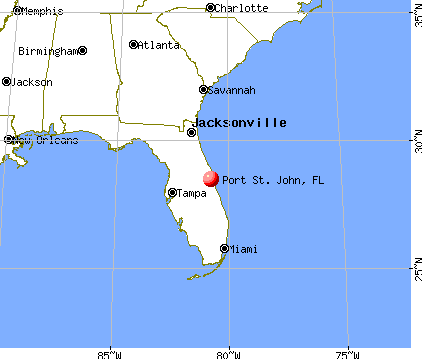
Nearest city with pop. 50,000+: Alafaya, FL (23.9 miles , pop. 78,113).
Nearest city with pop. 200,000+: Tampa, FL (108.0 miles , pop. 303,447).
Nearest city with pop. 1,000,000+: Philadelphia, PA (859.2 miles , pop. 1,517,550).
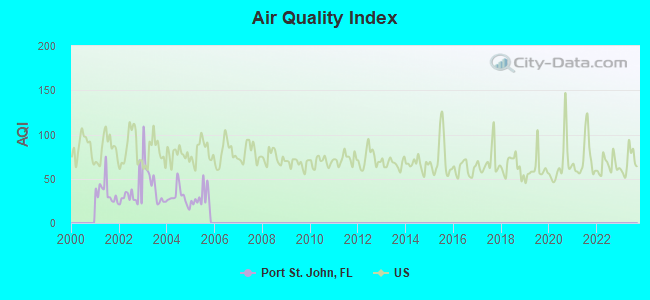
Air Quality Index (AQI) level in 2005 was 29.4. This is significantly better than average.
City:
29.4
U.S.:
72.6
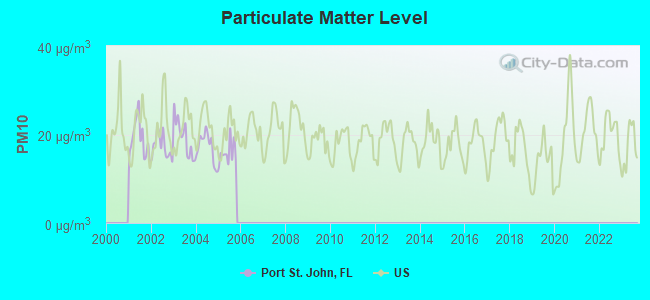
Particulate Matter (PM10) [µg/m3] level in 2005 was 15.7. This is better than average.Closest monitor was 2.4 miles away from the city center.
City:
15.7
U.S.:
19.2
Tornado activity:
Port St. John-area historical tornado activity is near Florida state average. It is 8% greater than the overall U.S. average.
On 4/4/1966, a category F4 (max. wind speeds 207-260 mph) tornado 7.9 miles away from the Port St. John place center killed 11 peopleand injured 530 peopleand causedbetween $5,000,000 and $50,000,000 in damages.
On 2/22/1998, a category F3 (max. wind speeds 158-206 mph) tornado 6.8 miles away from the place center killed 25 peopleand injured 150 peopleand caused $55 million in damages.
Earthquake activity:
Port St. John-area historical earthquake activity is significantly above Florida state average. It is 90% smaller than the overall U.S. average.
On 9/10/2006 at 14:56:08, a magnitude 5.9 (5.9 MB, 5.5 MS, 5.8 MW, Class: Moderate, Intensity: VI - VII) earthquake occurred 390.4 miles away from the city center On 6/23/2016 at 17:20:29, a magnitude 3.8 (3.8 ML, Class: Light, Intensity: II - III) earthquake occurred 132.5 miles away from Port St. John center On 9/4/2016 at 18:29:29, a magnitude 3.8 (3.8 ML) earthquake occurred 134.9 miles away from Port St. John center On 9/21/2016 at 16:30:52, a magnitude 3.8 (3.8 ML) earthquake occurred 134.9 miles away from Port St. John center On 7/16/2016 at 20:00:10, a magnitude 3.7 (3.7 MB) earthquake occurred 121.0 miles away from the city center On 11/22/1974 at 05:25:55, a magnitude 4.7 (4.7 MB, Class: Light, Intensity: IV - V) earthquake occurred 308.3 miles away from Port St. John center Magnitude types: body-wave magnitude (MB), local magnitude (ML), surface-wave magnitude (MS), moment magnitude (MW)
Natural disasters:
The number of natural disasters in Brevard County (27) is a lot greater than the US average (15). Major Disasters (Presidential) Declared: 14 Emergencies Declared: 6
Causes of natural disasters: Hurricanes: 15, Fires: 6, Tropical Storms: 5, Tornadoes: 2, Flood: 1, Heavy Rain: 1, Other: 1 (Note: some incidents may be assigned to more than one category).
Hospitals and medical centers near Port St. John:
WASHINGTON SQUARE (Hospital, about 4 miles away; TITUSVILLE, FL)
NHC HOMECARE (Home Health Center, about 8 miles away; MERRITT ISLAND, FL)
TENDER TOUCH HEALTH CARE (Home Health Center, about 8 miles away; MERRITT ISLAND, FL)
ROYAL OAKS NURSING AND REHAB CENTER (Nursing Home, about 8 miles away; TITUSVILLE, FL)
HEALTH CENTER OF MERRITT ISLAND, THE (Nursing Home, about 8 miles away; MERRITT ISLAND, FL)
TEHC LLC (Home Health Center, about 9 miles away; COCOA, FL)
ISLAND HEALTH AND REHABILITATION CENTER (Nursing Home, about 9 miles away; MERRITT ISLAND, FL)
Colleges/universities with over 2000 students nearest to Port St. John:
Eastern Florida State College (about 7 miles; Cocoa, FL; Full-time enrollment: 12,053)
Florida Technical College (about 26 miles; Orlando, FL; FT enrollment: 4,907)
University of Central Florida (about 27 miles; Orlando, FL; FT enrollment: 51,457)
Florida Institute of Technology (about 31 miles; Melbourne, FL; FT enrollment: 4,452)
Florida Institute of Technology-Online (about 31 miles; Melbourne, FL; FT enrollment: 3,046)
Full Sail University (about 33 miles; Winter Park, FL; FT enrollment: 31,435)
Rollins College (about 35 miles; Winter Park, FL; FT enrollment: 3,085)
Public elementary/middle school in Port St. John:
CAMPUS CHARTER SCHOOL(Students: 45, Location: 3815 CURTIS BLVD, Grades: KG-6, Charter school)
Notable locations in Port St. John: Brevard County Fire Rescue Station 26 (A), Brevard County Public Library System Port Saint John Public Library (B). Display/hide their locations on the map
Churches in Port St. John include: Victory Baptist Church (A), First Baptist Church of Port Saint John (B), Community Alliance Church (C), Christian Church at Port Saint John (D), All Saints Church (E). Display/hide their locations on the map
Brevard County has a predicted average indoor radon screening level less than 2 pCi/L (pico curies per liter) - Low Potential
Average household size:
This place:
2.6 people
Florida:
2.5 people
Percentage of family households:
This place:
73.1%
Whole state:
65.2%
Percentage of households with unmarried partners:
This place:
8.6%
Whole state:
7.3%
Likely homosexual households (counted as self-reported same-sex unmarried-partner households)
Lesbian couples: 0.4% of all households
Gay men: 0.4% of all households
335 people in other nonhousehold living situations in 2000
39 people in other noninstitutional group quarters in 2000
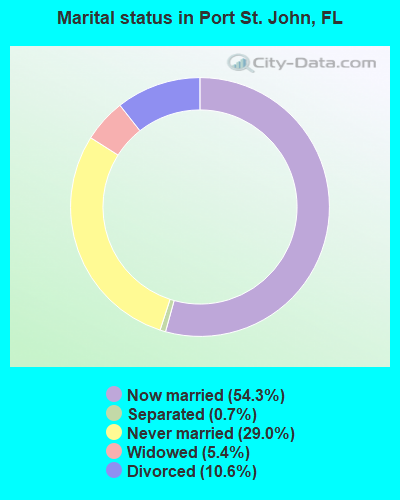
For population 15 years and over in Port St. John:
Never married: 29.0%
Now married: 54.3%
Separated: 0.7%
Widowed: 5.4%
Divorced: 10.6%
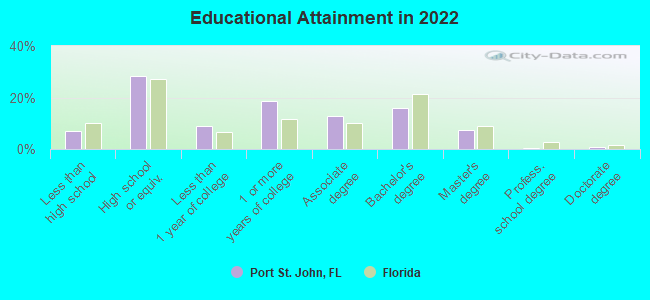
For population 25 years and over in Port St. John:
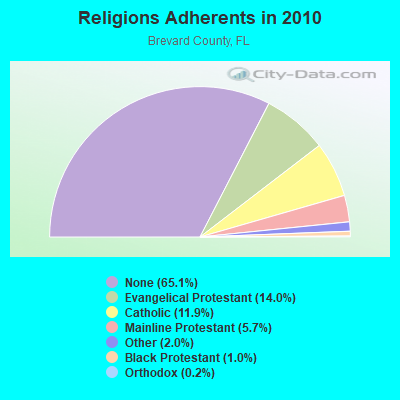
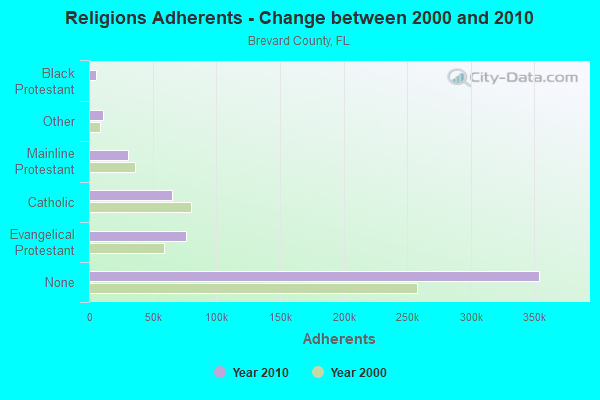
Religion statistics for Port St. John, FL (based on Brevard County data)
Religion
Adherents
Congregations
Evangelical Protestant
75,893
265
Catholic
64,831
14
Mainline Protestant
30,877
64
Other
11,113
41
Black Protestant
5,449
25
Orthodox
1,267
5
None
353,946
-
Source: Clifford Grammich, Kirk Hadaway, Richard Houseal, Dale E.Jones, Alexei Krindatch, Richie Stanley and Richard H.Taylor. 2012. 2010 U.S.Religion Census: Religious Congregations & Membership Study. Association of Statisticians of American Religious Bodies. Jones, Dale E., et al. 2002. Congregations and Membership in the United States 2000. Nashville, TN: Glenmary Research Center. Graphs represent county-level data
Right Of Way At Grissom Hwy & Kings Hwy (Lat: 28.492500 Lon: -80.805556), Type: 48.8, Overall height: 47 m, Registrant: Sprintcom, Inc. Dba , Skenne01@sprintspectrum.Com, , Orlan-do, Phone: (407) 475-1921
FCC Registered Amateur Radio Licenses:
1
Call Sign: AD6Q, Licensee ID: L00164759, Grant Date: 09/27/2017, Expiration Date: 09/27/2027, Registrant: David L Black, 4920 Crown St., Port St. John, FL 32927
Home Mortgage Disclosure Act Aggregated Statistics For Year 2009 (Based on 2 partial tracts)
A) FHA, FSA/RHS & VA Home Purchase Loans
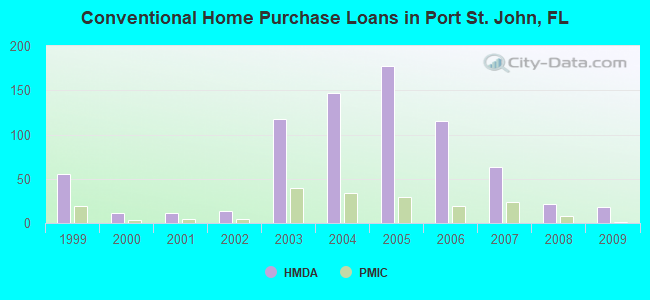
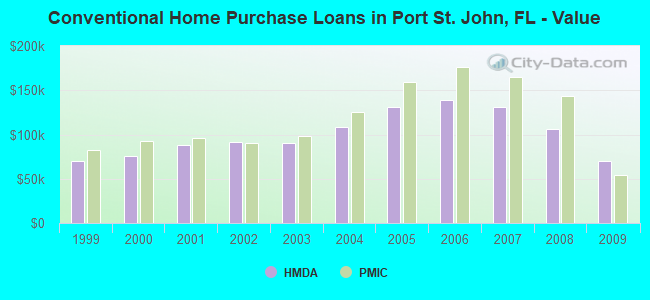
B) Conventional Home Purchase Loans
C) Refinancings
D) Home Improvement Loans
F) Non-occupant Loans on < 5 Family Dwellings (A B C & D)
G) Loans On Manufactured Home Dwelling (A B C & D)
Number
Average Value
Number
Average Value
Number
Average Value
Number
Average Value
Number
Average Value
Number
Average Value
LOANS ORIGINATED
32
$105,992
18
$69,759
45
$119,268
4
$59,735
8
$67,091
3
$84,077
APPLICATIONS APPROVED, NOT ACCEPTED
2
$87,755
2
$84,395
7
$112,036
1
$46,360
1
$28,020
0
$0
APPLICATIONS DENIED
6
$97,300
5
$70,788
28
$133,720
5
$26,490
3
$132,353
2
$87,835
APPLICATIONS WITHDRAWN
3
$112,907
1
$54,820
21
$121,148
1
$29,530
1
$26,440
1
$81,170
FILES CLOSED FOR INCOMPLETENESS
2
$108,070
1
$107,980
3
$142,080
0
$0
0
$0
0
$0
Aggregated Statistics For Year 2008 (Based on 2 partial tracts)
A) FHA, FSA/RHS & VA Home Purchase Loans
B) Conventional Home Purchase Loans
C) Refinancings
D) Home Improvement Loans
F) Non-occupant Loans on < 5 Family Dwellings (A B C & D)
G) Loans On Manufactured Home Dwelling (A B C & D)
Number
Average Value
Number
Average Value
Number
Average Value
Number
Average Value
Number
Average Value
Number
Average Value
LOANS ORIGINATED
31
$127,290
22
$105,768
40
$119,023
8
$65,765
6
$100,407
11
$77,621
APPLICATIONS APPROVED, NOT ACCEPTED
2
$138,140
3
$103,037
14
$121,236
1
$34,370
2
$66,895
1
$102,220
APPLICATIONS DENIED
6
$129,335
9
$105,652
58
$142,912
12
$28,510
2
$74,350
8
$72,675
APPLICATIONS WITHDRAWN
4
$127,680
2
$136,535
21
$143,178
3
$49,127
1
$152,350
2
$82,905
FILES CLOSED FOR INCOMPLETENESS
0
$0
1
$81,570
7
$143,841
1
$74,520
0
$0
0
$0
Aggregated Statistics For Year 2007 (Based on 2 partial tracts)
A) FHA, FSA/RHS & VA Home Purchase Loans
B) Conventional Home Purchase Loans
C) Refinancings
D) Home Improvement Loans
F) Non-occupant Loans on < 5 Family Dwellings (A B C & D)
G) Loans On Manufactured Home Dwelling (A B C & D)
Number
Average Value
Number
Average Value
Number
Average Value
Number
Average Value
Number
Average Value
Number
Average Value
LOANS ORIGINATED
22
$144,645
63
$131,429
120
$135,450
16
$66,696
20
$120,334
14
$84,939
APPLICATIONS APPROVED, NOT ACCEPTED
0
$0
8
$117,695
29
$147,107
5
$68,992
4
$152,868
2
$79,885
APPLICATIONS DENIED
3
$139,987
12
$133,105
114
$152,227
20
$85,114
11
$132,841
7
$70,344
APPLICATIONS WITHDRAWN
2
$166,025
9
$111,321
54
$151,860
6
$60,278
3
$85,990
2
$97,590
FILES CLOSED FOR INCOMPLETENESS
1
$92,680
2
$155,380
13
$172,837
3
$127,700
1
$123,420
1
$64,840
Aggregated Statistics For Year 2006 (Based on 2 partial tracts)
A) FHA, FSA/RHS & VA Home Purchase Loans
B) Conventional Home Purchase Loans
C) Refinancings
D) Home Improvement Loans
F) Non-occupant Loans on < 5 Family Dwellings (A B C & D)
G) Loans On Manufactured Home Dwelling (A B C & D)
Number
Average Value
Number
Average Value
Number
Average Value
Number
Average Value
Number
Average Value
Number
Average Value
LOANS ORIGINATED
18
$162,823
115
$139,430
239
$136,410
32
$77,369
31
$134,372
21
$87,591
APPLICATIONS APPROVED, NOT ACCEPTED
1
$71,280
13
$122,914
39
$131,726
5
$70,056
8
$119,091
4
$64,268
APPLICATIONS DENIED
3
$174,637
39
$139,610
116
$146,170
24
$60,130
11
$107,990
14
$63,598
APPLICATIONS WITHDRAWN
1
$96,590
18
$136,307
106
$145,892
12
$90,472
6
$137,920
3
$63,423
FILES CLOSED FOR INCOMPLETENESS
0
$0
3
$147,490
24
$157,447
2
$36,485
1
$122,960
0
$0
Aggregated Statistics For Year 2005 (Based on 2 partial tracts)
A) FHA, FSA/RHS & VA Home Purchase Loans
B) Conventional Home Purchase Loans
C) Refinancings
D) Home Improvement Loans
F) Non-occupant Loans on < 5 Family Dwellings (A B C & D)
G) Loans On Manufactured Home Dwelling (A B C & D)
Number
Average Value
Number
Average Value
Number
Average Value
Number
Average Value
Number
Average Value
Number
Average Value
LOANS ORIGINATED
19
$140,935
177
$130,730
283
$122,431
40
$76,918
59
$123,030
20
$72,782
APPLICATIONS APPROVED, NOT ACCEPTED
1
$111,900
18
$121,286
32
$113,477
5
$52,164
5
$117,390
3
$53,487
APPLICATIONS DENIED
3
$105,003
35
$128,365
163
$121,506
30
$66,878
12
$130,182
11
$68,028
APPLICATIONS WITHDRAWN
1
$201,580
34
$128,730
149
$124,114
12
$120,865
6
$119,115
6
$76,343
FILES CLOSED FOR INCOMPLETENESS
0
$0
5
$125,872
26
$138,515
2
$44,150
2
$112,225
0
$0
Aggregated Statistics For Year 2004 (Based on 2 partial tracts)
A) FHA, FSA/RHS & VA Home Purchase Loans
B) Conventional Home Purchase Loans
C) Refinancings
D) Home Improvement Loans
F) Non-occupant Loans on < 5 Family Dwellings (A B C & D)
G) Loans On Manufactured Home Dwelling (A B C & D)
Number
Average Value
Number
Average Value
Number
Average Value
Number
Average Value
Number
Average Value
Number
Average Value
LOANS ORIGINATED
33
$119,403
147
$108,894
214
$94,819
24
$55,297
37
$94,576
11
$60,377
APPLICATIONS APPROVED, NOT ACCEPTED
2
$83,820
18
$105,217
45
$89,715
7
$37,081
6
$98,090
6
$53,215
APPLICATIONS DENIED
3
$98,717
29
$104,823
150
$91,383
27
$41,174
10
$93,738
10
$53,076
APPLICATIONS WITHDRAWN
4
$100,300
14
$121,670
146
$98,065
6
$52,795
6
$87,842
5
$60,222
FILES CLOSED FOR INCOMPLETENESS
0
$0
4
$87,500
18
$104,845
2
$28,965
1
$211,330
0
$0
Aggregated Statistics For Year 2003 (Based on 2 partial tracts)
A) FHA, FSA/RHS & VA Home Purchase Loans
B) Conventional Home Purchase Loans
C) Refinancings
D) Home Improvement Loans
F) Non-occupant Loans on < 5 Family Dwellings (A B C & D)
Number
Average Value
Number
Average Value
Number
Average Value
Number
Average Value
Number
Average Value
LOANS ORIGINATED
45
$101,531
117
$90,680
336
$81,853
12
$27,502
38
$78,224
APPLICATIONS APPROVED, NOT ACCEPTED
1
$123,060
9
$79,578
44
$78,887
7
$25,400
3
$72,483
APPLICATIONS DENIED
4
$86,992
16
$90,763
133
$81,632
17
$29,211
4
$62,055
APPLICATIONS WITHDRAWN
4
$108,020
11
$101,022
103
$88,405
2
$33,625
3
$86,677
FILES CLOSED FOR INCOMPLETENESS
3
$96,450
3
$61,160
15
$84,167
0
$0
1
$110,510
Aggregated Statistics For Year 2002 (Based on 1 partial tract)
A) FHA, FSA/RHS & VA Home Purchase Loans
B) Conventional Home Purchase Loans
C) Refinancings
D) Home Improvement Loans
F) Non-occupant Loans on < 5 Family Dwellings (A B C & D)
Number
Average Value
Number
Average Value
Number
Average Value
Number
Average Value
Number
Average Value
LOANS ORIGINATED
5
$64,826
14
$91,714
23
$89,234
2
$15,945
5
$63,224
APPLICATIONS APPROVED, NOT ACCEPTED
0
$0
1
$72,920
5
$88,988
0
$0
0
$0
APPLICATIONS DENIED
0
$0
2
$91,740
12
$72,382
2
$23,045
1
$61,420
APPLICATIONS WITHDRAWN
0
$0
2
$72,635
7
$105,261
1
$14,880
0
$0
FILES CLOSED FOR INCOMPLETENESS
0
$0
0
$0
1
$88,240
0
$0
0
$0
Aggregated Statistics For Year 2001 (Based on 1 partial tract)
A) FHA, FSA/RHS & VA Home Purchase Loans
B) Conventional Home Purchase Loans
C) Refinancings
D) Home Improvement Loans
F) Non-occupant Loans on < 5 Family Dwellings (A B C & D)
Number
Average Value
Number
Average Value
Number
Average Value
Number
Average Value
Number
Average Value
LOANS ORIGINATED
6
$75,903
11
$88,387
14
$92,285
2
$18,200
4
$69,255
APPLICATIONS APPROVED, NOT ACCEPTED
0
$0
1
$71,560
2
$78,045
1
$10,820
0
$0
APPLICATIONS DENIED
1
$37,190
3
$96,133
13
$59,870
2
$16,455
1
$46,210
APPLICATIONS WITHDRAWN
0
$0
1
$86,780
9
$71,251
0
$0
0
$0
FILES CLOSED FOR INCOMPLETENESS
0
$0
1
$32,230
0
$0
0
$0
0
$0
Aggregated Statistics For Year 2000 (Based on 1 partial tract)
A) FHA, FSA/RHS & VA Home Purchase Loans
B) Conventional Home Purchase Loans
C) Refinancings
D) Home Improvement Loans
F) Non-occupant Loans on < 5 Family Dwellings (A B C & D)
Number
Average Value
Number
Average Value
Number
Average Value
Number
Average Value
Number
Average Value
LOANS ORIGINATED
5
$68,408
11
$76,216
6
$70,362
2
$17,750
2
$57,475
APPLICATIONS APPROVED, NOT ACCEPTED
0
$0
2
$43,390
2
$37,475
1
$10,480
0
$0
APPLICATIONS DENIED
1
$35,730
7
$40,861
7
$42,166
2
$9,580
1
$30,430
APPLICATIONS WITHDRAWN
0
$0
1
$78,330
4
$44,038
0
$0
0
$0
FILES CLOSED FOR INCOMPLETENESS
0
$0
0
$0
2
$57,025
0
$0
0
$0
Aggregated Statistics For Year 1999 (Based on 2 partial tracts)
A) FHA, FSA/RHS & VA Home Purchase Loans
B) Conventional Home Purchase Loans
C) Refinancings
D) Home Improvement Loans
F) Non-occupant Loans on < 5 Family Dwellings (A B C & D)
#31 on the list of "Top 101 cities with the largest percentage of people in other nonhousehold living situations (population 1,000+)"
#70 on the list of "Top 101 cities with largest percentage of males in occupations: community and social service occupations (population 5,000+)"
#29 on the list of "Top 101 counties with the lowest number of births per 1000 residents 2007-2013"
#29 on the list of "Top 101 counties with the largest increase in the number of infant deaths per 1000 residents 2000-2006 to 2007-2013 (pop. 50,000+)"
#54 on the list of "Top 101 counties with the lowest Particulate Matter (PM2.5) Annual air pollution readings in 2012 (µg/m3)"
#82 on the list of "Top 101 counties with the highest number of infant deaths per 1000 residents 2007-2013 (pop. 50,000+)"
#94 on the list of "Top 101 counties with the most Evangelical Protestant congregations"


 Recent articles from our blog. Our writers, many of them Ph.D. graduates or candidates, create easy-to-read articles on a wide variety of topics.

 , pop. 78,113).