Sherborn, Massachusetts
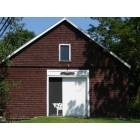
Sherborn: Sherborn Community Center
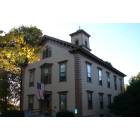
Sherborn: Sherborn Community Center
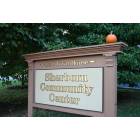
Sherborn: Sherborn Community Center

Sherborn: Sherborn Community Center - July 4th Float
- add
your
Submit your own pictures of this town and show them to the world
- OSM Map
- General Map
- Google Map
- MSN Map
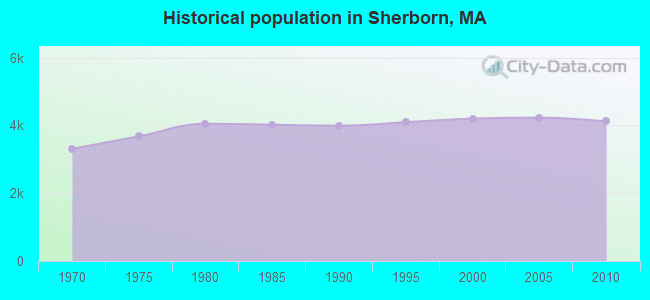
Population change since 2000: -1.9%
 |
| Males: 2,004 | |
| Females: 2,115 |
| Median resident age: | 45.5 years |
| Massachusetts median age: | 39.2 years |
Zip codes: 01770.
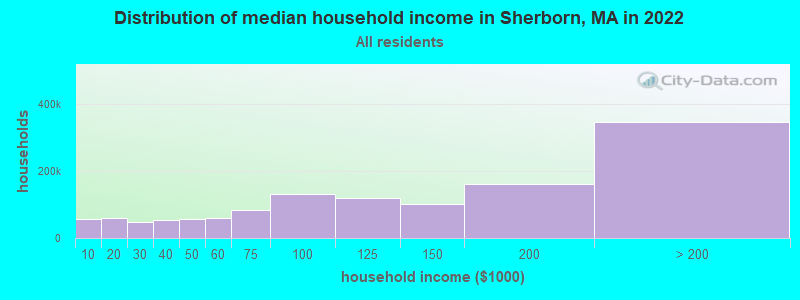
| Sherborn: | over $200,000 |
| MA: | $94,488 |
Estimated per capita income in 2022: $120,533 (it was $58,055 in 2000)
Sherborn town income, earnings, and wages data
Estimated median house or condo value in 2022: over $1,000,000 (it was $504,100 in 2000)
| Sherborn: | over $1,000,000 |
| MA: | $534,700 |
Mean prices in 2022: all housing units: $796,617; detached houses: $834,667; townhouses or other attached units: $772,440; in 2-unit structures: $786,250; in 3-to-4-unit structures: $655,835; in 5-or-more-unit structures: $590,321; mobile homes: $144,935
Detailed information about poverty and poor residents in Sherborn, MA


- 3,84593.3%White alone
- 1373.3%Asian alone
- 571.4%Hispanic
- 531.3%Two or more races
- 160.4%Black alone
- 100.2%Other race alone
- 10.02%American Indian alone
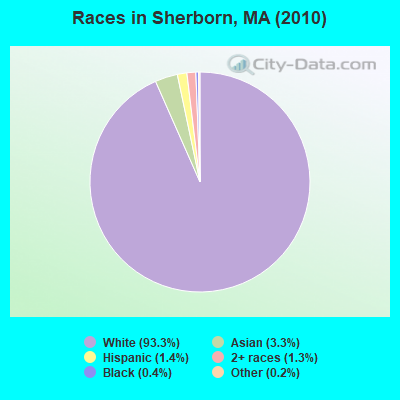
Races in Sherborn detailed stats: ancestries, foreign born residents, place of birth
Type |
2009 |
2010 |
2011 |
2012 |
2013 |
2014 |
2015 |
2016 |
2017 |
2018 |
2020 |
2021 |
2022 |
|---|---|---|---|---|---|---|---|---|---|---|---|---|---|
| Murders (per 100,000) | 0 (0.0) | 0 (0.0) | 0 (0.0) | 0 (0.0) | 0 (0.0) | 0 (0.0) | 0 (0.0) | 0 (0.0) | 0 (0.0) | 0 (0.0) | 0 (0.0) | 0 (0.0) | 0 (0.0) |
| Rapes (per 100,000) | 0 (0.0) | 0 (0.0) | 0 (0.0) | 0 (0.0) | 1 (23.6) | 0 (0.0) | 1 (23.1) | 1 (23.2) | 1 (23.2) | 1 (23.0) | 0 (0.0) | 0 (0.0) | 2 (45.6) |
| Robberies (per 100,000) | 0 (0.0) | 0 (0.0) | 0 (0.0) | 0 (0.0) | 1 (23.6) | 0 (0.0) | 0 (0.0) | 1 (23.2) | 0 (0.0) | 1 (23.0) | 0 (0.0) | 1 (22.5) | 0 (0.0) |
| Assaults (per 100,000) | 2 (46.7) | 0 (0.0) | 5 (120.7) | 2 (47.6) | 1 (23.6) | 6 (140.2) | 0 (0.0) | 1 (23.2) | 5 (115.8) | 6 (137.9) | 7 (161.5) | 0 (0.0) | 2 (45.6) |
| Burglaries (per 100,000) | 12 (280.3) | 17 (412.7) | 15 (362.0) | 9 (214.3) | 13 (306.9) | 13 (303.7) | 9 (208.3) | 3 (69.5) | 0 (0.0) | 3 (68.9) | 3 (69.2) | 3 (67.5) | 0 (0.0) |
| Thefts (per 100,000) | 15 (350.4) | 17 (412.7) | 10 (241.3) | 19 (452.5) | 23 (543.0) | 16 (373.8) | 9 (208.3) | 10 (231.6) | 8 (185.3) | 19 (436.7) | 8 (184.5) | 3 (67.5) | 6 (136.9) |
| Auto thefts (per 100,000) | 2 (46.7) | 3 (72.8) | 5 (120.7) | 1 (23.8) | 3 (70.8) | 1 (23.4) | 2 (46.3) | 0 (0.0) | 0 (0.0) | 1 (23.0) | 0 (0.0) | 2 (45.0) | 1 (22.8) |
| Arson (per 100,000) | 0 (0.0) | 0 (0.0) | 0 (0.0) | 0 (0.0) | 2 (47.2) | 0 (0.0) | 0 (0.0) | 0 (0.0) | 0 (0.0) | 0 (0.0) | 0 (0.0) | 0 (0.0) | 0 (0.0) |
| City-Data.com crime index | 46.7 | 51.2 | 68.8 | 44.5 | 79.6 | 66.1 | 45.1 | 44.2 | 49.1 | 77.0 | 44.5 | 17.8 | 52.9 |
The City-Data.com crime index weighs serious crimes and violent crimes more heavily. Higher means more crime, U.S. average is 246.1. It adjusts for the number of visitors and daily workers commuting into cities.
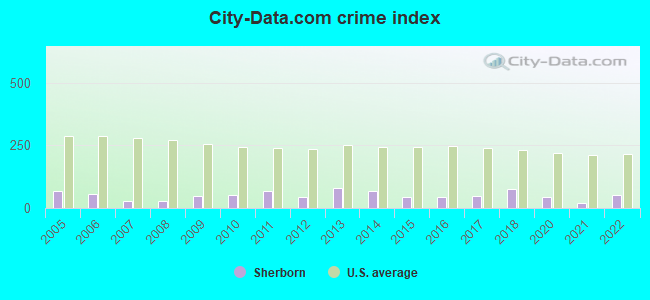
Crime rate in Sherborn detailed stats: murders, rapes, robberies, assaults, burglaries, thefts, arson
Full-time law enforcement employees in 2021, including police officers: 15 (15 officers - 14 male; 1 female).
| Officers per 1,000 residents here: | 3.37 |
| Massachusetts average: | 2.53 |
 Recent articles from our blog. Our writers, many of them Ph.D. graduates or candidates, create easy-to-read articles on a wide variety of topics.

 | Dover vs. Sherborn (61 replies) |
| Cars in MA (789 replies) |
| Boston job possibility.. (142 replies) |
| 2021 Median Home Prices By Town/City (118 replies) |
| Route 16 (Holliston through Sherborn?) (1 reply) |
| Thoughts on these 10 towns (92 replies) |
Latest news from Sherborn, MA collected exclusively by city-data.com from local newspapers, TV, and radio stations
Ancestries: English (26.3%), Irish (19.3%), Italian (13.2%), German (10.3%), Polish (6.0%), Scottish (5.0%).
Current Local Time: EST time zone
Incorporated in 1674
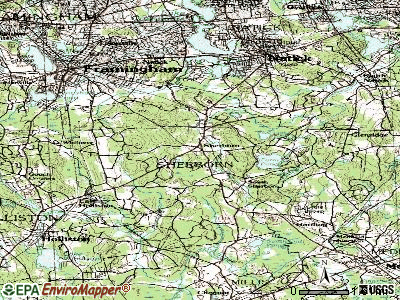
Elevation: 175 feet
Land area: 16.0 square miles.
Population density: 258 people per square mile (very low).
249 residents are foreign born (2.5% Europe, 2.0% Asia, 0.7% North America).
| This town: | 5.9% |
| Massachusetts: | 12.2% |
| Sherborn town: | 1.2% ($6,108) |
| Massachusetts: | 1.3% ($2,336) |
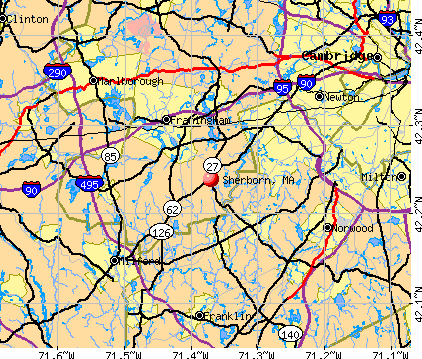
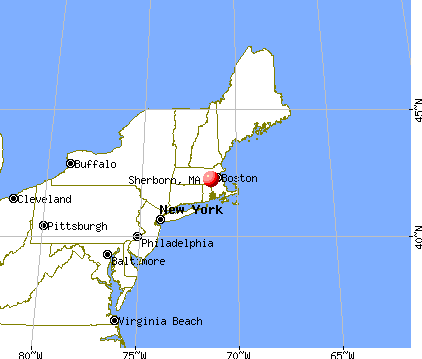
Nearest city with pop. 50,000+: Framingham, MA  (5.5 miles , pop. 66,910).
Nearest city with pop. 200,000+: Boston, MA (15.8 miles , pop. 589,141).
Nearest city with pop. 1,000,000+: Bronx, NY (161.0 miles , pop. 1,332,650).
Nearest cities:
), ), Latitude: 42.23 N, Longitude: 71.37 W

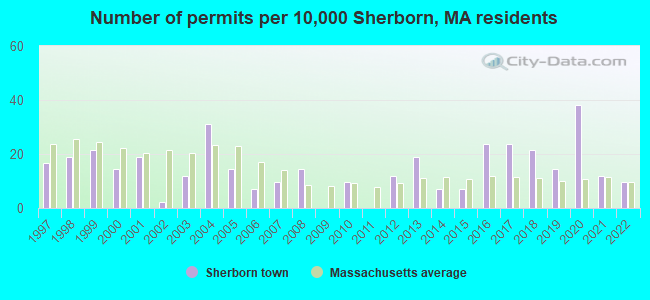
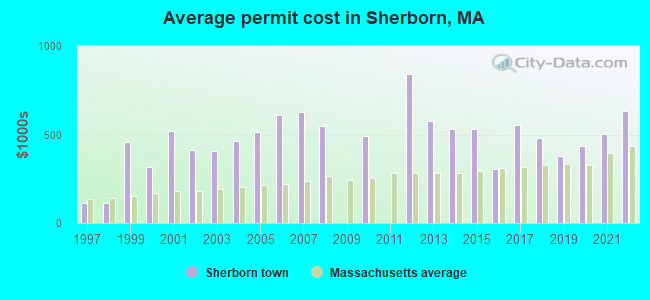
Single-family new house construction building permits:
- 2022: 4 buildings, average cost: $630,500
- 2021: 5 buildings, average cost: $503,000
- 2020: 16 buildings, average cost: $435,200
- 2019: 6 buildings, average cost: $376,600
- 2018: 9 buildings, average cost: $482,100
- 2017: 10 buildings, average cost: $554,000
- 2016: 10 buildings, average cost: $303,100
- 2015: 3 buildings, average cost: $530,500
- 2014: 3 buildings, average cost: $530,500
- 2013: 8 buildings, average cost: $575,600
- 2012: 5 buildings, average cost: $844,200
- 2010: 4 buildings, average cost: $490,300
- 2008: 6 buildings, average cost: $550,200
- 2007: 4 buildings, average cost: $626,100
- 2006: 3 buildings, average cost: $609,800
- 2005: 6 buildings, average cost: $515,700
- 2004: 13 buildings, average cost: $464,800
- 2003: 5 buildings, average cost: $405,600
- 2002: 1 building, cost: $409,700
- 2001: 8 buildings, average cost: $518,100
- 2000: 6 buildings, average cost: $316,700
- 1999: 9 buildings, average cost: $455,600
- 1998: 8 buildings, average cost: $114,200
- 1997: 7 buildings, average cost: $111,800
| Here: | 2.6% |
| Massachusetts: | 3.5% |
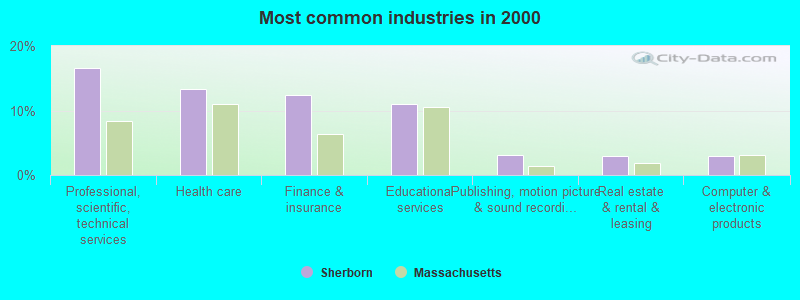
- Professional, scientific, technical services (16.6%)
- Health care (13.4%)
- Finance & insurance (12.4%)
- Educational services (11.0%)
- Publishing, motion picture & sound recording industries (3.0%)
- Real estate & rental & leasing (2.9%)
- Computer & electronic products (2.9%)
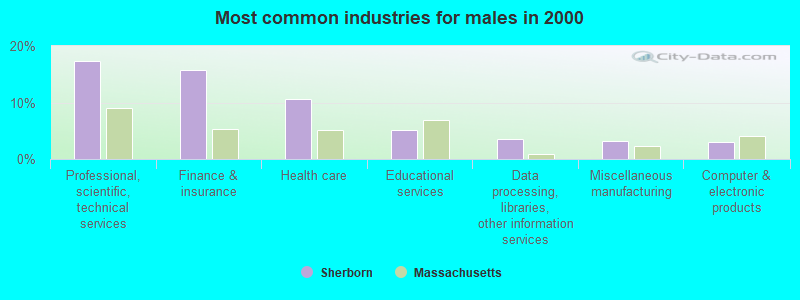
- Professional, scientific, technical services (17.3%)
- Finance & insurance (15.8%)
- Health care (10.6%)
- Educational services (5.0%)
- Data processing, libraries, other information services (3.6%)
- Miscellaneous manufacturing (3.2%)
- Computer & electronic products (2.9%)
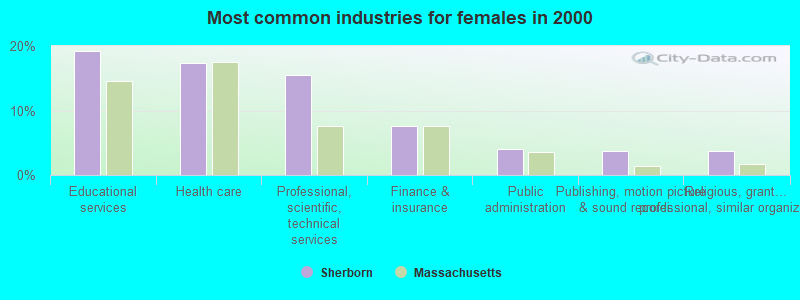
- Educational services (19.2%)
- Health care (17.4%)
- Professional, scientific, technical services (15.5%)
- Finance & insurance (7.7%)
- Public administration (4.1%)
- Publishing, motion picture & sound recording industries (3.7%)
- Religious, grantmaking, civic, professional, similar organizations (3.7%)
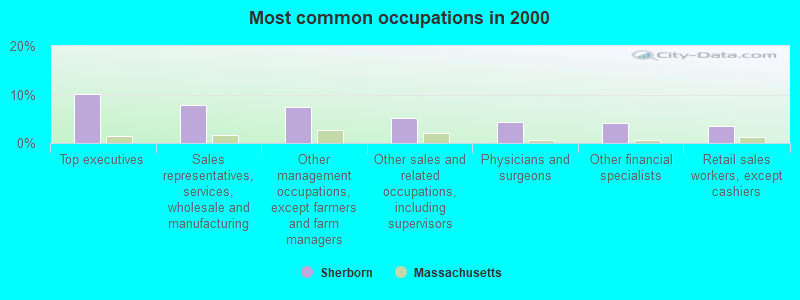
- Top executives (10.2%)
- Sales representatives, services, wholesale and manufacturing (7.8%)
- Other management occupations, except farmers and farm managers (7.5%)
- Other sales and related occupations, including supervisors (5.2%)
- Physicians and surgeons (4.4%)
- Other financial specialists (4.1%)
- Retail sales workers, except cashiers (3.5%)
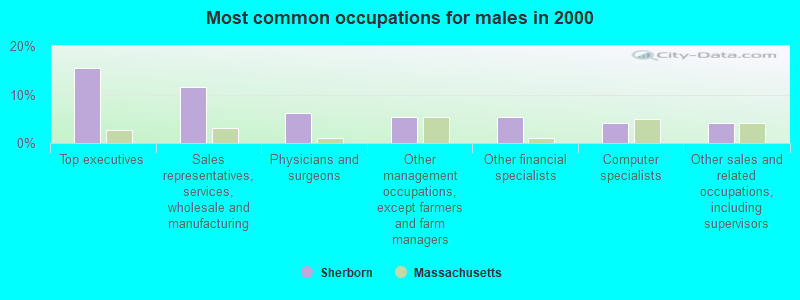
- Top executives (15.5%)
- Sales representatives, services, wholesale and manufacturing (11.6%)
- Physicians and surgeons (6.2%)
- Other management occupations, except farmers and farm managers (5.4%)
- Other financial specialists (5.3%)
- Computer specialists (4.1%)
- Other sales and related occupations, including supervisors (4.0%)

- Other management occupations, except farmers and farm managers (10.4%)
- Other sales and related occupations, including supervisors (6.9%)
- Registered nurses (6.9%)
- Preschool, kindergarten, elementary, and middle school teachers (5.8%)
- Retail sales workers, except cashiers (5.2%)
- Secretaries and administrative assistants (4.5%)
- Other teachers, instructors, education, training, and library occupations (3.8%)
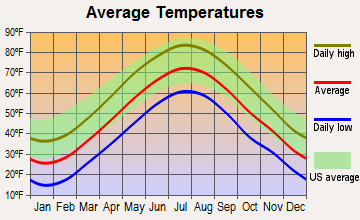
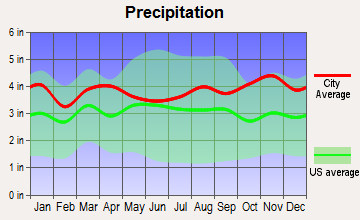
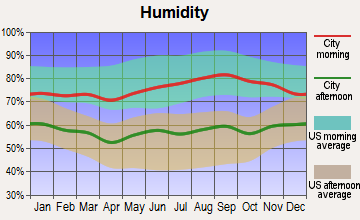
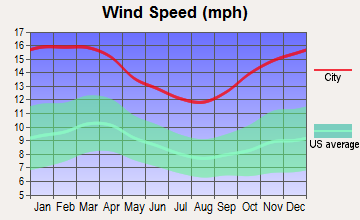
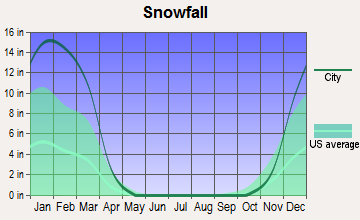
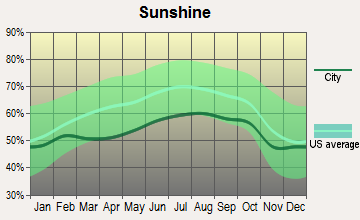
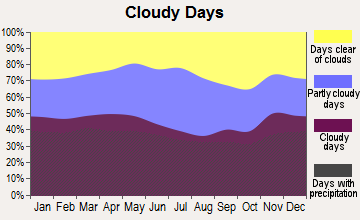
Average climate in Sherborn, Massachusetts
Based on data reported by over 4,000 weather stations
(lower is better)
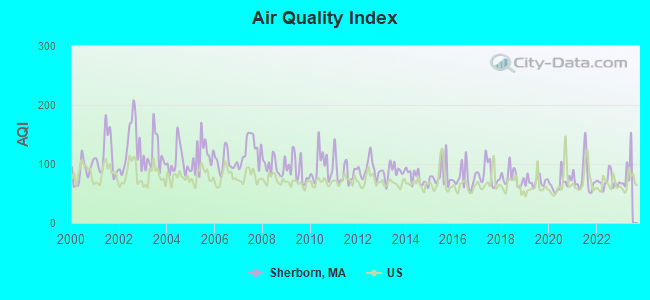
Air Quality Index (AQI) level in 2022 was 70.2. This is about average.
| City: | 70.2 |
| U.S.: | 72.6 |

Carbon Monoxide (CO) [ppm] level in 2022 was 0.266. This is about average. Closest monitor was 12.1 miles away from the city center.
| City: | 0.266 |
| U.S.: | 0.251 |
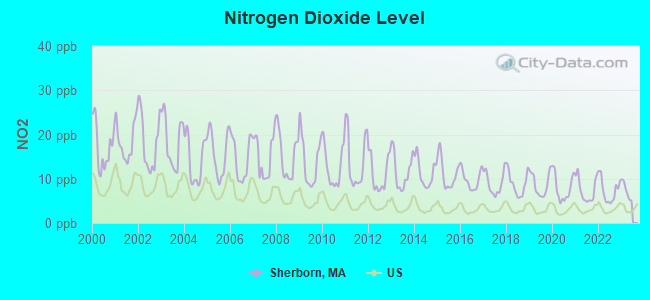
Nitrogen Dioxide (NO2) [ppb] level in 2022 was 7.30. This is significantly worse than average. Closest monitor was 2.3 miles away from the city center.
| City: | 7.30 |
| U.S.: | 5.11 |
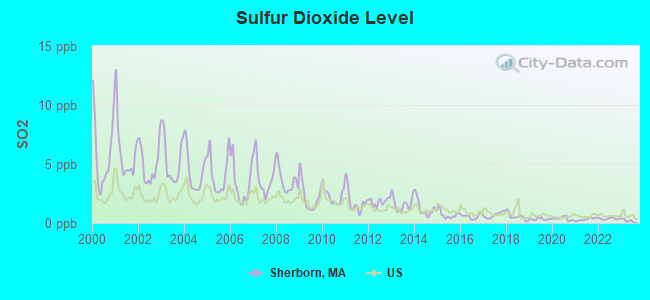
Sulfur Dioxide (SO2) [ppb] level in 2022 was 0.363. This is significantly better than average. Closest monitor was 2.3 miles away from the city center.
| City: | 0.363 |
| U.S.: | 1.515 |
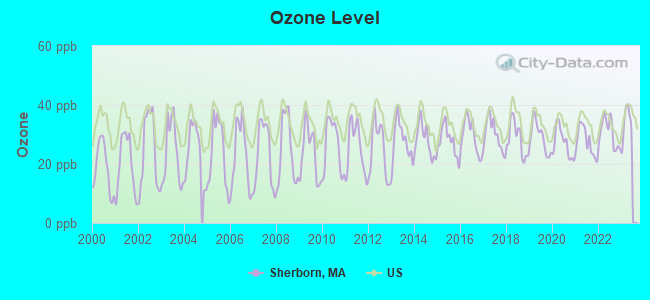
Ozone [ppb] level in 2022 was 30.5. This is about average. Closest monitor was 2.3 miles away from the city center.
| City: | 30.5 |
| U.S.: | 33.3 |
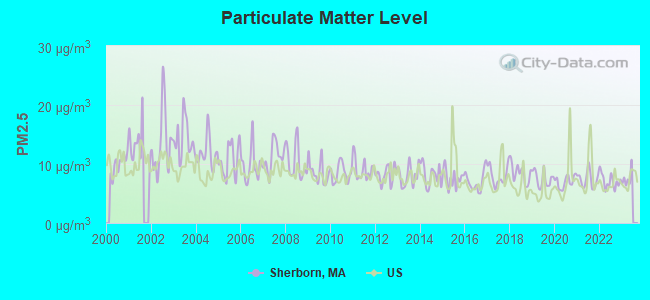
Particulate Matter (PM2.5) [µg/m3] level in 2022 was 7.11. This is about average. Closest monitor was 13.3 miles away from the city center.
| City: | 7.11 |
| U.S.: | 8.11 |
Tornado activity:
Sherborn-area historical tornado activity is near Massachusetts state average. It is 36% smaller than the overall U.S. average.
On 6/9/1953, a category F4 (max. wind speeds 207-260 mph) tornado 9.0 miles away from the Sherborn town center killed 90 people and injured 1228 people and caused between $50,000,000 and $500,000,000 in damages.
On 6/9/1953, a category F3 (max. wind speeds 158-206 mph) tornado 15.3 miles away from the town center injured 17 people and caused between $500,000 and $5,000,000 in damages.
Earthquake activity:
Sherborn-area historical earthquake activity is significantly above Massachusetts state average. It is 73% smaller than the overall U.S. average.On 10/7/1983 at 10:18:46, a magnitude 5.3 (5.1 MB, 5.3 LG, 5.1 ML, Class: Moderate, Intensity: VI - VII) earthquake occurred 191.5 miles away from the city center
On 4/20/2002 at 10:50:47, a magnitude 5.3 (5.3 ML, Depth: 3.0 mi) earthquake occurred 196.4 miles away from Sherborn center
On 1/19/1982 at 00:14:42, a magnitude 4.7 (4.5 MB, 4.7 MD, 4.5 LG, Class: Light, Intensity: IV - V) earthquake occurred 88.5 miles away from the city center
On 4/20/2002 at 10:50:47, a magnitude 5.2 (5.2 MB, 4.2 MS, 5.2 MW, 5.0 MW) earthquake occurred 195.6 miles away from the city center
On 10/16/2012 at 23:12:25, a magnitude 4.7 (4.7 ML, Depth: 10.0 mi) earthquake occurred 101.2 miles away from the city center
On 8/22/1992 at 12:20:32, a magnitude 4.8 (4.8 MB, 3.8 MS, 4.7 LG, Depth: 6.2 mi) earthquake occurred 223.1 miles away from the city center
Magnitude types: regional Lg-wave magnitude (LG), body-wave magnitude (MB), duration magnitude (MD), local magnitude (ML), surface-wave magnitude (MS), moment magnitude (MW)
Natural disasters:
The number of natural disasters in Middlesex County (31) is a lot greater than the US average (15).Major Disasters (Presidential) Declared: 17
Emergencies Declared: 14
Causes of natural disasters: Floods: 12, Storms: 9, Hurricanes: 6, Snowstorms: 6, Winter Storms: 5, Blizzards: 2, Snows: 2, Explosion: 1, Heavy Rain: 1, Snowfall: 1, Water Main Break: 1, Wind: 1 (Note: some incidents may be assigned to more than one category).
Hospitals and medical centers near Sherborn:
- MEDFIELD STATE HOSPITAL (Hospital, about 4 miles away; MEDFIELD, MA)
- TIMOTHY DANIELS HOUSE (Nursing Home, about 4 miles away; HOLLISTON, MA)
- KINDRED TRANSITIONAL CARE AND REHABILITATION-ELIOT (Nursing Home, about 4 miles away; NATICK, MA)
- BETHANY SKILLED NURSING FACILITY (Nursing Home, about 4 miles away; FRAMINGHAM, MA)
- LEONARD MORSE HOSPITAL (Hospital, about 4 miles away; NATICK, MA)
- MARY ANN MORSE NURSING AND REHABILITATION (Nursing Home, about 5 miles away; NATICK, MA)
- RIVERBEND OF SOUTH NATICK (Nursing Home, about 5 miles away; S NATICK, MA)
Heliports located in Sherborn:
See details about Heliports located in Sherborn, MAAmtrak stations near Sherborn:
- 4 miles: FRAMINGHAM (443 WAVERLY ST.) . Services: public payphones, snack bar, paid short-term parking, taxi stand, public transit connection.
- 12 miles: ROUTE 128 (WESTWOOD, UNIVERSITY AVE. & RTE. 128) . Services: ticket office, enclosed waiting area, public restrooms, public payphones, vending machines, paid short-term parking, taxi stand, public transit connection.
- 18 miles: BACK BAY (BOSTON, 145 DARTMOUTH ST.) . Services: ticket office, partially wheelchair accessible, enclosed waiting area, public restrooms, public payphones, vending machines, ATM, paid short-term parking, paid long-term parking, call for car rental service, taxi stand, public transit connection.
Colleges/universities with over 2000 students nearest to Sherborn:
- Wellesley College (about 6 miles; Wellesley, MA; Full-time enrollment: 2,658)
- Framingham State University (about 6 miles; Framingham, MA; FT enrollment: 5,743)
- Babson College (about 7 miles; Wellesley, MA; FT enrollment: 3,230)
- Massachusetts Bay Community College (about 8 miles; Wellesley Hills, MA; FT enrollment: 3,636)
- Brandeis University (about 12 miles; Waltham, MA; FT enrollment: 6,966)
- Boston College (about 13 miles; Chestnut Hill, MA; FT enrollment: 12,070)
- Curry College (about 14 miles; Milton, MA; FT enrollment: 2,586)
Public elementary/middle school in Sherborn:
- PINE HILL (Students: 476, Location: 1 PINE HILL LANE, Grades: PK-5)
Points of interest:
Notable locations in Sherborn: Dowse Orchards (A), Sherborn Fire Department (B), Sherborn Library (C), Sherborn Town Hall (D). Display/hide their locations on the map
Churches in Sherborn include: Unitarian Universalist Church (A), Pilgrim Church (B), Saint Marys Church (C). Display/hide their locations on the map
Cemeteries: Brush Hill Burying Ground (1), Clara Barton Burying Ground (2), Plain Burying Ground (3), Central Burying Ground (4), Old South Burying Ground (5), Sherborn Reformatory for Women-Annex Cemetery (6), West Burying Ground (7). Display/hide their locations on the map
Lakes, reservoirs, and swamps: Farm Pond (A), Little Farm Pond (B), Leland Millpond (C), Dirty Meadow Swamp (D). Display/hide their locations on the map
Streams, rivers, and creeks: Sewall Brook (A), Indian Brook (B). Display/hide their locations on the map
Parks in Sherborn include: Sherborn Center Historic District (1), Rocky Narrows Reservation (2), Edwards Plain-Dowses Corner Historic District (3). Display/hide their locations on the map
Birthplace of: Alexander Oliver - Continental Army officer, Chad Urmston - Musician.
| This town: | 2.9 people |
| Massachusetts: | 2.5 people |
| This town: | 81.9% |
| Whole state: | 63.0% |
| This town: | 3.1% |
| Whole state: | 7.0% |
Likely homosexual households (counted as self-reported same-sex unmarried-partner households)
- Lesbian couples: 0.6% of all households
- Gay men: 0.2% of all households
| This town: | 2.3% |
| Whole state: | 9.3% |
| This town: | 0.3% |
| Whole state: | 4.4% |
Banks with branches in Sherborn (2011 data):
- Sovereign Bank, National Association: Sherborn Branch at 31 North Main Street, branch established on 1978/04/10. Info updated 2012/01/31: Bank assets: $78,146.9 mil, Deposits: $48,042.9 mil, headquarters in Wilmington, DE, positive income, Commercial Lending Specialization, 718 total offices, Holding Company: Banco Santander, S.A.
For population 15 years and over in Sherborn:
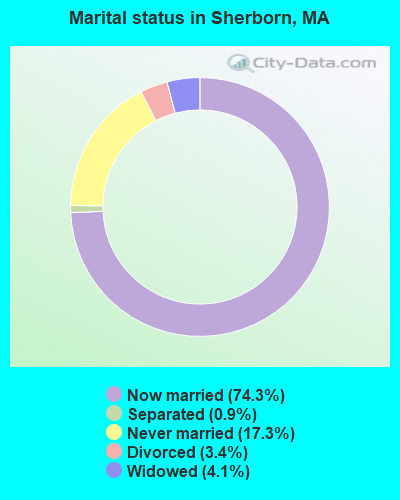
- Never married: 17.3%
- Now married: 74.3%
- Separated: 0.9%
- Widowed: 4.1%
- Divorced: 3.4%
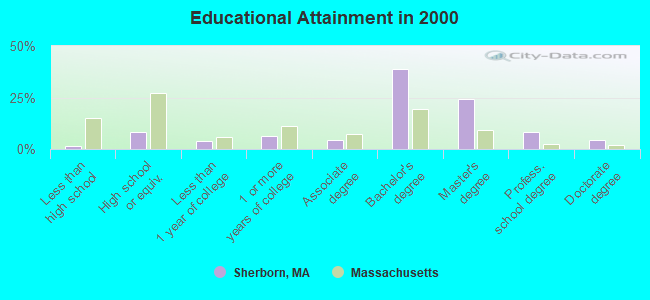
For population 25 years and over in Sherborn:
- High school or higher: 98.5%
- Bachelor's degree or higher: 75.6%
- Graduate or professional degree: 36.7%
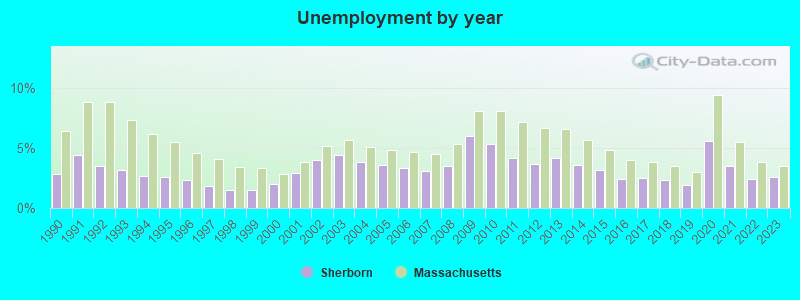
- Unemployed: 4.5%
- Mean travel time to work (commute): 35.4 minutes
| Here: | 8.4 |
| Massachusetts average: | 13.1 |
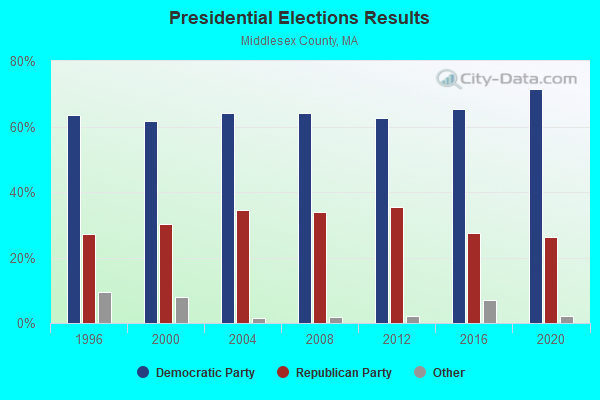
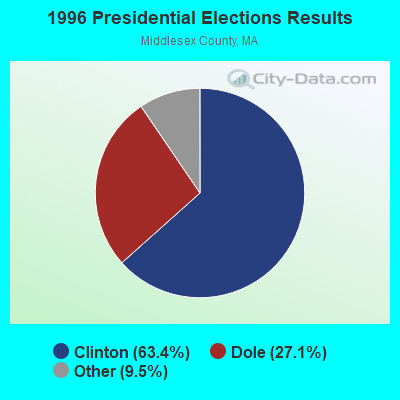
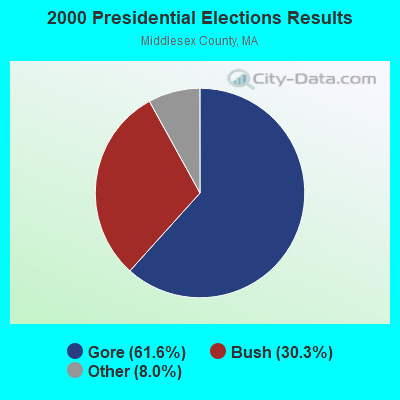


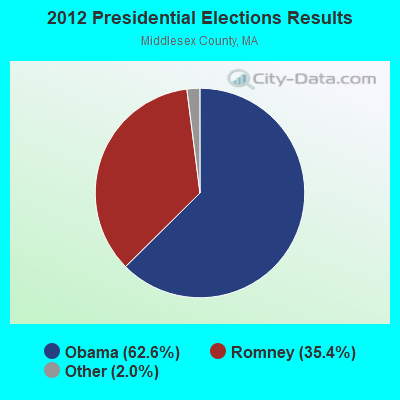


Graphs represent county-level data. Detailed 2008 Election Results
Religion statistics for Sherborn, MA (based on Middlesex County data)
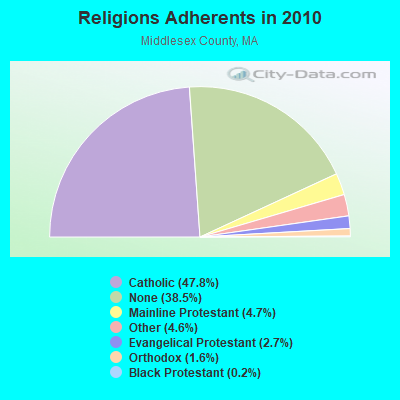
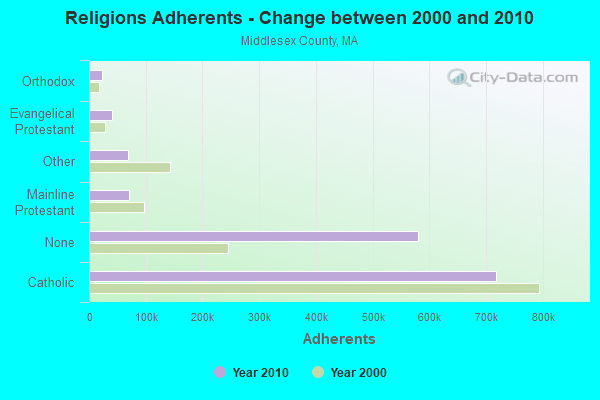
| Religion | Adherents | Congregations |
|---|---|---|
| Catholic | 718,209 | 107 |
| Mainline Protestant | 70,053 | 269 |
| Other | 68,480 | 199 |
| Evangelical Protestant | 41,270 | 304 |
| Orthodox | 23,641 | 28 |
| Black Protestant | 2,276 | 8 |
| None | 579,156 | - |
Food Environment Statistics:
| Here: | 1.71 / 10,000 pop. |
| Massachusetts: | 1.98 / 10,000 pop. |
| Middlesex County: | 0.03 / 10,000 pop. |
| State: | 0.05 / 10,000 pop. |
| Middlesex County: | 2.14 / 10,000 pop. |
| Massachusetts: | 2.22 / 10,000 pop. |
| This county: | 1.38 / 10,000 pop. |
| Massachusetts: | 1.77 / 10,000 pop. |
| Middlesex County: | 7.84 / 10,000 pop. |
| Massachusetts: | 8.76 / 10,000 pop. |
| This county: | 7.8% |
| Massachusetts: | 8.1% |
| This county: | 21.5% |
| Massachusetts: | 22.5% |
| This county: | 18.0% |
| State: | 16.5% |
6.91% of this county's 2021 resident taxpayers lived in other counties in 2020 ($102,955 average adjusted gross income)
| Here: | 6.91% |
| Massachusetts average: | 6.35% |
0.01% of residents moved from foreign countries ($137 average AGI)
Middlesex County: 0.01% Massachusetts average: 0.01%
Top counties from which taxpayers relocated into this county between 2020 and 2021:
| from Suffolk County, MA | |
| from Essex County, MA | |
| from Norfolk County, MA |
8.22% of this county's 2020 resident taxpayers moved to other counties in 2021 ($123,369 average adjusted gross income)
| Here: | 8.22% |
| Massachusetts average: | 7.18% |
0.01% of residents moved to foreign countries ($124 average AGI)
Middlesex County: 0.01% Massachusetts average: 0.02%
Top counties to which taxpayers relocated from this county between 2020 and 2021:
| to Suffolk County, MA | |
| to Essex County, MA | |
| to Worcester County, MA |
Businesses in Sherborn, MA
- Dunkin Donuts: 1
- FedEx: 1
Strongest AM radio stations in Sherborn:
- WAMG (890 AM; 25 kW; DEDHAM, MA; Owner: MEGA COMMUNICATIONS OF DEDHAM LICENSEE, LLC)
- WKOX (1200 AM; 50 kW; FRAMINGHAM, MA; Owner: CAPSTAR TX LIMITED PARTNERSHIP)
- WBIX (1060 AM; 40 kW; NATICK, MA; Owner: LANGER BROADCASTING CORPORATION)
- WEEI (850 AM; 50 kW; BOSTON, MA; Owner: ENTERCOM BOSTON LICENSE, LLC)
- WSRO (650 AM; 2 kW; ASHLAND, MA; Owner: LANGER BROADCASTING GROUP, LLC)
- WRCA (1330 AM; 25 kW; WALTHAM, MA; Owner: WRCA LICENSE, LLC)
- WRKO (680 AM; 50 kW; BOSTON, MA; Owner: ENTERCOM BOSTON LICENSE, LLC)
- WWZN (1510 AM; 50 kW; BOSTON, MA; Owner: ROSE CITY RADIO CORPORATION)
- WUNR (1600 AM; 20 kW; BROOKLINE, MA; Owner: CHAMPION BROADCASTING SYSTEMS, INC.)
- WALE (990 AM; 50 kW; GREENVILLE, RI; Owner: NORTH AMERICAN BROADCASTING CO., INC.)
- WBZ (1030 AM; 50 kW; BOSTON, MA; Owner: INFINITY BROADCASTING OPERATIONS, INC.)
- WCRN (830 AM; 50 kW; WORCESTER, MA; Owner: CARTER BROADCASTING CORPORATION)
- WNTN (1550 AM; 10 kW; NEWTON, MA; Owner: COLT COMMUNICATIONS, LLC)
Strongest FM radio stations in Sherborn:
- WBMX (98.5 FM; BOSTON, MA; Owner: INFINITY RADIO OPERATIONS INC.)
- WJMN (94.5 FM; BOSTON, MA; Owner: AMFM RADIO LICENSES, L.L.C.)
- WCRB (102.5 FM; WALTHAM, MA; Owner: CHARLES RIVER BROADCASTING WCRB LICE)
- WTKK (96.9 FM; BOSTON, MA; Owner: GREATER BOSTON RADIO, INC.)
- WROR-FM (105.7 FM; FRAMINGHAM, MA; Owner: GREATER BOSTON RADIO, INC.)
- WBOS (92.9 FM; BROOKLINE, MA; Owner: GREATER BOSTON RADIO, INC.)
- WGBH (89.7 FM; BOSTON, MA; Owner: WGBH EDUCATIONAL FOUNDATION)
- WBUR-FM (90.9 FM; BOSTON, MA; Owner: TRUSTEES OF BOSTON UNIVERSITY)
- WODS (103.3 FM; BOSTON, MA; Owner: INFINITY BROADCASTING OPERATIONS, INC.)
- WHHB (99.9 FM; HOLLISTON, MA; Owner: HOLLISTON HIGH SCHOOL)
- WXKS-FM (107.9 FM; MEDFORD, MA; Owner: AMFM RADIO LICENSES, L.L.C.)
- WMJX (106.7 FM; BOSTON, MA; Owner: GREATER BOSTON RADIO, INC.)
- WBCN (104.1 FM; BOSTON, MA; Owner: HEMISPHERE BROADCASTING CORPORATION)
- WZLX (100.7 FM; BOSTON, MA; Owner: INFINITY BROADCASTING CORPORATION OF BOSTON)
- W267AI (101.3 FM; BOSTON, MA; Owner: MCC BROADCASTING COMPANY, INC.)
- WERS (88.9 FM; BOSTON, MA; Owner: EMERSON COLLEGE)
- WZLY (91.5 FM; WELLESLEY, MA; Owner: WELLESLEY COLLEGE)
- WAAF (107.3 FM; WORCESTER, MA; Owner: ENTERCOM BOSTON LICENSE, LLC)
- WWBB (101.5 FM; PROVIDENCE, RI; Owner: CLEAR CHANNEL BROADCASTING LICENSES, INC.)
- WHRB (95.3 FM; CAMBRIDGE, MA; Owner: HARVARD RADIO BROADCASTING CO., INC.)
TV broadcast stations around Sherborn:
- WCVB-TV (Channel 5; BOSTON, MA; Owner: WCVB HEARST-ARGYLE TV, INC.)
- WGBH-TV (Channel 2; BOSTON, MA; Owner: WGBH EDUCATIONAL FOUNDATION)
- WBZ-TV (Channel 4; BOSTON, MA; Owner: VIACOM INC.)
- WGBX-TV (Channel 44; BOSTON, MA; Owner: WGBH EDUCATIONAL FOUNDATION)
- WMFP (Channel 62; LAWRENCE, MA; Owner: WSAH LICENSE, INC.)
- WSBK-TV (Channel 38; BOSTON, MA; Owner: VIACOM INC.)
- WHDH-TV (Channel 7; BOSTON, MA; Owner: WHDH-TV)
- WLVI-TV (Channel 56; CAMBRIDGE, MA; Owner: WLVI, INC.)
- WFXT (Channel 25; BOSTON, MA; Owner: FOX TELEVISION STATIONS INC.)
- W40BO (Channel 40; BOSTON, MA; Owner: PAXSON COMMUNICATIONS LPTV, INC.)
- WUTF (Channel 66; MARLBOROUGH, MA; Owner: TELEFUTURA BOSTON LLC)
- WUNI (Channel 27; WORCESTER, MA; Owner: ENTRAVISION HOLDINGS, LLC)
- WBPX (Channel 68; BOSTON, MA; Owner: PAXSON BOSTON-68 LICENSE, INC.)
- WTMU-LP (Channel 32; BOSTON, MA; Owner: ZGS BOSTON, INC.)
- WCEA-LP (Channel 58; BOSTON, MA; Owner: CHANNEL 19 TV CORPORATION)
- WWDP (Channel 46; NORWELL, MA; Owner: NORWELL TELEVISION, LLC)
- WNAC-TV (Channel 64; PROVIDENCE, RI; Owner: WNAC, LLC)
- WPRI-TV (Channel 12; PROVIDENCE, RI; Owner: TVL BROADCASTING OF RHODE ISLAND, LLC)
- WLNE-TV (Channel 6; NEW BEDFORD, MA; Owner: FREEDOM BROADCASTING OF SOUTHERN NEW ENGLAND, INC.)
- WJAR (Channel 10; PROVIDENCE, RI; Owner: OUTLET BROADCASTING, INC.)
- WSBE-TV (Channel 36; PROVIDENCE, RI; Owner: RHODE ISLAND PUBLIC TELECOM. AUTHORITY)
- WPXQ (Channel 69; BLOCK ISLAND, RI; Owner: OCEAN STATE TELEVISION, L.L.C.)
- WYDN (Channel 48; WORCESTER, MA; Owner: EDUCATIONAL PUBLIC TV CORPORATION)
- WFXZ-CA (Channel 24; BOSTON, MA; Owner: BOSTON BROADCASTING CORP.)
- National Bridge Inventory (NBI) Statistics
- 1Number of bridges
- 3ft / 0.8mTotal length
- $698,000Total costs
- 2,990Total average daily traffic
- 89Total average daily truck traffic
- 4,722Total future (year 2032) average daily traffic
FCC Registered Microwave Towers:
3- BOS1211, 16 Kendell Ave (Lat: 42.270444 Lon: -71.385194), Type: Tower, Structure height: 54.9 m, Call Sign: WQFD459,
Assigned Frequencies: 19320.0 MHz, 10915.0 MHz, Grant Date: 06/20/2006, Expiration Date: 06/20/2016, Cancellation Date: 01/25/2007, Certifier: Eric M Botto, Registrant: Fibertower Corporation, 1730 Rhode Island Avenue N.W., Suite 317, Washington, DC 20036, Phone: (703) 873-4175, Fax: (202) 315-3415, Email:
- MA-BOS5433A, 16 Kendall Avenue (Lat: 42.270417 Lon: -71.385167), Type: Tower, Structure height: 60.9 m, Call Sign: WQMC833,
Assigned Frequencies: 11015.0 MHz, 11015.0 MHz, 11055.0 MHz, 23025.0 MHz, 11135.0 MHz, 11095.0 MHz, 11175.0 MHz, 23125.0 MHz, Grant Date: 08/11/2020, Expiration Date: 06/30/2030, Cancellation Date: 09/13/2021, Certifier: Nadja S Sodos-Wallace, Registrant: T-Mobile Usa, Inc., 12920 Se 38th Street, Bellevue, WA 98006, Phone: (425) 383-8402, Fax: (425) 383-4840, Email:
- SHERBORN, Kendall And Speen Sts (Lat: 42.270444 Lon: -71.385194), Type: Tower, Structure height: 59.4 m, Call Sign: WHO995,
Assigned Frequencies: 10835.0 MHz, 10667.5 MHz, Grant Date: 03/02/2010, Expiration Date: 04/01/2020, Cancellation Date: 06/20/2017, Certifier: Carol L Tacker, Registrant: At&t Mobility LLC, 208 S Akard Street, Rm 1016, Dallas, TX 75202, Phone: (855) 699-7073, Fax: (214) 746-6410, Email:
FCC Registered Amateur Radio Licenses:
32 (See the full list of FCC Registered Amateur Radio Licenses in Sherborn)FAA Registered Aircraft:
5- Aircraft: CIRRUS DESIGN CORP SR22 (Category: Land, Seats: 4, Weight: Up to 12,499 Pounds), Engine: CONT MOTOR IO-550-N (310 HP) (Reciprocating)
N-Number: 2247R, N2247R, N-2247R, Serial Number: 4534, Year manufactured: 2017, Airworthiness Date: 10/05/2017, Certificate Issue Date: 11/06/2017
Registrant (LLC): Sherborn Aviation LLC, 26 Parks Dr, Sherborn, MA 01770 - Aircraft: CESSNA 182K (Category: Land, Seats: 4, Weight: Up to 12,499 Pounds, Speed: 119 mph), Engine: CONT MOTOR O-470 SERIES (230 HP) (Reciprocating)
N-Number: 2502R, N2502R, N-2502R, Serial Number: 18258202, Year manufactured: 1967, Airworthiness Date: 05/04/1967, Certificate Issue Date: 09/21/2000
Registrant (Co-Owned): John W Lovell, 1 Bridle Path, Sherborn, MA 01770, Other Owners: Peter H Bruen - Aircraft: CESSNA 172K (Category: Land, Seats: 4, Weight: Up to 12,499 Pounds, Speed: 105 mph), Engine: LYCOMING 0-320 SERIES (180 HP) (4 Cycle)
N-Number: 7202G, N7202G, N-7202G, Serial Number: 17258902, Year manufactured: 1969, Airworthiness Date: 12/17/1969, Certificate Issue Date: 08/14/2014
Registrant (Individual): Benjamin R Urmston, 79 Hollis St, Sherborn, MA 01770 - Aircraft: KIRCHNER LANCAIR IV P (Category: Land, Seats: 4, Weight: Up to 12,499 Pounds), Engine: CONT MOTOR IO-550 SERIES (300 HP) (Reciprocating)
N-Number: 776CM, N776CM, N-776CM, Serial Number: 1, Year manufactured: 1998, Airworthiness Date: 09/18/1998, Certificate Issue Date: 09/15/2005
Registrant (LLC): Newman Air LLC, 16 Nason Hill Ln, Sherborn, MA 01770 - Aircraft: BEECH V35A (Category: Land, Seats: 6, Weight: Up to 12,499 Pounds, Speed: 150 mph), Engine: CONT MOTOR IO 520 SERIES (285 HP) (Reciprocating)
N-Number: 8309N, N8309N, N-8309N, Serial Number: D-8720, Year manufactured: 1968, Airworthiness Date: 02/07/1968, Certificate Issue Date: 03/18/1987
Registrant (Individual): Michael Jay Newman, 16 Nason Hill Ln, Sherborn, MA 01770
2002 - 2018 National Fire Incident Reporting System (NFIRS) incidents
- Fire incident types reported to NFIRS in Sherborn, MA
- 21956.7%Outside Fires
- 12532.4%Structure Fires
- 307.8%Mobile Property/Vehicle Fires
- 123.1%Other
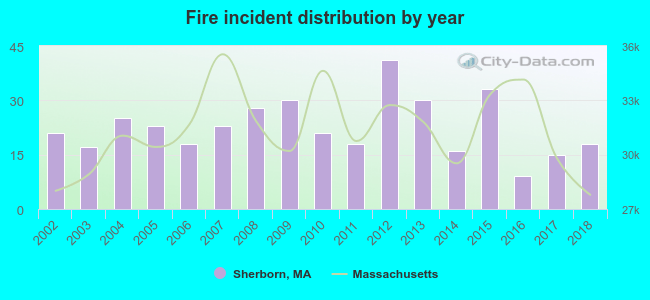 According to the data from the years 2002 - 2018 the average number of fires per year is 23. The highest number of fires - 41 took place in 2012, and the least - 9 in 2016. The data has a dropping trend.
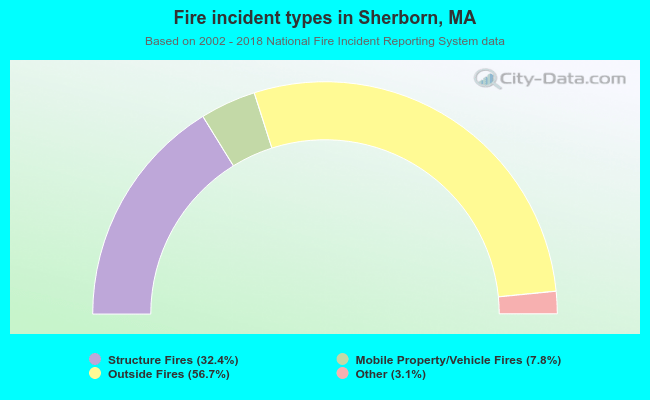 When looking into fire subcategories, the most reports belonged to: Outside Fires (56.7%), and Structure Fires (32.4%).
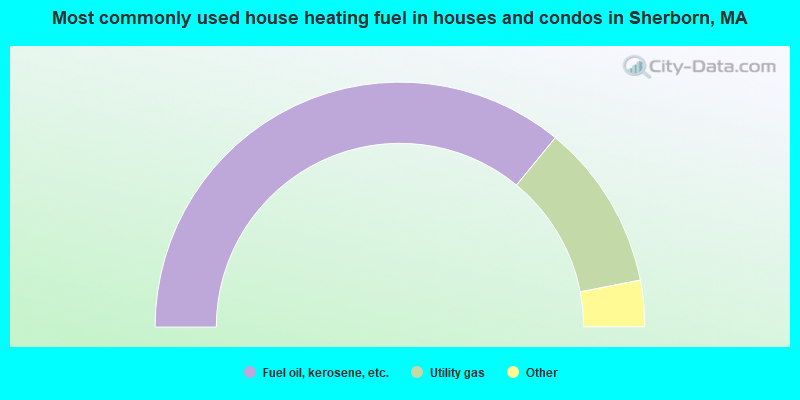
- 71.9%Fuel oil, kerosene, etc.
- 22.0%Utility gas
- 3.9%Electricity
- 0.8%Bottled, tank, or LP gas
- 0.6%Wood
- 0.5%Solar energy
- 0.4%Other fuel
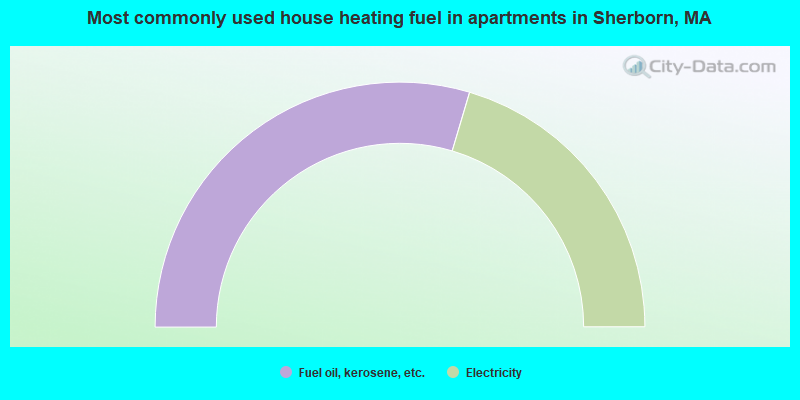
- 59.2%Fuel oil, kerosene, etc.
- 40.8%Electricity
Sherborn compared to Massachusetts state average:
- Median household income above state average.
- Median house value above state average.
- Unemployed percentage significantly below state average.
- Black race population percentage significantly below state average.
- Hispanic race population percentage significantly below state average.
- Median age above state average.
- Foreign-born population percentage significantly below state average.
- Renting percentage significantly below state average.
- Length of stay since moving in significantly above state average.
- Number of rooms per house significantly below state average.
- House age significantly below state average.
- Number of college students below state average.
- Percentage of population with a bachelor's degree or higher significantly above state average.

|
|
Total of 680 patent applications in 2008-2024.