Races in Sherborn, Massachusetts (MA) Detailed Stats
Ancestries, Foreign-born residents, place of birth

Recent posts about races in Sherborn, Massachusetts on our local forum with over 2,400,000 registered users:
 | Dover vs. Sherborn (61 replies) |
| towns that offer the most jobs per dollar of house (58 replies) |
| Boston job possibility.. (142 replies) |
| A house in Holliston or somewhere else? (from Natick) (10 replies) |
| Wellesley Asian family considering moving to Sherborn. (3 replies) |
| Thoughts on these 10 towns (92 replies) |
5.9% of Sherborn, MA residents are foreign-born (2.5% born in Europe, 2.0% born in Asia, 0.7% born in North America), which is 203.6% less than the foreign-born rate of 18.0% across the entire state of Massachusetts.
Race distribution in Sherborn

- 4,01495.6%White alone
- 1012.4%Asian alone
- 471.1%Hispanic
- 160.4%Black alone
- 170.4%Two or more races
- 40.10%Other race alone
- 10.02%American Indian alone

2000
2022
-
- 5,198,35981.9%White alone
- 428,7296.8%Hispanic
- 318,3295.0%Black alone
- 236,7863.7%Asian alone
- 110,3381.7%Two or more races
- 43,5860.7%Other race alone
- 11,2640.2%American Indian alone
- 1,7060.03%Native Hawaiian and Other
Pacific Islander alone

-
- 4,676,62767.0%White alone
- 911,03813.0%Hispanic
- 501,4637.2%Asian alone
- 459,7406.6%Black alone
- 341,8894.9%Two or more races
- 84,4031.2%Other race alone
- 5,8380.08%American Indian alone
- 9760.01%Native Hawaiian and Other
Pacific Islander alone

Income and house value in Sherborn
- Median household income in 2022
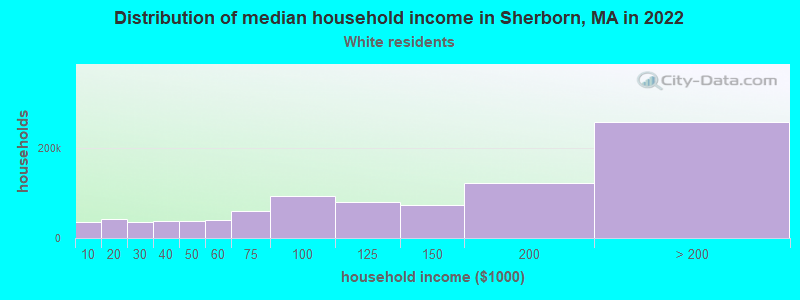
- over $200,000White non-Hispanic householders
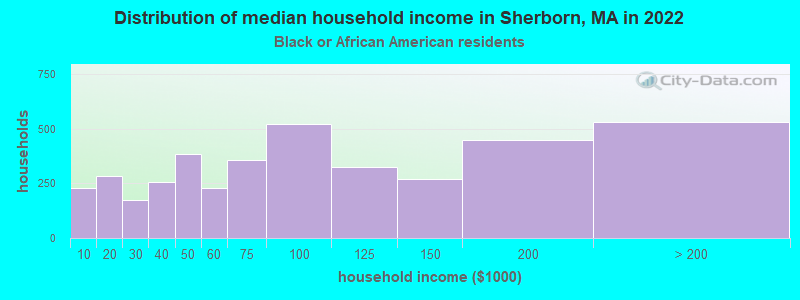
- $12,000Black householders
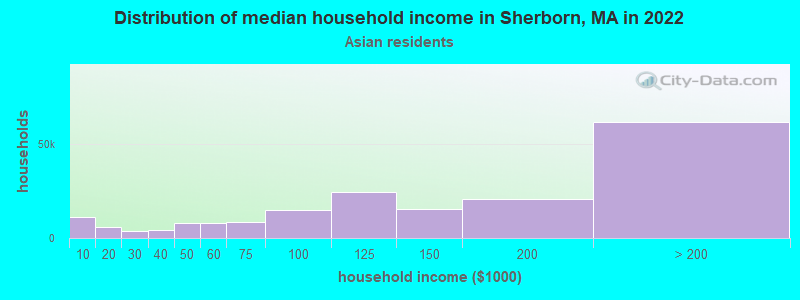
- over $200,000Asian householders
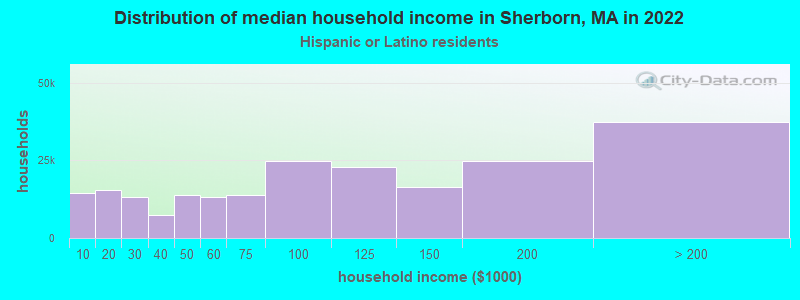
- over $200,000Hispanic or Latino race householders
- Median 2022 house value
- over $1,000,000White Non-Hispanic householders
- $635,965Black or African American householders
- over $1,000,000Asian householders
- over $1,000,000Hispanic or Latino householders
Household income for White non-Hispanic householders
Household income for Black householders
Household income for Asian householders
Household income for Hispanic or Latino race householders
Foreign-born residents in Sherborn
249 residents are foreign born (2.5% Europe, 2.0% Asia, 0.7% North America).
| This city: | 5.9% |
| Massachusetts: | 12.2% |
Ancestries in Sherborn

- 1,10620.5%English
- 81015.0%Irish
- 64512.0%Other
- 55510.3%Italian
- 4338.0%German
- 2524.7%Polish
- 2123.9%Scottish
- 2093.9%French
- 2043.8%Swedish
- 1963.6%Russian
- 1953.6%United States
- 1282.4%Scotch-Irish
- 1152.1%French Canadian
- 871.6%Dutch
- 631.2%Norwegian
- 370.7%Danish
- 290.5%Czech
- 250.5%Hungarian
- 220.4%Subsaharan African
- 170.3%Welsh
- 150.3%Ukrainian
- 140.3%Swiss
- 120.2%Arab
- 80.1%Portuguese
- 40.07%Greek
- 40.07%Lithuanian

Zip codes: 01770.