Southeast Bexar, Texas
Submit your own pictures of this place and show them to the world
- OSM Map
- General Map
- Google Map
- MSN Map

| Males: 10,566 | |
| Females: 10,864 |
| Median resident age: | 31.9 years |
| Texas median age: | 32.3 years |
Zip code: 78112
| Southeast Bexar: | $61,644 |
| TX: | $72,284 |
Estimated per capita income in 2022: $25,429 (it was $13,880 in 2000)
Southeast Bexar CCD income, earnings, and wages data
Estimated median house or condo value in 2022: $201,801 (it was $55,900 in 2000)
| Southeast Bexar: | $201,801 |
| TX: | $275,400 |
Mean prices in 2022: all housing units: $294,186; detached houses: $300,270; townhouses or other attached units: $280,916; in 2-unit structures: $328,283; in 3-to-4-unit structures: $186,623; in 5-or-more-unit structures: $233,748; mobile homes: $132,828; occupied boats, rvs, vans, etc.: $275,096
Southeast Bexar, TX residents, houses, and apartments details
Detailed information about poverty and poor residents in Southeast Bexar, TX


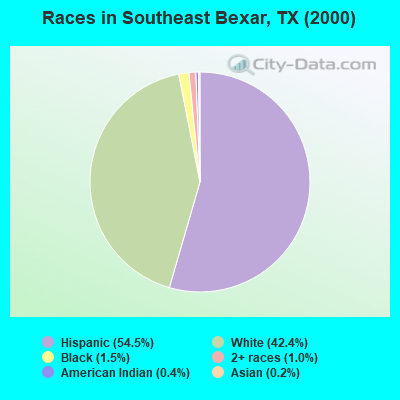
- 10,27054.5%Hispanic
- 7,99842.4%White alone
- 2771.5%Black alone
- 1801.0%Two or more races
- 690.4%American Indian alone
- 390.2%Asian alone
- 170.09%Other race alone
- 30.02%Native Hawaiian and Other
Pacific Islander alone
Races in Southeast Bexar detailed stats: ancestries, foreign born residents, place of birth
 Recent articles from our blog. Our writers, many of them Ph.D. graduates or candidates, create easy-to-read articles on a wide variety of topics.
Current Local Time: CST time zone
Land area: 137.5 square miles.
Population density: 156 people per square mile (very low).

| Southeast Bexar CCD: | 1.8% ($991) |
| Texas: | 1.8% ($1,393) |
Nearest city with pop. 50,000+: San Antonio, TX  (16.7 miles , pop. 1,144,646).
Nearest cities:
), ), Latitude: 29.25 N, Longitude: 98.36 W
Area code commonly used in this area: 830

| Here: | 3.2% |
| Texas: | 3.5% |
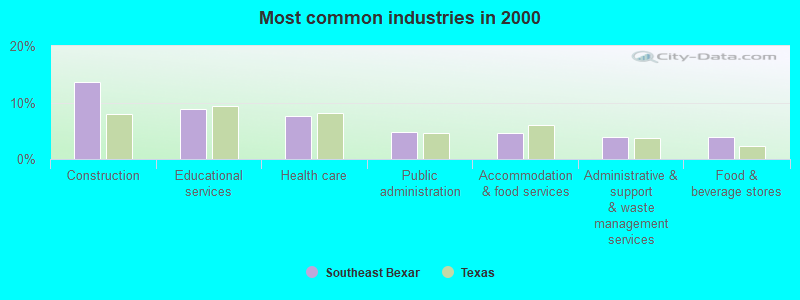
- Construction (13.5%)
- Educational services (8.9%)
- Health care (7.6%)
- Public administration (4.8%)
- Accommodation & food services (4.6%)
- Administrative & support & waste management services (3.9%)
- Food & beverage stores (3.9%)
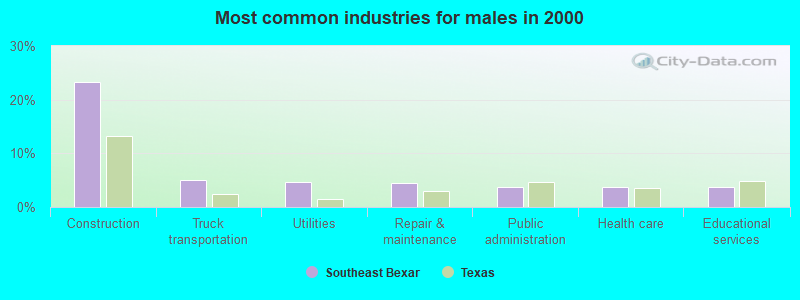
- Construction (23.3%)
- Truck transportation (5.1%)
- Utilities (4.7%)
- Repair & maintenance (4.5%)
- Public administration (3.8%)
- Health care (3.8%)
- Educational services (3.7%)
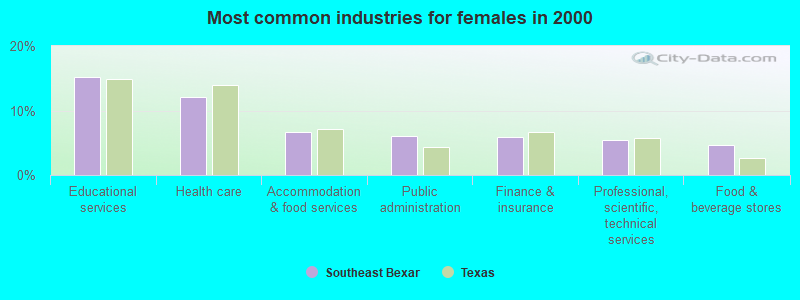
- Educational services (15.2%)
- Health care (12.1%)
- Accommodation & food services (6.7%)
- Public administration (6.0%)
- Finance & insurance (6.0%)
- Professional, scientific, technical services (5.5%)
- Food & beverage stores (4.7%)
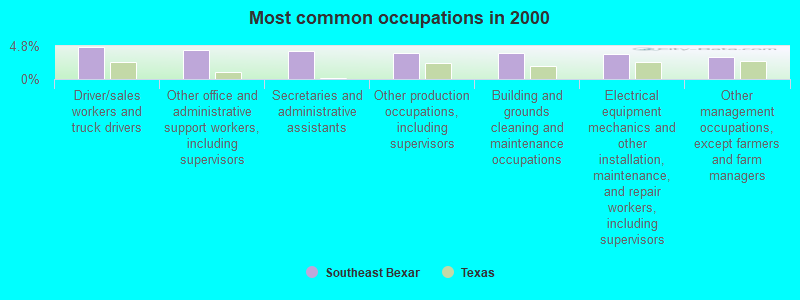
- Driver/sales workers and truck drivers (4.7%)
- Other office and administrative support workers, including supervisors (4.2%)
- Secretaries and administrative assistants (4.0%)
- Other production occupations, including supervisors (3.8%)
- Building and grounds cleaning and maintenance occupations (3.8%)
- Electrical equipment mechanics and other installation, maintenance, and repair workers, including supervisors (3.6%)
- Other management occupations, except farmers and farm managers (3.2%)
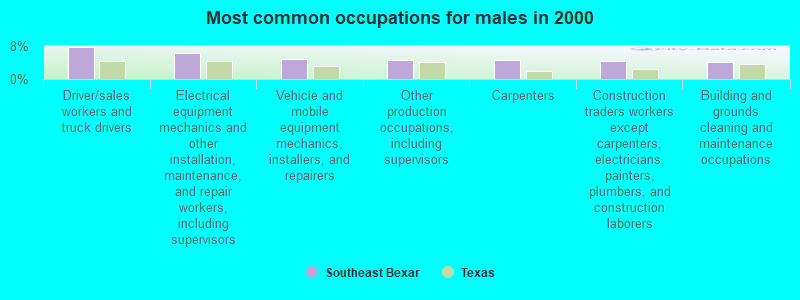
- Driver/sales workers and truck drivers (7.9%)
- Electrical equipment mechanics and other installation, maintenance, and repair workers, including supervisors (6.3%)
- Vehicle and mobile equipment mechanics, installers, and repairers (5.0%)
- Other production occupations, including supervisors (4.5%)
- Carpenters (4.5%)
- Construction traders workers except carpenters, electricians, painters, plumbers, and construction laborers (4.4%)
- Building and grounds cleaning and maintenance occupations (4.2%)
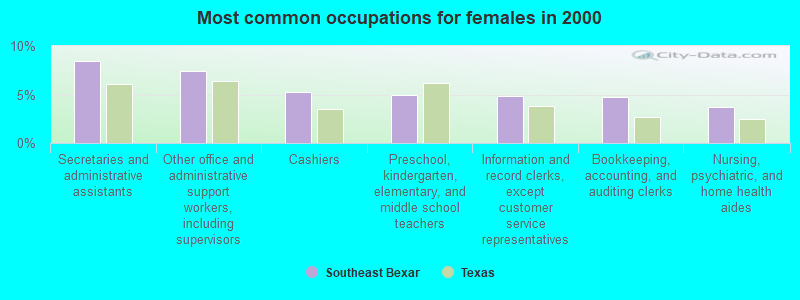
- Secretaries and administrative assistants (8.5%)
- Other office and administrative support workers, including supervisors (7.5%)
- Cashiers (5.3%)
- Preschool, kindergarten, elementary, and middle school teachers (4.9%)
- Information and record clerks, except customer service representatives (4.9%)
- Bookkeeping, accounting, and auditing clerks (4.7%)
- Nursing, psychiatric, and home health aides (3.8%)
Average climate in Southeast Bexar, Texas
Based on data reported by over 4,000 weather stations


(lower is better)
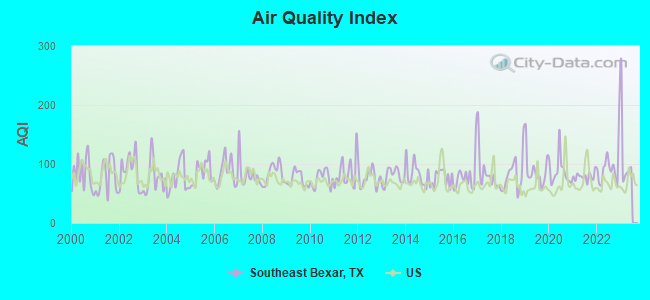
Air Quality Index (AQI) level in 2022 was 96.2. This is worse than average.
| City: | 96.2 |
| U.S.: | 72.6 |
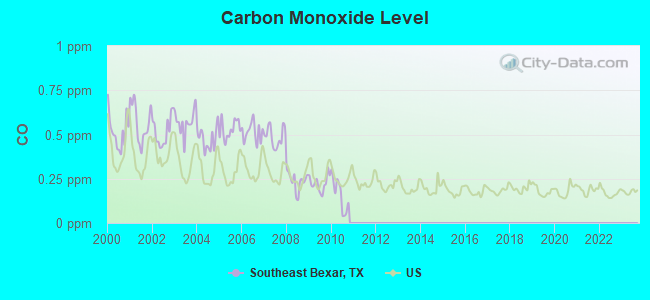
Carbon Monoxide (CO) [ppm] level in 2010 was 0.161. This is significantly better than average. Closest monitor was 7.5 miles away from the city center.
| City: | 0.161 |
| U.S.: | 0.251 |
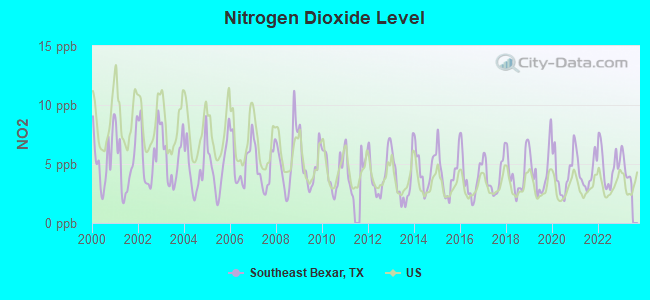
Nitrogen Dioxide (NO2) [ppb] level in 2022 was 4.85. This is about average. Closest monitor was 3.6 miles away from the city center.
| City: | 4.85 |
| U.S.: | 5.11 |
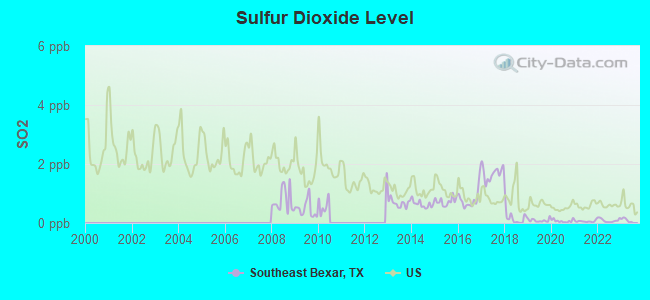
Sulfur Dioxide (SO2) [ppb] level in 2022 was 0.0888. This is significantly better than average. Closest monitor was 3.6 miles away from the city center.
| City: | 0.0888 |
| U.S.: | 1.5147 |
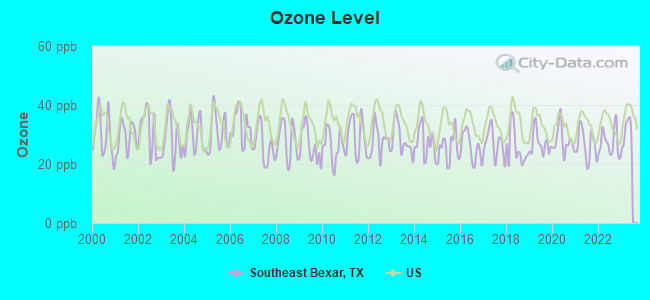
Ozone [ppb] level in 2022 was 27.2. This is better than average. Closest monitor was 3.6 miles away from the city center.
| City: | 27.2 |
| U.S.: | 33.3 |
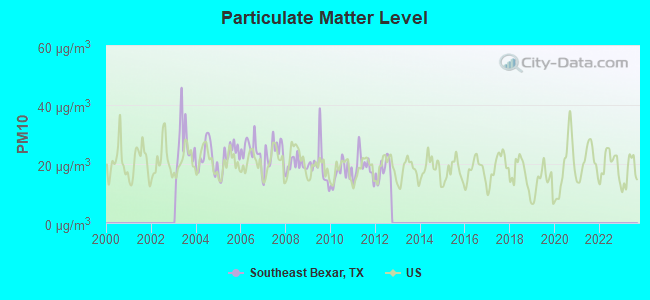
Particulate Matter (PM10) [µg/m3] level in 2012 was 18.1. This is about average. Closest monitor was 13.7 miles away from the city center.
| City: | 18.1 |
| U.S.: | 19.2 |
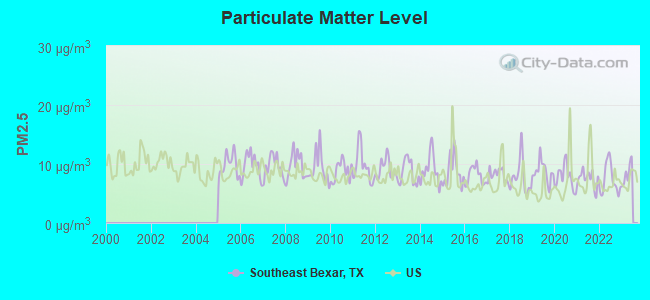
Particulate Matter (PM2.5) [µg/m3] level in 2022 was 7.36. This is about average. Closest monitor was 3.6 miles away from the city center.
| City: | 7.36 |
| U.S.: | 8.11 |
Tornado activity:
Southeast Bexar-area historical tornado activity is below Texas state average. It is 11% smaller than the overall U.S. average.
On 4/28/1953, a category F4 (max. wind speeds 207-260 mph) tornado 30.2 miles away from the Southeast Bexar place center killed 2 people and injured 15 people.
On 11/22/1961, a category F3 (max. wind speeds 158-206 mph) tornado 13.6 miles away from the place center caused between $500 and $5000 in damages.
Earthquake activity:
Southeast Bexar-area historical earthquake activity is significantly above Texas state average. It is 29% smaller than the overall U.S. average.On 10/20/2011 at 12:24:41, a magnitude 4.8 (4.8 MW, Depth: 3.1 mi, Class: Light, Intensity: IV - V) earthquake occurred 31.6 miles away from Southeast Bexar center
On 4/14/1995 at 00:32:56, a magnitude 5.7 (5.6 MB, 5.7 MS, 5.7 MW, Depth: 11.1 mi, Class: Moderate, Intensity: VI - VII) earthquake occurred 308.8 miles away from Southeast Bexar center
On 4/9/1993 at 12:29:19, a magnitude 4.3 (4.1 MB, 4.3 LG, Depth: 3.1 mi) earthquake occurred 33.5 miles away from Southeast Bexar center
On 5/1/2018 at 16:28:56, a magnitude 4.0 (4.0 MW, Depth: 3.1 mi) earthquake occurred 30.1 miles away from the city center
On 6/16/1978 at 11:46:54, a magnitude 5.3 (4.4 MB, 4.6 UK, 5.3 ML) earthquake occurred 297.8 miles away from Southeast Bexar center
On 4/7/2008 at 09:51:12, a magnitude 3.9 (3.9 MW, Depth: 3.1 mi, Class: Light, Intensity: II - III) earthquake occurred 30.2 miles away from the city center
Magnitude types: regional Lg-wave magnitude (LG), body-wave magnitude (MB), local magnitude (ML), surface-wave magnitude (MS), moment magnitude (MW)
Natural disasters:
The number of natural disasters in Bexar County (21) is greater than the US average (15).Major Disasters (Presidential) Declared: 6
Emergencies Declared: 10
Causes of natural disasters: Hurricanes: 8, Fires: 7, Floods: 3, Storms: 3, Tropical Storms: 2, Tornado: 1, Other: 1 (Note: some incidents may be assigned to more than one category).
Hospitals and medical centers near Southeast Bexar:
- SAN ANTONIO STATE HOSP STATE SCHOOL (Hospital, about 10 miles away; SAN ANTONIO, TX)
- SAN ANTONIO STATE SCHOOL (Hospital, about 10 miles away; SAN ANTONIO, TX)
- BMA SOUTHEAST SAN ANTONIO (Dialysis Facility, about 10 miles away; SAN ANTONIO, TX)
- SOUTHCROSS DIALYSIS CENTER (Dialysis Facility, about 10 miles away; SAN ANTONIO, TX)
- SAN ANTONIO STATE CHEST HOSP (Hospital, about 10 miles away; SAN ANTONIO, TX)
- TEXAS CENTER FOR INFECTIOUS DISEASE (Hospital, about 10 miles away; SAN ANTONIO, TX)
- SOUTHEAST NURSING AND REHABILITATION CENTER (Nursing Home, about 10 miles away; SAN ANTONIO, TX)
Colleges/universities with over 2000 students nearest to Southeast Bexar:
- Palo Alto College (about 13 miles; San Antonio, TX; Full-time enrollment: 5,055)
- St Philip's College (about 13 miles; San Antonio, TX; FT enrollment: 5,970)
- San Antonio College (about 16 miles; San Antonio, TX; FT enrollment: 15,182)
- Our Lady of the Lake University (about 17 miles; San Antonio, TX; FT enrollment: 2,133)
- University of the Incarnate Word (about 17 miles; San Antonio, TX; FT enrollment: 6,875)
- Trinity University (about 17 miles; San Antonio, TX; FT enrollment: 2,467)
- Northwest Vista College (about 26 miles; San Antonio, TX; FT enrollment: 9,683)
Points of interest:
Notable locations in Southeast Bexar: O W Somerset-J T Deely-J K Spruce Generating Complex (A), Salado Creek Water Resources Complex (B), V H Braunig Von Rosenberg Power Plant (C), Deeley-Sommers Power Plant (D), Kid Kountry Early Learning Center (E), East Central Schools Museum (F), Sandy Oaks Volunteer Fire Department (G), Lone Oak Volunteer Fire Department (H), South Bexar Volunteer Fire and Rescue Department (I). Display/hide their locations on the map
Churches in Southeast Bexar include: Our Lady of Mount Carmel Church (A), Parita Church (B), Boldtville Presbyterian Church (C), Borregos Chapel (D), Elmendorf First Baptist Church (E), Southside Baptist Church (F), El Carmen Church (G), Mount Carmel Chapel (H), Resurrection United Methodist Church (I). Display/hide their locations on the map
Cemeteries: Cantu Cemetery (1), Cover Cemetery (2), Arciniega Cemetery (3), Holbrecht Cemetery (4), Flores Cemetery (5), San Lorenzo Cemetery (6), Borrego Cemetery (7). Display/hide their locations on the map
Reservoirs: Soil Conservation Service Site 8 Reservoir (A), Soil Conservation Service Site 5 Reservoir (B), Victor Braunig Lake (C), Soil Conservation Service Site 10 Reservoir (D), Soil Conservation Service Site 9 Reservoir (E), Soil Conservation Service Site 3 Reservoir (F), Calaveras Lake (G), Braunig Lake (H). Display/hide their locations on the map
Rivers and creeks: Hondo Creek (A), Medina River (B), Chupaderas Creek (C), Parita Creek (D), Losoya Creek (E). Display/hide their locations on the map
Parks in Southeast Bexar include: Calaveras Lake Park (1), Southside Stadium (2), East Central Stadium (3), Braunig Park (4). Display/hide their locations on the map
| This place: | 3.1 people |
| Texas: | 2.7 people |
| This place: | 70.6% |
| Whole state: | 71.5% |
| This place: | 6.5% |
| Whole state: | 4.4% |
Likely homosexual households (counted as self-reported same-sex unmarried-partner households)
- Lesbian couples: 0.5% of all households
- Gay men: 0.2% of all households
| This place: | 18.1% |
| Whole state: | 15.4% |
| This place: | 5.8% |
| Whole state: | 6.7% |
For population 15 years and over in Southeast Bexar:
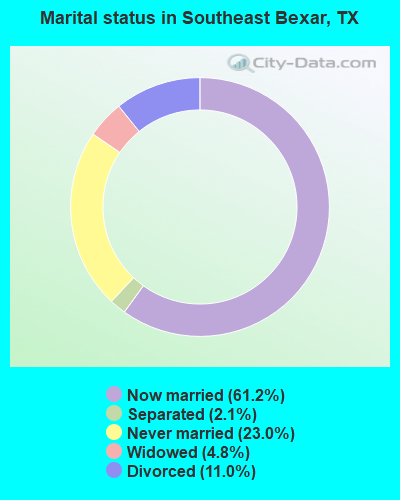
- Never married: 23.0%
- Now married: 61.2%
- Separated: 2.1%
- Widowed: 4.8%
- Divorced: 11.0%
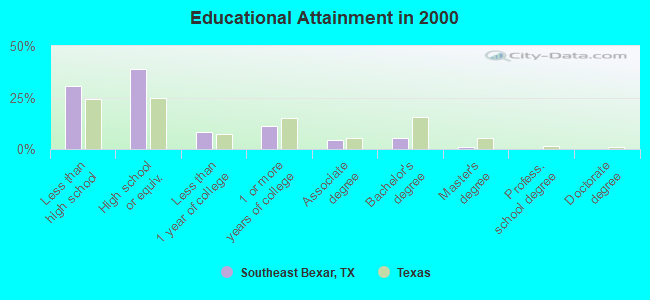
For population 25 years and over in Southeast Bexar:
- High school or higher: 69.5%
- Bachelor's degree or higher: 7.0%
- Graduate or professional degree: 1.6%
- Unemployed: 5.2%
- Mean travel time to work (commute): 31.8 minutes
| Here: | 14.4 |
| Texas average: | 15.6 |
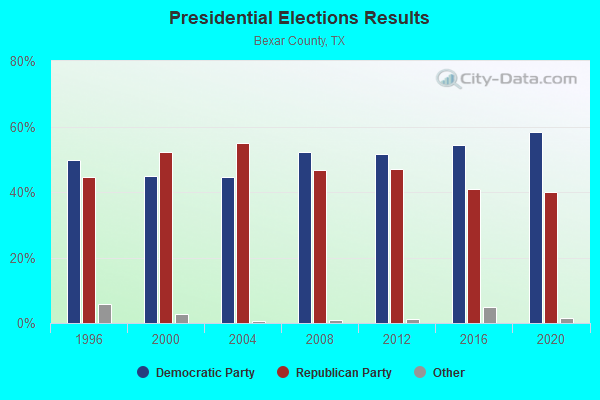
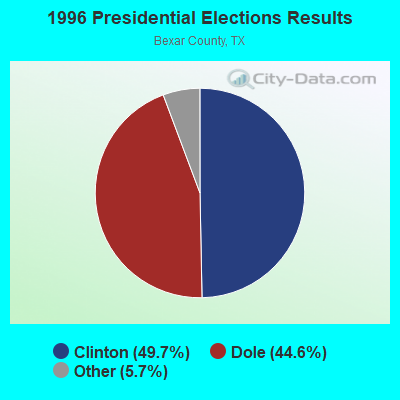
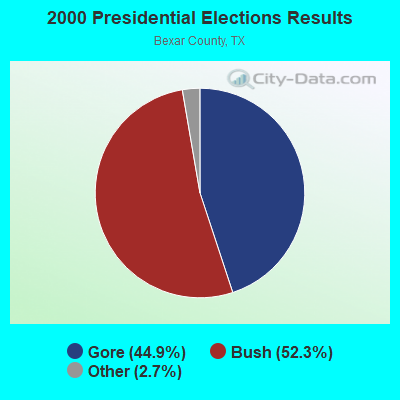
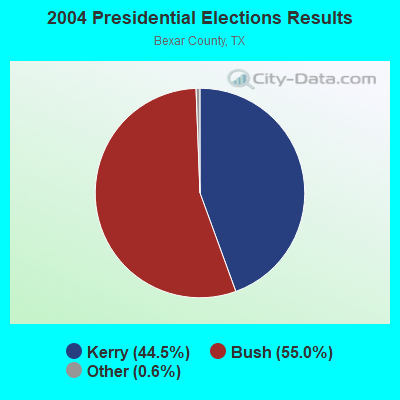
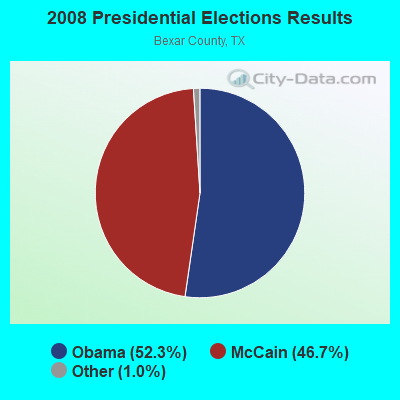

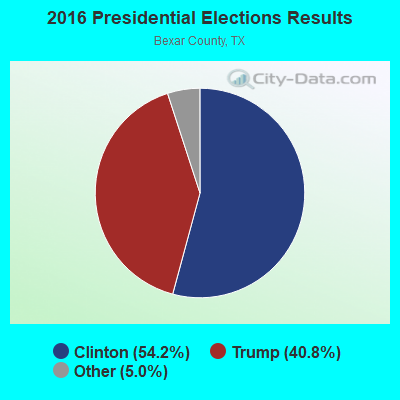
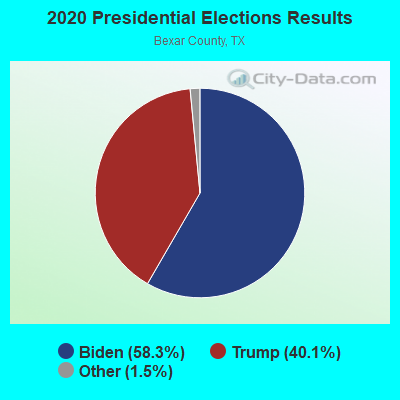
Graphs represent county-level data. Detailed 2008 Election Results
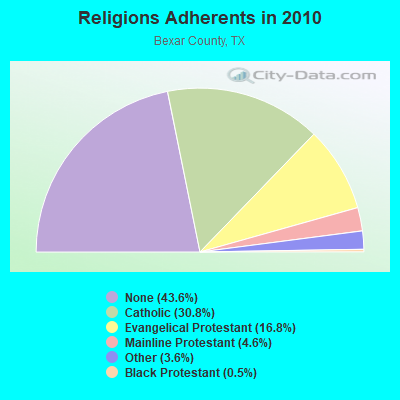
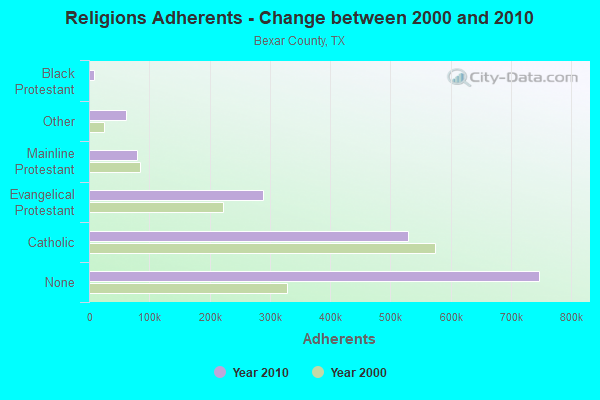
Religion statistics for Southeast Bexar, TX (based on Bexar County data)
| Religion | Adherents | Congregations |
|---|---|---|
| Catholic | 528,827 | 104 |
| Evangelical Protestant | 288,534 | 765 |
| Mainline Protestant | 78,855 | 149 |
| Other | 61,554 | 122 |
| Black Protestant | 8,961 | 42 |
| Orthodox | 1,004 | 7 |
| None | 747,038 | - |
Food Environment Statistics:
| Bexar County: | 1.02 / 10,000 pop. |
| Texas: | 1.47 / 10,000 pop. |
| Bexar County: | 0.12 / 10,000 pop. |
| Texas: | 0.14 / 10,000 pop. |
| Bexar County: | 1.14 / 10,000 pop. |
| Texas: | 1.11 / 10,000 pop. |
| Bexar County: | 3.06 / 10,000 pop. |
| State: | 3.95 / 10,000 pop. |
| Bexar County: | 6.75 / 10,000 pop. |
| Texas: | 6.13 / 10,000 pop. |
| Here: | 8.3% |
| State: | 8.9% |
| Bexar County: | 26.3% |
| State: | 26.6% |
| This county: | 16.8% |
| Texas: | 15.7% |
5.98% of this county's 2021 resident taxpayers lived in other counties in 2020 ($64,274 average adjusted gross income)
| Here: | 5.98% |
| Texas average: | 8.12% |
0.12% of residents moved from foreign countries ($1,410 average AGI)
Bexar County: 0.12% Texas average: 0.04%
Top counties from which taxpayers relocated into this county between 2020 and 2021:
| from Guadalupe County, TX | |
| from Travis County, TX | |
| from Harris County, TX |
5.48% of this county's 2020 resident taxpayers moved to other counties in 2021 ($65,369 average adjusted gross income)
| Here: | 5.48% |
| Texas average: | 7.40% |
0.09% of residents moved to foreign countries ($1,244 average AGI)
Bexar County: 0.09% Texas average: 0.03%
Top counties to which taxpayers relocated from this county between 2020 and 2021:
| to Guadalupe County, TX | |
| to Comal County, TX | |
| to Harris County, TX |
Strongest AM radio stations in Southeast Bexar:
- KTKR (760 AM; 50 kW; SAN ANTONIO, TX; Owner: CCB TEXAS LICENSES, L.P.)
- WOAI (1200 AM; 50 kW; SAN ANTONIO, TX; Owner: CCB TEXAS LICENSES, L.P.)
- KSLR (630 AM; 5 kW; SAN ANTONIO, TX; Owner: SALEM MEDIA OF TEXAS, INC.)
- KKYX (680 AM; 50 kW; SAN ANTONIO, TX; Owner: CXR HOLDINGS, INC.)
- KEDA (1540 AM; 5 kW; SAN ANTONIO, TX; Owner: D & E BROADCASTING CO., INC.)
- KONO (860 AM; 5 kW; SAN ANTONIO, TX; Owner: CXR HOLDINGS, INC.)
- KXTN (1310 AM; 5 kW; SAN ANTONIO, TX)
- KENS (1160 AM; 25 kW; SAN ANTONIO, TX; Owner: KENS-TV, INC.)
- KTSA (550 AM; 5 kW; SAN ANTONIO, TX; Owner: INFINITY BROADCASTING CORPORATION OF SAN ANTONIO)
- KSAH (720 AM; 10 kW; UNIVERSAL CITY, TX; Owner: KSAH LICENSING, INC.)
- KDRY (1100 AM; 11 kW; ALAMO HEIGHTS, TX; Owner: KDRY RADIO, INC.)
- KLUP (930 AM; 5 kW; TERRELL HILLS, TX; Owner: SOUTH TEXAS BROADCASTING, INC.)
- KCHL (1480 AM; 2 kW; SAN ANTONIO, TX; Owner: MARTIN BROADCASTING, INC.)
Strongest FM radio stations in Southeast Bexar:
- KXTN-FM (107.5 FM; SAN ANTONIO, TX; Owner: TICHENOR LICENSE CORPORATION ("TLC"))
- KROM (92.9 FM; SAN ANTONIO, TX; Owner: TICHENOR LICENSE CORPORATION ("TLC"))
- KSMG (105.3 FM; SEGUIN, TX; Owner: CXR HOLDINGS, INC.)
- KISS-FM (99.5 FM; SAN ANTONIO, TX; Owner: CXR HOLDINGS, INC.)
- KCJZ (106.7 FM; TERRELL HILLS, TX; Owner: CXR HOLDINGS, INC.)
- KLEY-FM (94.1 FM; FLORESVILLE, TX; Owner: KLEY LICENSING, INC.)
- KTFM (102.7 FM; SAN ANTONIO, TX; Owner: INFINITY BROADCASTING CORPORATION OF SAN ANTONIO)
- KQXT-FM (101.9 FM; SAN ANTONIO, TX; Owner: CCB TEXAS LICENSES, L.P.)
- KZEP-FM (104.5 FM; SAN ANTONIO, TX; Owner: TEXAS LOTUS LTD.)
- KCYY (100.3 FM; SAN ANTONIO, TX; Owner: CXR HOLDINGS, INC.)
- KBBT (98.5 FM; SCHERTZ, TX; Owner: HBC LICENSE CORPORATION)
- KXXM (96.1 FM; SAN ANTONIO, TX; Owner: CCB TEXAS LICENSES, L.P.)
- KONO-FM (101.1 FM; HELOTES, TX; Owner: CXR HOLDINGS, INC.)
- KSTX (89.1 FM; SAN ANTONIO, TX; Owner: TEXAS PUBLIC RADIO)
- KAJA (97.3 FM; SAN ANTONIO, TX; Owner: CCB TEXAS LICENSES, L.P.)
- K237AS (95.3 FM; SAN ANTONIO, TX; Owner: CXR HOLDINGS, INC.)
- KZLV (91.3 FM; LYTLE, TX; Owner: EDUCATIONAL MEDIA FOUNDATION)
- KPAC (88.3 FM; SAN ANTONIO, TX; Owner: TEXAS PUBLIC RADIO)
- KMFR (104.1 FM; PEARSALL, TX; Owner: RADIO TUNA, LTD.)
- K279AB (103.7 FM; SAN ANTONIO, TX; Owner: WILDCATTER WIRELESS, LLC)
TV broadcast stations around Southeast Bexar:
- KENS-TV (Channel 5; SAN ANTONIO, TX; Owner: KENS-TV, INC.)
- KXTM-LP (Channel 21; SAN ANTONIO, TX; Owner: HUMBERTO LOPEZ)
- WOAI-TV (Channel 4; SAN ANTONIO, TX; Owner: CCB TEXAS LICENSES, L.P.)
- KLRN (Channel 9; SAN ANTONIO, TX; Owner: ALAMO PUBLIC TELECOMMUNICATIONS COUNCIL)
- KABB (Channel 29; SAN ANTONIO, TX; Owner: KABB LICENSEE, LLC)
- KSAT-TV (Channel 12; SAN ANTONIO, TX; Owner: POST-NEWSWEEK STATIONS, SAN ANTONIO, LP)
- KVDA (Channel 60; SAN ANTONIO, TX; Owner: TELEMUNDO OF TEXAS PARTNERSHIP, LP)
- KWEX-TV (Channel 41; SAN ANTONIO, TX; Owner: KWEX LICENSE PARTNERSHIP, L.P.)
- KSAA-LP (Channel 28; SAN ANTONIO, TX; Owner: MAKO COMMUNICATIONS, LLC)
- KHCE (Channel 23; SAN ANTONIO, TX; Owner: SAN ANTONIO COMMUNITY EDUCATIONAL TV, INC.)
- KFTO-CA (Channel 67; SAN ANTONIO, TX; Owner: TELEFUTURA PARTNERSHIP OF SAN ANTONIO)
- KQVE-LP (Channel 46; La VERNIA, TX; Owner: WORD OF GOD FELLOWSHIP, INC.)
- K45DX (Channel 45; FLORESVILLE, TX; Owner: TELEFUTURA PARTNERSHIP OF FLORESVILLE)
- KRRT (Channel 35; KERRVILLE, TX; Owner: SAN ANTONIO (KRRT-TV) LICENSEE, INC.)
- KJLF-LP (Channel 7; SAN ANTONIO, TX; Owner: B COMMUNICATIONS JOINT VENTURE)
- KNIC-CA (Channel 17; SAN ANTONIO, TX; Owner: TELEFUTURA PARTNERSHIP OF SAN ANTONIO)
- K52EA (Channel 52; SAN ANTONIO, TX; Owner: ORTIZ BROADCASTING CORPORATION)
- KMHZ-LP (Channel 65; SAN ANTONIO, TX; Owner: LOUIS MARTINEZ FAMILY GROUP, LLC)
- KBNB-LP (Channel 10; SAN ANTONIO, TX; Owner: B COMMUNICATIONS JOINT VENTURE)
- K31EX (Channel 31; SAN ANTONIO, TX; Owner: MAKO COMMUNICATIONS, LLC)
- KGMM-CA (Channel 58; SAN ANTONIO, TX; Owner: CABALLERO TELEVISION TEXAS, L.L.C.)
- KPXL (Channel 26; UVALDE, TX; Owner: PAXSON SAN ANTONIO LICENSE, INC.)
- KTDF-LP (Channel 18; SAN ANTONIO, TX; Owner: JOSEPH W. SHAFFER)
- K57GO (Channel 57; SAN ANTONIO, TX; Owner: THREE ANGELS BROADCASTING NETWORK)
- KOBS-LP (Channel 43; SAN ANTONIO, TX; Owner: CLARK ORTIZ)
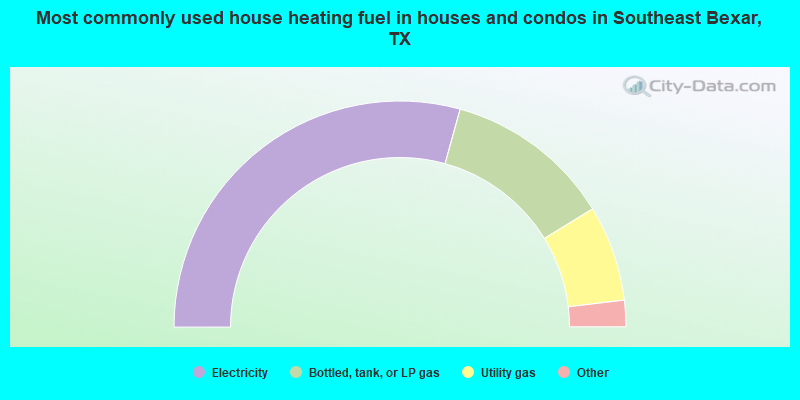
- 58.6%Electricity
- 23.9%Bottled, tank, or LP gas
- 13.7%Utility gas
- 1.9%Wood
- 1.6%Other fuel
- 0.3%No fuel used
- 0.1%Fuel oil, kerosene, etc.
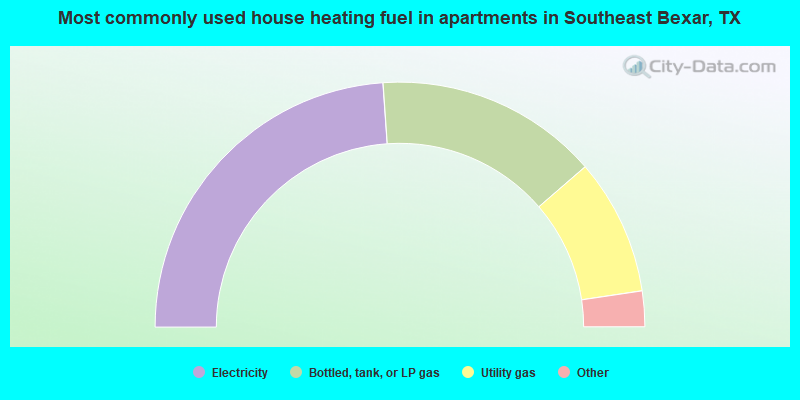
- 47.8%Electricity
- 29.5%Bottled, tank, or LP gas
- 18.0%Utility gas
- 2.5%Wood
- 1.1%Fuel oil, kerosene, etc.
- 0.7%No fuel used
- 0.5%Other fuel
Southeast Bexar compared to Texas state average:
- Unemployed percentage below state average.
- Black race population percentage significantly below state average.
- Foreign-born population percentage significantly below state average.
- Renting percentage significantly below state average.
- Length of stay since moving in significantly above state average.
- Number of rooms per house significantly below state average.
- House age significantly below state average.
- Percentage of population with a bachelor's degree or higher significantly below state average.
Southeast Bexar on our top lists:
- #21 on the list of "Top 101 cities with largest percentage of females in industries: machinery, equipment, and supplies merchant wholesalers (population 5,000+)"
- #41 on the list of "Top 101 cities with largest percentage of males in occupations: electricians (population 5,000+)"
- #45 on the list of "Top 101 cities with largest percentage of males in industries: drugs, sundries, and chemical and allied products merchant wholesalers (population 5,000+)"
- #59 on the list of "Top 101 cities with largest percentage of males in occupations: painters and paperhangers (population 5,000+)"
- #63 on the list of "Top 101 cities with largest percentage of males in occupations: supervisors of transportation and material moving workers (population 5,000+)"
- #63 on the list of "Top 101 cities with the largest percentage of mobile homes (2,000+ housing units)"
- #68 on the list of "Top 101 cities with largest percentage of females in occupations: other transportation workers (population 5,000+)"
- #68 on the list of "Top 101 cities with largest percentage of females in occupations: vehicle and mobile equipment mechanics, installers, and repairers (population 5,000+)"
- #72 on the list of "Top 101 cities with largest percentage of males in industries: furniture and home furnishing merchant wholesalers (population 5,000+)"
- #75 on the list of "Top 101 cities with largest percentage of females in occupations: other healthcare support occupations (population 5,000+)"
- #76 on the list of "Top 101 cities with largest percentage of females in industries: motor vehicles, parts and supplies merchant wholesalers (population 5,000+)"
- #84 on the list of "Top 101 cities with largest percentage of males in industries: warehousing and storage (population 5,000+)"
- #85 on the list of "Top 101 cities with largest percentage of males in industries: truck transportation (population 5,000+)"
- #89 on the list of "Top 101 cities with largest percentage of females in industries: truck transportation (population 5,000+)"
- #93 on the list of "Top 101 cities with largest percentage of males in industries: motor vehicles, parts and supplies merchant wholesalers (population 5,000+)"
- #94 on the list of "Top 101 cities with largest percentage of females in industries: music stores (population 5,000+)"
- #95 on the list of "Top 101 cities with largest percentage of males in industries: recyclable material merchant wholesalers (population 5,000+)"
- #99 on the list of "Top 101 cities with largest percentage of males in industries: food (population 5,000+)"
- #8 on the list of "Top 101 counties with the highest ground withdrawal of fresh water for public supply"
- #11 on the list of "Top 101 counties with the most Evangelical Protestant adherents"
- #11 on the list of "Top 101 counties with the most Evangelical Protestant congregations"
- #12 on the list of "Top 101 counties with the lowest surface withdrawal of fresh water for public supply (pop. 50,000+)"
- #13 on the list of "Top 101 counties with the most Catholic adherents (pop. 50,000+)"