Southeast Bexar, TX (Texas) Houses and Residents
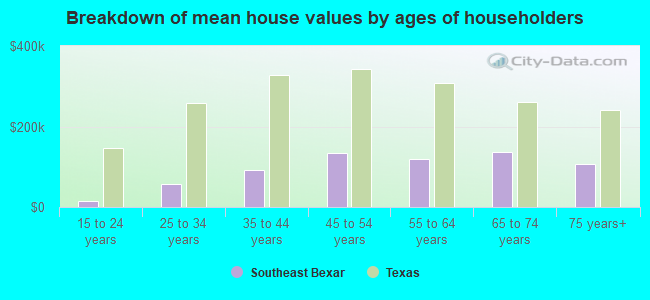
| Southeast Bexar: | $201,801 |
| Texas: | $275,400 |
Total population: 21,430 (Urban population: 421, Rural population: 18,432 (268 farm, 18,164 nonfarm))
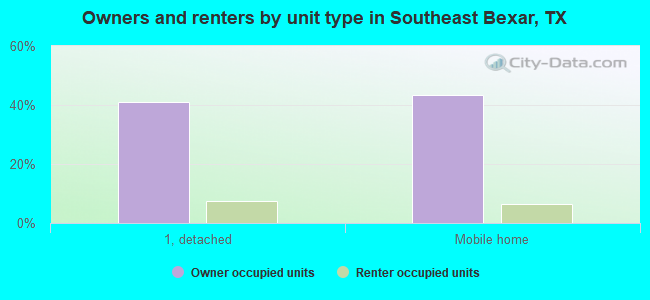
Houses: 6,560 (5,991 occupied: 5,146 owner occupied, 845 renter occupied)
| % of renters here: | 14% |
| State: | 38% |
Housing density: 48 houses/condos per square mile
Median price asked for vacant for-sale houses and condos in 2022 in this county: $410,780.
Median contract rent in 2022: $843 (lower quartile is $628, upper quartile is $1,017)
Median rent asked for vacant for-rent units in 2022: $782
Median gross rent in Southeast Bexar, TX in 2022: $1,053
Housing units in Southeast Bexar with a mortgage: 943 (34 second mortgage, 73 home equity loan, 0 both second mortgage and home equity loan)
Houses without a mortgage: 1,044
Compare current foreclosures near Southeast Bexar, TX:
| Photo | Address | Area | Beds / Baths | Price | Details |
|---|---|---|---|---|---|

|
#1
Treehouse Dr
San Antonio, TX 78222
|
1,342 sq. feet
|
2 baths 3 beds |
$204,250
|
show details |

|
#2
Sunrise Pass
San Antonio, TX 78244
|
912 sq. feet
|
1 baths 3 beds |
$40,600
|
show details |

|
#3
S Flores St Ste 2102
San Antonio, TX 78204
|
758 sq. feet
|
1 baths 1 beds |
show details | |

|
#4
8th St
Floresville, TX 78114
|
1,197 sq. feet
|
1 baths 3 beds |
show details | |

|
#5
Arizona
San Antonio, TX 78207
|
910 sq. feet
|
1 baths 3 beds |
show details | |

|
#6
King Ave
San Antonio, TX 78211
|
2,165 sq. feet
|
2 baths 3 beds |
show details | |

|
#7
Calais Dr
San Antonio, TX 78224
|
- sq. feet
|
2 baths 3 beds |
show details | |

|
#8
Kate Schenck Ave
San Antonio, TX 78223
|
1,434 sq. feet
|
2 baths 3 beds |
show details | |

|
#9
W Mistletoe Ave
San Antonio, TX 78212
|
1,132 sq. feet
|
1 baths 2 beds |
show details | |

|
#10
Eight Iron
San Antonio, TX 78221
|
- sq. feet
|
2 baths 3 beds |
show details |
| Photo | Address | Area | Beds / Baths | Price | Details |
|---|---|---|---|---|---|

|
#11
Legend Point Dr
San Antonio, TX 78244
|
4,170 sq. feet
|
3 baths 5 beds |
show details | |

|
#12
Fenfield Ave
San Antonio, TX 78211
|
1,147 sq. feet
|
1 baths 2 beds |
show details | |

|
#13
Mission Rd
San Antonio, TX 78214
|
2,252 sq. feet
|
2 baths 4 beds |
show details | |

|
#14
Malakoff
Converse, TX 78109
|
1,211 sq. feet
|
2 baths 3 beds |
show details | |

|
#15
Wycliff Dr
San Antonio, TX 78220
|
1,407 sq. feet
|
2 baths 3 beds |
show details | |

|
#16
Pima S 1
San Antonio, TX 78211
|
1,672 sq. feet
|
1 baths 2 beds |
show details | |

|
#17
Encino Torcido
Adkins, TX 78101
|
1,200 sq. feet
|
2 baths 3 beds |
show details | |

|
#18
Prairie Flower St
San Antonio, TX 78242
|
- sq. feet
|
2 baths 3 beds |
show details | |

|
#19
Catalina Sunrise Dr
San Antonio, TX 78244
|
1,484 sq. feet
|
2 baths 4 beds |
show details | |

|
#20
Koehler Ct
San Antonio, TX 78223
|
1,296 sq. feet
|
2 baths 4 beds |
show details |
| Photo | Address | Area | Beds / Baths | Price | Details |
|---|---|---|---|---|---|

|
#21
Tumbleweed Ln
San Antonio, TX 78264
|
- sq. feet
|
4 baths 4 beds |
show details | |

|
#22
Langford Pl
San Antonio, TX 78221
|
1,948 sq. feet
|
2 baths 4 beds |
show details | |

|
#23
Cenizo
San Antonio, TX 78264
|
1,976 sq. feet
|
2 baths 3 beds |
show details | |

|
#24
Madrid St
San Antonio, TX 78237
|
912 sq. feet
|
1 baths 3 beds |
show details | |

|
#25
Karen Ln
Poteet, TX 78065
|
1,992 sq. feet
|
2 baths 4 beds |
show details | |

|
#26
King Ave
San Antonio, TX 78211
|
7,056 sq. feet
|
2 baths 3 beds |
show details | |

|
#27
Jackson Smt
Converse, TX 78109
|
1,428 sq. feet
|
2 baths 3 beds |
show details | |

|
#28
Nubuck Br
Converse, TX 78109
|
1,845 sq. feet
|
2 baths 4 beds |
show details | |

|
#29
Autumn Lk
San Antonio, TX 78222
|
1,448 sq. feet
|
2 baths 3 beds |
show details | |

|
#30
Wrangler Vw
San Antonio, TX 78223
|
- sq. feet
|
2 baths 3 beds |
show details |
| Photo | Address | Area | Beds / Baths | Price | Details |
|---|---|---|---|---|---|

|
#31
Shady Lake Dr
San Antonio, TX 78244
|
1,309 sq. feet
|
2 baths 3 beds |
show details | |

|
#32
Stetson Vw
San Antonio, TX 78223
|
2,242 sq. feet
|
2 baths 3 beds |
show details | |

|
#33
Crestwood Hill Dr
San Antonio, TX 78244
|
1,830 sq. feet
|
3 baths 3 beds |
show details | |

|
#34
Guadalupe Ybarra St
San Antonio, TX 78207
|
1,054 sq. feet
|
2 baths 3 beds |
show details | |

|
#35
Christine Dr
San Antonio, TX 78223
|
1,050 sq. feet
|
1 baths 2 beds |
show details | |

|
#36
Eight Iron
San Antonio, TX 78221
|
- sq. feet
|
4 baths 5 beds |
show details | |

|
#37
Highland Grass
Converse, TX 78109
|
2,278 sq. feet
|
2 baths 4 beds |
show details | |

|
#38
Bloomdale
San Antonio, TX 78218
|
1,720 sq. feet
|
2 baths 4 beds |
show details | |

|
#39
Green Lake Dr
San Antonio, TX 78223
|
1,849 sq. feet
|
3 baths 3 beds |
show details | |

|
#40
Blue Wing Rd
San Antonio, TX 78223
|
1,661 sq. feet
|
3 baths 3 beds |
show details |
| Photo | Address | Area | Beds / Baths | Price | Details |
|---|---|---|---|---|---|

|
#41
Quail Ln
Floresville, TX 78114
|
- sq. feet
|
2 baths 4 beds |
show details | |

|
#42
Antrim Dr
San Antonio, TX 78218
|
1,509 sq. feet
|
1 baths 3 beds |
show details | |

|
#43
Lyro Fields
Converse, TX 78109
|
2,451 sq. feet
|
2 baths 3 beds |
show details | |

|
#44
Kody Creek
San Antonio, TX 78263
|
3,344 sq. feet
|
4 baths 4 beds |
show details | |

|
#45
Pleasanton Rd
San Antonio, TX 78214
|
1,459 sq. feet
|
2 baths 4 beds |
show details | |

|
#46
Gaddis Blvd
San Antonio, TX 78224
|
2,360 sq. feet
|
2 baths 4 beds |
show details | |

|
#47
Halsey St
San Antonio, TX 78221
|
928 sq. feet
|
1 baths 2 beds |
show details | |

|
#48
Nevada St
San Antonio, TX 78203
|
1,949 sq. feet
|
1 baths 2 beds |
show details | |

|
#49
Fargo Ave
San Antonio, TX 78220
|
901 sq. feet
|
1 baths 3 beds |
show details | |

|
Check over 1 million property listings on Foreclosure.com!
|
browse all offers | |||

Household type by relationship:
Households: 1,672,772- In family households: 1,430,813 (268,679 male householders, 147,677 female householders)
280,683 spouses, 544,939 children (504,375 natural, 11,846 adopted, 28,718 stepchildren), 60,968 grandchildren, 22,151 brothers or sisters, 17,750 parents, foster children, 28,231 other relatives, 42,912 non-relatives
- In nonfamily households: 241,959 (93,348 male householders (71,709 living alone)), 99,227 female householders (82,300 living alone)), 49,384 nonrelatives
- In group quarters: 42,001 (15,632 institutionalized population)
241,149 married couples with children.
99,793 single-parent households (18,735 men, 81,058 women).
60.1% of residents of Southeast Bexar speak English at home.
38.9% of residents speak Spanish at home (67% speak English very well, 21% speak English well, 9% speak English not well, 3% don't speak English at all).
0.7% of residents speak other Indo-European language at home (83% speak English very well, 15% speak English well, 2% don't speak English at all).
0.2% of residents speak Asian or Pacific Island language at home (95% speak English very well, 5% speak English well).
0.1% of residents speak other language at home (21% speak English very well, 79% speak English not well).
Foreign born population: 2,245 (8.1%)
(31.1% of them are naturalized citizens)
| Here: | 6.3 |
| State: | 6.3 |
| Here: | 5.3 |
| State: | 4.0 |
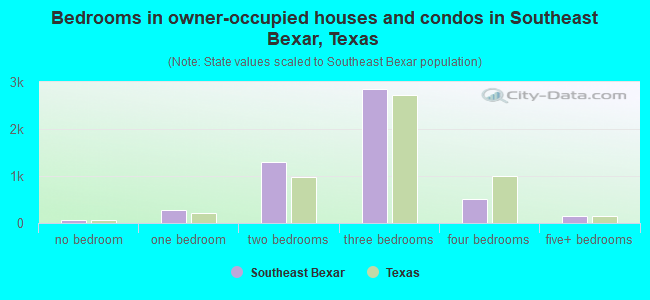
- Bedrooms in owner-occupied houses and condos in Southeast Bexar, Texas
- 74no bedroom
- 2731 bedroom
- 1,2962 bedrooms
- 2,8543 bedrooms
- 5064 bedrooms
- 1435+ bedrooms
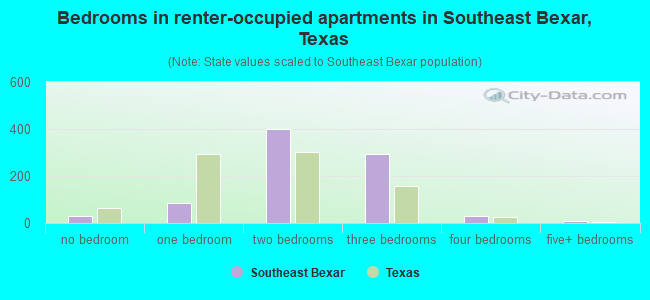
- Bedrooms in renter-occupied apartments in Southeast Bexar, Texas
- 31no bedroom
- 841 bedroom
- 4022 bedrooms
- 2933 bedrooms
- 284 bedrooms
- 75+ bedrooms
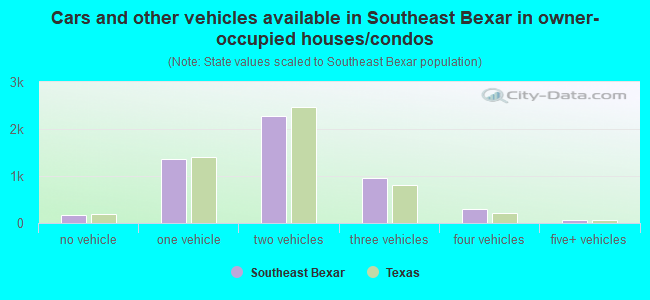
- Cars and other vehicles available in Southeast Bexar in owner-occupied houses/condos
- 169no vehicle
- 1,3641 vehicle
- 2,2732 vehicles
- 9663 vehicles
- 3064 vehicles
- 685+ vehicles
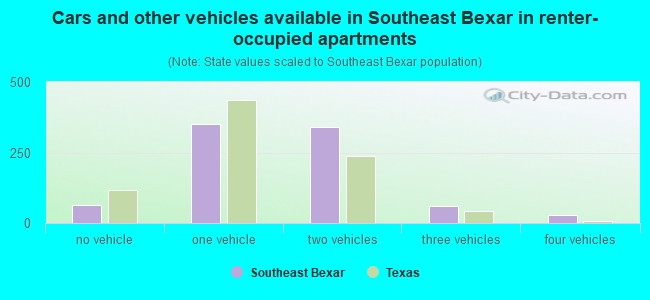
- Cars and other vehicles available in Southeast Bexar in renter-occupied apartments
- 64no vehicle
- 3511 vehicle
- 3412 vehicles
- 603 vehicles
- 294 vehicles
- 05+ vehicles
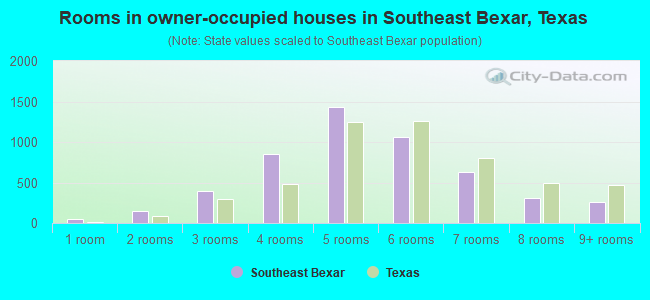
- Rooms in owner-occupied houses in Southeast Bexar, Texas
- 541 room
- 1492 rooms
- 3923 rooms
- 8574 rooms
- 1,4335 rooms
- 1,0656 rooms
- 6257 rooms
- 3128 rooms
- 2599+ rooms
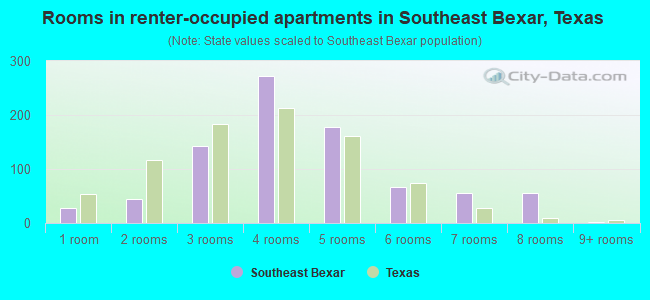
- Rooms in renter-occupied apartments in Southeast Bexar, Texas
- 271 room
- 452 rooms
- 1433 rooms
- 2724 rooms
- 1785 rooms
- 676 rooms
- 567 rooms
- 558 rooms
- 29+ rooms
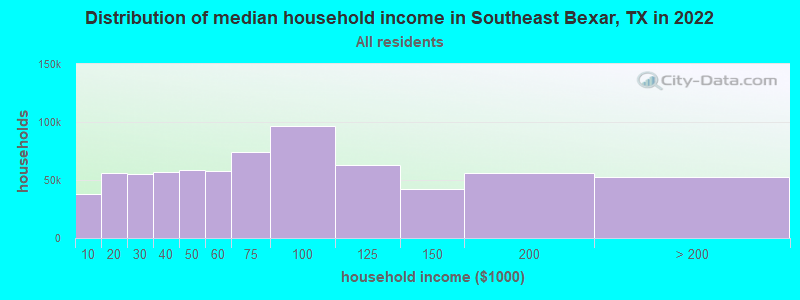
Southeast Bexar, TX household income distribution

- 37,599Less than $10,000
- 56,120$10,000 to $19,999
- 55,358$20,000 to $29,999
- 57,266$30,000 to $39,999
- 58,642$40,000 to $49,999
- 57,476$50,000 to $59,999
- 73,821$60,000 to $74,999
- 96,510$75,000 to $99,999
- 62,941$100,000 to $124,999
- 42,228$125,000 to $149,999
- 56,124$150,000 to $199,999
- 52,308$200,000 or more
Percentage of workers working in this county: 92.4%
Number of people working at home: 1,883 (14.7% of all workers)
Travel time to work (commute)
- Less than 5 minutes: 146
- 5 to 9 minutes: 232
- 10 to 14 minutes: 363
- 15 to 19 minutes: 565
- 20 to 24 minutes: 939
- 25 to 29 minutes: 720
- 30 to 34 minutes: 2,106
- 35 to 39 minutes: 456
- 40 to 44 minutes: 350
- 45 to 59 minutes: 1,109
- 60 to 89 minutes: 325
- 90 or more minutes: 230
Means of transportation to work:
- Drove a car alone: 5,750 (74.2%)
- Carpooled: 1,551 (20.0%)
- Bus or trolley bus: 55 (0.7%)
- Taxi: 2 (0.0%)
- Motorcycle: 4 (0.1%)
- Bicycle: 7 (0.1%)
- Walked: 106 (1.4%)
- Other means: 66 (0.9%)
- Worked at home: 210 (2.7%)
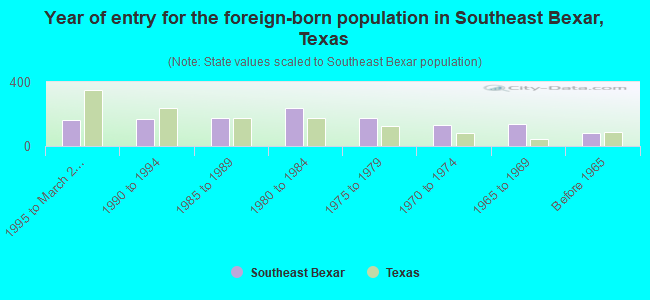
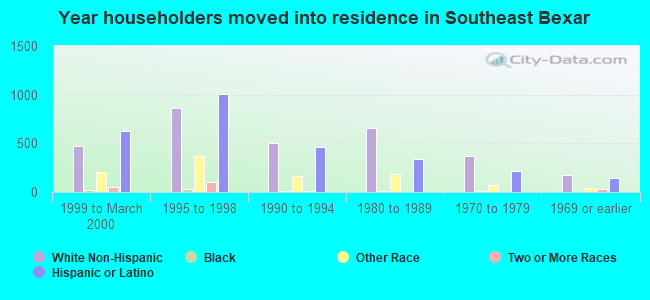
- Year of entry for the foreign-born population in Southeast Bexar, Texas
- 1641995 to March 2000
- 1701990 to 1994
- 1751985 to 1989
- 2401980 to 1984
- 1751975 to 1979
- 1341970 to 1974
- 1391965 to 1969
- 84Before 1965
Most common places of birth for foreign-born residents (%):
| Southeast Bexar: | 89.5% (1,146) |
| Texas: | 64.8% (1,879,369) |
| Southeast Bexar: | 1.6% (21) |
| Texas: | 3.5% (101,259) |
Place of birth for U.S.-born residents:
- This state: 15,205
- Other state: 2,174
- Northeast: 193
- Midwest: 617
- South: 730
- West: 634
61% of Southeast Bexar residents lived in the same house 5 years ago.
Out of people who lived in different houses, 80% lived in this county.
Out of people who lived in different counties, 66% lived in Texas.
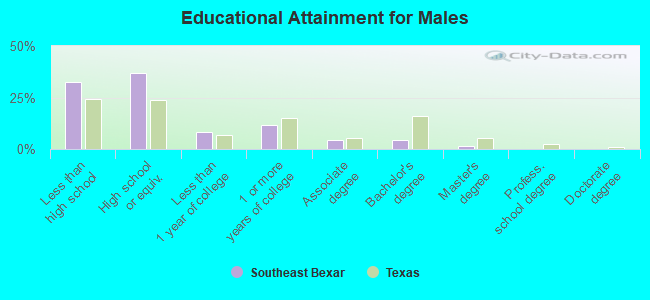
Education attainment for males 25 years and older:
- No schooling: 213
- Nursery to 4th grade: 91
- 5th and 6th grade: 161
- 7th and 8th grade: 313
- 9th grade: 216
- 10th grade: 230
- 11th grade: 228
- 12th grade, no diploma: 292
- High school graduate (or equivalency): 1,977
- Less than 1 year of college: 443
- Some college more than 1 year, no degree: 627
- Associate degree: 225
- Bachelor's degree: 236
- Master's degree: 75
- Professional school degree: 0
- Doctorate degree: 9
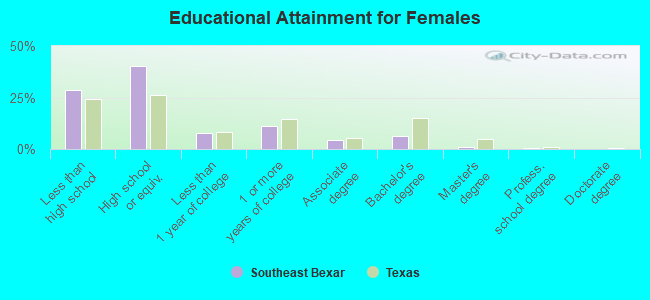
Education attainment for females 25 years and older:
- No schooling: 188
- Nursery to 4th grade: 98
- 5th and 6th grade: 201
- 7th and 8th grade: 264
- 9th grade: 248
- 10th grade: 264
- 11th grade: 199
- 12th grade, no diploma: 148
- High school graduate (or equivalency): 2,294
- Less than 1 year of college: 439
- Some college more than 1 year, no degree: 621
- Associate degree: 244
- Bachelor's degree: 364
- Master's degree: 54
- Professional school degree: 23
- Doctorate degree: 11


Housing units in structures:
- One, detached: 3,201
- One, attached: 42
- Two: 21
- 3 or 4: 2
- 5 to 9: 3
- Mobile homes: 3,252
- Boats, RVs, vans, etc.: 39
Median worth of mobile homes: $103,533
Housing units lacking complete kitchen facilities: 2.7%
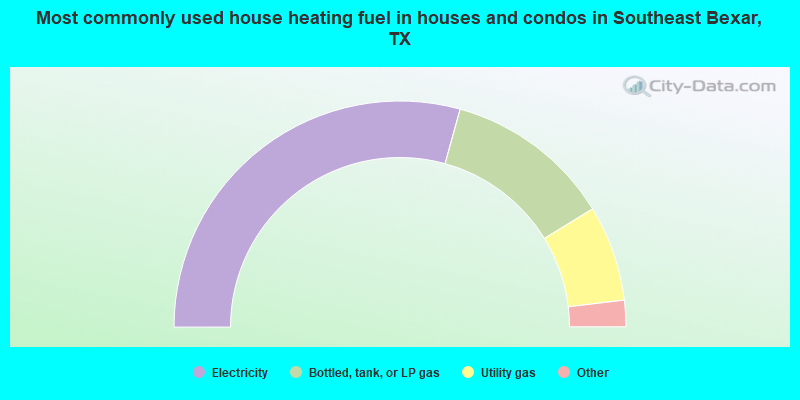
- 58.6%Electricity
- 23.9%Bottled, tank, or LP gas
- 13.7%Utility gas
- 1.9%Wood
- 1.6%Other fuel
- 0.3%No fuel used
- 0.1%Fuel oil, kerosene, etc.
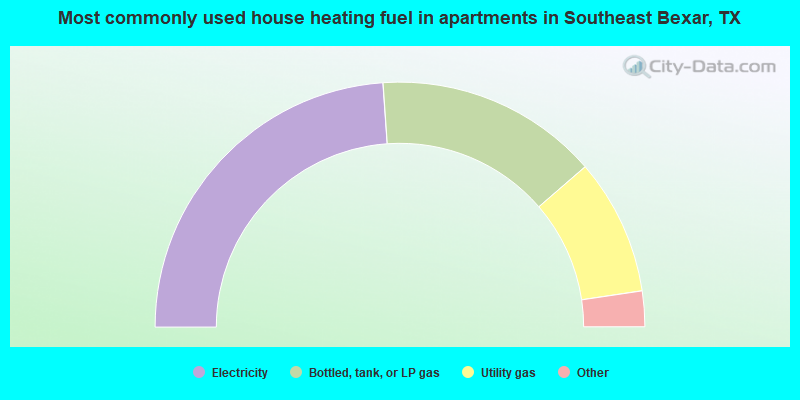
- 47.8%Electricity
- 29.5%Bottled, tank, or LP gas
- 18.0%Utility gas
- 2.5%Wood
- 1.1%Fuel oil, kerosene, etc.
- 0.7%No fuel used
- 0.5%Other fuel
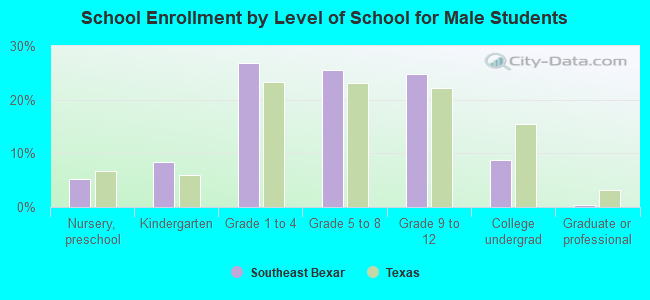
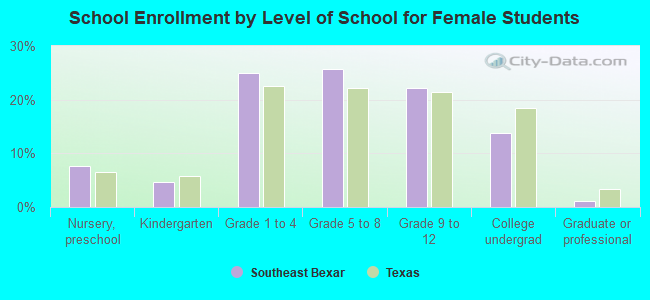
Private vs. public school enrollment:
| Here: | 4.1% |
| Texas: | 6.8% |
| Here: | 9.1% |
| Texas: | 6.2% |
| Here: | 32.6% |
| Texas: | 15.4% |