Springs, New York Submit your own pictures of this place and show them to the world
OSM Map
General Map
Google Map
MSN Map
OSM Map
General Map
Google Map
MSN Map
OSM Map
General Map
Google Map
MSN Map
OSM Map
General Map
Google Map
MSN Map
Please wait while loading the map...
Population in 2010: 6,592. Population change since 2000: +33.2%Males: 3,016 Females: 3,576
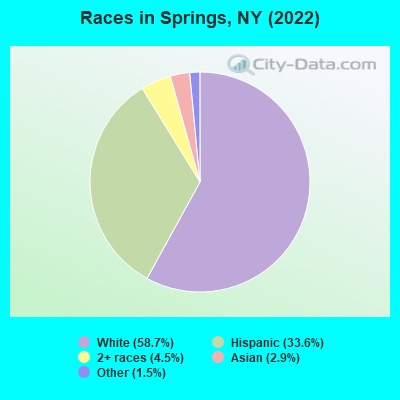
March 2022 cost of living index in Springs: 161.4 (very high, U.S. average is 100) Percentage of residents living in poverty in 2022: 13.6%for White Non-Hispanic residents , 37.1% for Hispanic or Latino residents , 4.3% for American Indian residents , 42.6% for two or more races residents )Business Search - 14 Million verified businesses
Data:
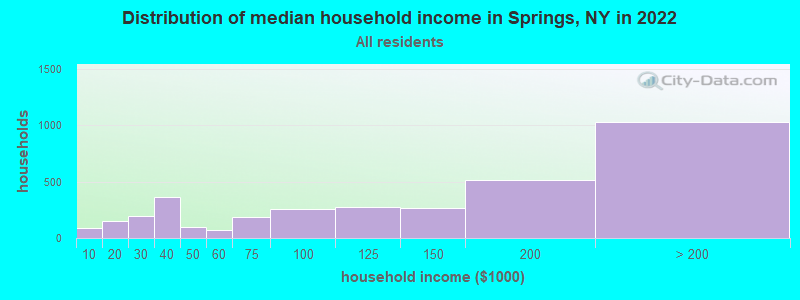
Median household income ($)
Median household income (% change since 2000)
Household income diversity
Ratio of average income to average house value (%)
Ratio of average income to average rent
Median household income ($) - White
Median household income ($) - Black or African American
Median household income ($) - Asian
Median household income ($) - Hispanic or Latino
Median household income ($) - American Indian and Alaska Native
Median household income ($) - Multirace
Median household income ($) - Other Race
Median household income for houses/condos with a mortgage ($)
Median household income for apartments without a mortgage ($)
Races - White alone (%)
Races - White alone (% change since 2000)
Races - Black alone (%)
Races - Black alone (% change since 2000)
Races - American Indian alone (%)
Races - American Indian alone (% change since 2000)
Races - Asian alone (%)
Races - Asian alone (% change since 2000)
Races - Hispanic (%)
Races - Hispanic (% change since 2000)
Races - Native Hawaiian and Other Pacific Islander alone (%)
Races - Native Hawaiian and Other Pacific Islander alone (% change since 2000)
Races - Two or more races (%)
Races - Two or more races (% change since 2000)
Races - Other race alone (%)
Races - Other race alone (% change since 2000)
Racial diversity
Unemployment (%)
Unemployment (% change since 2000)
Unemployment (%) - White
Unemployment (%) - Black or African American
Unemployment (%) - Asian
Unemployment (%) - Hispanic or Latino
Unemployment (%) - American Indian and Alaska Native
Unemployment (%) - Multirace
Unemployment (%) - Other Race
Population density (people per square mile)
Population - Males (%)
Population - Females (%)
Population - Males (%) - White
Population - Males (%) - Black or African American
Population - Males (%) - Asian
Population - Males (%) - Hispanic or Latino
Population - Males (%) - American Indian and Alaska Native
Population - Males (%) - Multirace
Population - Males (%) - Other Race
Population - Females (%) - White
Population - Females (%) - Black or African American
Population - Females (%) - Asian
Population - Females (%) - Hispanic or Latino
Population - Females (%) - American Indian and Alaska Native
Population - Females (%) - Multirace
Population - Females (%) - Other Race
Coronavirus confirmed cases (May 01, 2024)
Deaths caused by coronavirus (May 01, 2024)
Coronavirus confirmed cases (per 100k population) (May 01, 2024)
Deaths caused by coronavirus (per 100k population) (May 01, 2024)
Daily increase in number of cases (May 01, 2024)
Weekly increase in number of cases (May 01, 2024)
Cases doubled (in days) (May 01, 2024)
Hospitalized patients (Apr 18, 2022)
Negative test results (Apr 18, 2022)
Total test results (Apr 18, 2022)
COVID Vaccine doses distributed (per 100k population) (Sep 19, 2023)
COVID Vaccine doses administered (per 100k population) (Sep 19, 2023)
COVID Vaccine doses distributed (Sep 19, 2023)
COVID Vaccine doses administered (Sep 19, 2023)
Likely homosexual households (%)
Likely homosexual households (% change since 2000)
Likely homosexual households - Lesbian couples (%)
Likely homosexual households - Lesbian couples (% change since 2000)
Likely homosexual households - Gay men (%)
Likely homosexual households - Gay men (% change since 2000)
Cost of living index
Median gross rent ($)
Median contract rent ($)
Median monthly housing costs ($)
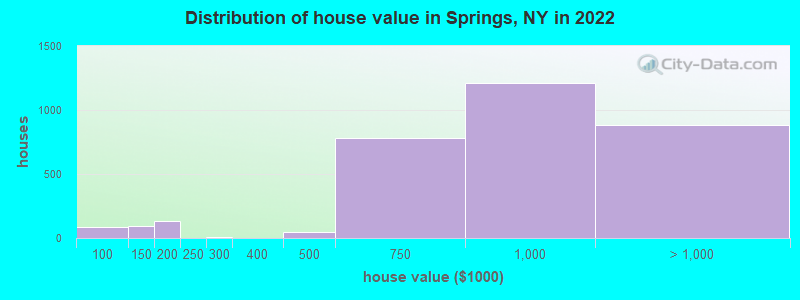
Median house or condo value ($)
Median house or condo value ($ change since 2000)
Mean house or condo value by units in structure - 1, detached ($)
Mean house or condo value by units in structure - 1, attached ($)
Mean house or condo value by units in structure - 2 ($)
Mean house or condo value by units in structure by units in structure - 3 or 4 ($)
Mean house or condo value by units in structure - 5 or more ($)
Mean house or condo value by units in structure - Boat, RV, van, etc. ($)
Mean house or condo value by units in structure - Mobile home ($)
Median house or condo value ($) - White
Median house or condo value ($) - Black or African American
Median house or condo value ($) - Asian
Median house or condo value ($) - Hispanic or Latino
Median house or condo value ($) - American Indian and Alaska Native
Median house or condo value ($) - Multirace
Median house or condo value ($) - Other Race
Median resident age
Resident age diversity
Median resident age - Males
Median resident age - Females
Median resident age - White
Median resident age - Black or African American
Median resident age - Asian
Median resident age - Hispanic or Latino
Median resident age - American Indian and Alaska Native
Median resident age - Multirace
Median resident age - Other Race
Median resident age - Males - White
Median resident age - Males - Black or African American
Median resident age - Males - Asian
Median resident age - Males - Hispanic or Latino
Median resident age - Males - American Indian and Alaska Native
Median resident age - Males - Multirace
Median resident age - Males - Other Race
Median resident age - Females - White
Median resident age - Females - Black or African American
Median resident age - Females - Asian
Median resident age - Females - Hispanic or Latino
Median resident age - Females - American Indian and Alaska Native
Median resident age - Females - Multirace
Median resident age - Females - Other Race
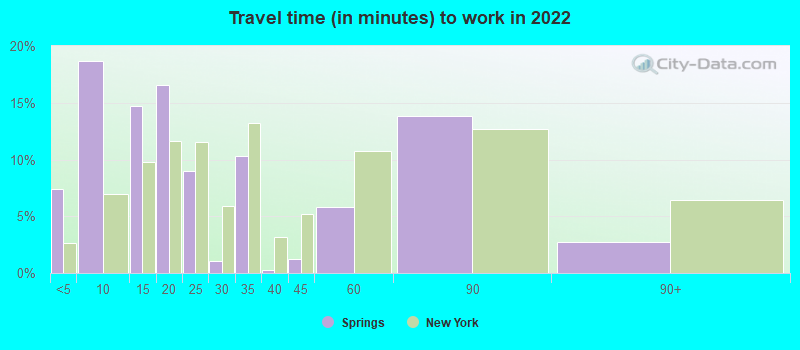
Commute - mean travel time to work (minutes)
Travel time to work - Less than 5 minutes (%)
Travel time to work - Less than 5 minutes (% change since 2000)
Travel time to work - 5 to 9 minutes (%)
Travel time to work - 5 to 9 minutes (% change since 2000)
Travel time to work - 10 to 19 minutes (%)
Travel time to work - 10 to 19 minutes (% change since 2000)
Travel time to work - 20 to 29 minutes (%)
Travel time to work - 20 to 29 minutes (% change since 2000)
Travel time to work - 30 to 39 minutes (%)
Travel time to work - 30 to 39 minutes (% change since 2000)
Travel time to work - 40 to 59 minutes (%)
Travel time to work - 40 to 59 minutes (% change since 2000)
Travel time to work - 60 to 89 minutes (%)
Travel time to work - 60 to 89 minutes (% change since 2000)
Travel time to work - 90 or more minutes (%)
Travel time to work - 90 or more minutes (% change since 2000)
Marital status - Never married (%)
Marital status - Now married (%)
Marital status - Separated (%)
Marital status - Widowed (%)
Marital status - Divorced (%)
Median family income ($)
Median family income (% change since 2000)
Median non-family income ($)
Median non-family income (% change since 2000)
Median per capita income ($)
Median per capita income (% change since 2000)
Median family income ($) - White
Median family income ($) - Black or African American
Median family income ($) - Asian
Median family income ($) - Hispanic or Latino
Median family income ($) - American Indian and Alaska Native
Median family income ($) - Multirace
Median family income ($) - Other Race
Median year house/condo built
Median year apartment built
Year house built - Built 2005 or later (%)
Year house built - Built 2000 to 2004 (%)
Year house built - Built 1990 to 1999 (%)
Year house built - Built 1980 to 1989 (%)
Year house built - Built 1970 to 1979 (%)
Year house built - Built 1960 to 1969 (%)
Year house built - Built 1950 to 1959 (%)
Year house built - Built 1940 to 1949 (%)
Year house built - Built 1939 or earlier (%)
Average household size
Household density (households per square mile)
Average household size - White
Average household size - Black or African American
Average household size - Asian
Average household size - Hispanic or Latino
Average household size - American Indian and Alaska Native
Average household size - Multirace
Average household size - Other Race
Occupied housing units (%)
Vacant housing units (%)
Owner occupied housing units (%)
Renter occupied housing units (%)
Vacancy status - For rent (%)
Vacancy status - For sale only (%)
Vacancy status - Rented or sold, not occupied (%)
Vacancy status - For seasonal, recreational, or occasional use (%)
Vacancy status - For migrant workers (%)
Vacancy status - Other vacant (%)
Residents with income below the poverty level (%)
Residents with income below 50% of the poverty level (%)
Children below poverty level (%)
Poor families by family type - Married-couple family (%)
Poor families by family type - Male, no wife present (%)
Poor families by family type - Female, no husband present (%)
Poverty status for native-born residents (%)
Poverty status for foreign-born residents (%)
Poverty among high school graduates not in families (%)
Poverty among people who did not graduate high school not in families (%)
Residents with income below the poverty level (%) - White
Residents with income below the poverty level (%) - Black or African American
Residents with income below the poverty level (%) - Asian
Residents with income below the poverty level (%) - Hispanic or Latino
Residents with income below the poverty level (%) - American Indian and Alaska Native
Residents with income below the poverty level (%) - Multirace
Residents with income below the poverty level (%) - Other Race
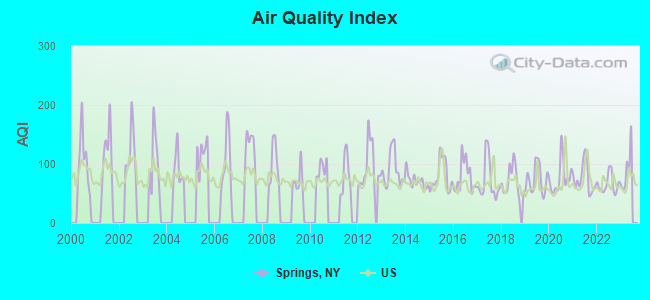
Air pollution - Air Quality Index (AQI)
Air pollution - CO
Air pollution - NO2
Air pollution - SO2
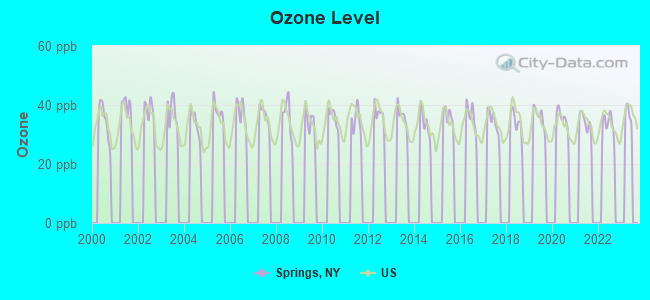
Air pollution - Ozone
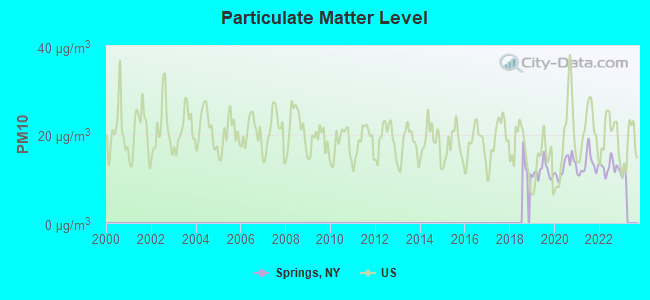
Air pollution - PM10
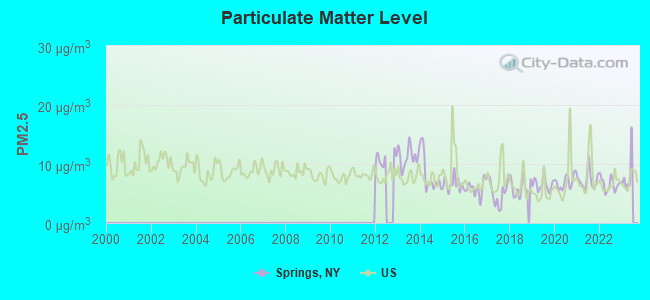
Air pollution - PM25
Air pollution - Pb
Crime - Murders per 100,000 population
Crime - Rapes per 100,000 population
Crime - Robberies per 100,000 population
Crime - Assaults per 100,000 population
Crime - Burglaries per 100,000 population
Crime - Thefts per 100,000 population
Crime - Auto thefts per 100,000 population
Crime - Arson per 100,000 population
Crime - City-data.com crime index
Crime - Violent crime index
Crime - Property crime index
Crime - Murders per 100,000 population (5 year average)
Crime - Rapes per 100,000 population (5 year average)
Crime - Robberies per 100,000 population (5 year average)
Crime - Assaults per 100,000 population (5 year average)
Crime - Burglaries per 100,000 population (5 year average)
Crime - Thefts per 100,000 population (5 year average)
Crime - Auto thefts per 100,000 population (5 year average)
Crime - Arson per 100,000 population (5 year average)
Crime - City-data.com crime index (5 year average)
Crime - Violent crime index (5 year average)
Crime - Property crime index (5 year average)
1996 Presidential Elections Results (%) - Democratic Party (Clinton)
1996 Presidential Elections Results (%) - Republican Party (Dole)
1996 Presidential Elections Results (%) - Other
2000 Presidential Elections Results (%) - Democratic Party (Gore)
2000 Presidential Elections Results (%) - Republican Party (Bush)
2000 Presidential Elections Results (%) - Other
2004 Presidential Elections Results (%) - Democratic Party (Kerry)
2004 Presidential Elections Results (%) - Republican Party (Bush)
2004 Presidential Elections Results (%) - Other
2008 Presidential Elections Results (%) - Democratic Party (Obama)
2008 Presidential Elections Results (%) - Republican Party (McCain)
2008 Presidential Elections Results (%) - Other
2012 Presidential Elections Results (%) - Democratic Party (Obama)
2012 Presidential Elections Results (%) - Republican Party (Romney)
2012 Presidential Elections Results (%) - Other
2016 Presidential Elections Results (%) - Democratic Party (Clinton)
2016 Presidential Elections Results (%) - Republican Party (Trump)
2016 Presidential Elections Results (%) - Other
2020 Presidential Elections Results (%) - Democratic Party (Biden)
2020 Presidential Elections Results (%) - Republican Party (Trump)
2020 Presidential Elections Results (%) - Other
Ancestries Reported - Arab (%)
Ancestries Reported - Czech (%)
Ancestries Reported - Danish (%)
Ancestries Reported - Dutch (%)
Ancestries Reported - English (%)
Ancestries Reported - French (%)
Ancestries Reported - French Canadian (%)
Ancestries Reported - German (%)
Ancestries Reported - Greek (%)
Ancestries Reported - Hungarian (%)
Ancestries Reported - Irish (%)
Ancestries Reported - Italian (%)
Ancestries Reported - Lithuanian (%)
Ancestries Reported - Norwegian (%)
Ancestries Reported - Polish (%)
Ancestries Reported - Portuguese (%)
Ancestries Reported - Russian (%)
Ancestries Reported - Scotch-Irish (%)
Ancestries Reported - Scottish (%)
Ancestries Reported - Slovak (%)
Ancestries Reported - Subsaharan African (%)
Ancestries Reported - Swedish (%)
Ancestries Reported - Swiss (%)
Ancestries Reported - Ukrainian (%)
Ancestries Reported - United States (%)
Ancestries Reported - Welsh (%)
Ancestries Reported - West Indian (%)
Ancestries Reported - Other (%)
Educational Attainment - No schooling completed (%)
Educational Attainment - Less than high school (%)
Educational Attainment - High school or equivalent (%)
Educational Attainment - Less than 1 year of college (%)
Educational Attainment - 1 or more years of college (%)
Educational Attainment - Associate degree (%)
Educational Attainment - Bachelor's degree (%)
Educational Attainment - Master's degree (%)
Educational Attainment - Professional school degree (%)
Educational Attainment - Doctorate degree (%)
School Enrollment - Nursery, preschool (%)
School Enrollment - Kindergarten (%)
School Enrollment - Grade 1 to 4 (%)
School Enrollment - Grade 5 to 8 (%)
School Enrollment - Grade 9 to 12 (%)
School Enrollment - College undergrad (%)
School Enrollment - Graduate or professional (%)
School Enrollment - Not enrolled in school (%)
School enrollment - Public schools (%)
School enrollment - Private schools (%)
School enrollment - Not enrolled (%)
Median number of rooms in houses and condos
Median number of rooms in apartments
Housing units lacking complete plumbing facilities (%)
Housing units lacking complete kitchen facilities (%)
Density of houses
Urban houses (%)
Rural houses (%)
Households with people 60 years and over (%)
Households with people 65 years and over (%)
Households with people 75 years and over (%)
Households with one or more nonrelatives (%)
Households with no nonrelatives (%)
Population in households (%)
Family households (%)
Nonfamily households (%)
Population in families (%)
Family households with own children (%)
Median number of bedrooms in owner occupied houses
Mean number of bedrooms in owner occupied houses
Median number of bedrooms in renter occupied houses
Mean number of bedrooms in renter occupied houses
Median number of vehichles in owner occupied houses
Mean number of vehichles in owner occupied houses
Median number of vehichles in renter occupied houses
Mean number of vehichles in renter occupied houses
Mortgage status - with mortgage (%)
Mortgage status - with second mortgage (%)
Mortgage status - with home equity loan (%)
Mortgage status - with both second mortgage and home equity loan (%)
Mortgage status - without a mortgage (%)
Average family size
Average family size - White
Average family size - Black or African American
Average family size - Asian
Average family size - Hispanic or Latino
Average family size - American Indian and Alaska Native
Average family size - Multirace
Average family size - Other Race
Geographical mobility - Same house 1 year ago (%)
Geographical mobility - Moved within same county (%)
Geographical mobility - Moved from different county within same state (%)
Geographical mobility - Moved from different state (%)
Geographical mobility - Moved from abroad (%)
Place of birth - Born in state of residence (%)
Place of birth - Born in other state (%)
Place of birth - Native, outside of US (%)
Place of birth - Foreign born (%)
Housing units in structures - 1, detached (%)
Housing units in structures - 1, attached (%)
Housing units in structures - 2 (%)
Housing units in structures - 3 or 4 (%)
Housing units in structures - 5 to 9 (%)
Housing units in structures - 10 to 19 (%)
Housing units in structures - 20 to 49 (%)
Housing units in structures - 50 or more (%)
Housing units in structures - Mobile home (%)
Housing units in structures - Boat, RV, van, etc. (%)
House/condo owner moved in on average (years ago)
Renter moved in on average (years ago)
Year householder moved into unit - Moved in 1999 to March 2000 (%)
Year householder moved into unit - Moved in 1995 to 1998 (%)
Year householder moved into unit - Moved in 1990 to 1994 (%)
Year householder moved into unit - Moved in 1980 to 1989 (%)
Year householder moved into unit - Moved in 1970 to 1979 (%)
Year householder moved into unit - Moved in 1969 or earlier (%)
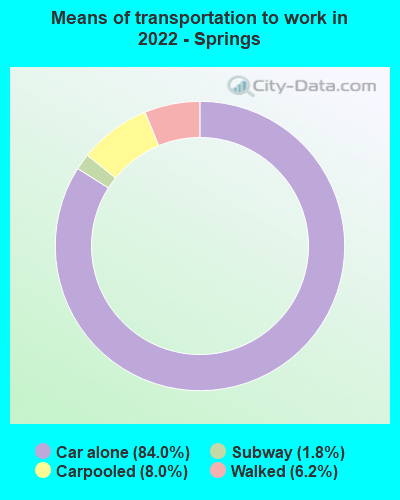
Means of transportation to work - Drove car alone (%)
Means of transportation to work - Carpooled (%)
Means of transportation to work - Public transportation (%)
Means of transportation to work - Bus or trolley bus (%)
Means of transportation to work - Streetcar or trolley car (%)
Means of transportation to work - Subway or elevated (%)
Means of transportation to work - Railroad (%)
Means of transportation to work - Ferryboat (%)
Means of transportation to work - Taxicab (%)
Means of transportation to work - Motorcycle (%)
Means of transportation to work - Bicycle (%)
Means of transportation to work - Walked (%)
Means of transportation to work - Other means (%)
Working at home (%)
Industry diversity
Most Common Industries - Agriculture, forestry, fishing and hunting, and mining (%)
Most Common Industries - Agriculture, forestry, fishing and hunting (%)
Most Common Industries - Mining, quarrying, and oil and gas extraction (%)
Most Common Industries - Construction (%)
Most Common Industries - Manufacturing (%)
Most Common Industries - Wholesale trade (%)
Most Common Industries - Retail trade (%)
Most Common Industries - Transportation and warehousing, and utilities (%)
Most Common Industries - Transportation and warehousing (%)
Most Common Industries - Utilities (%)
Most Common Industries - Information (%)
Most Common Industries - Finance and insurance, and real estate and rental and leasing (%)
Most Common Industries - Finance and insurance (%)
Most Common Industries - Real estate and rental and leasing (%)
Most Common Industries - Professional, scientific, and management, and administrative and waste management services (%)
Most Common Industries - Professional, scientific, and technical services (%)
Most Common Industries - Management of companies and enterprises (%)
Most Common Industries - Administrative and support and waste management services (%)
Most Common Industries - Educational services, and health care and social assistance (%)
Most Common Industries - Educational services (%)
Most Common Industries - Health care and social assistance (%)
Most Common Industries - Arts, entertainment, and recreation, and accommodation and food services (%)
Most Common Industries - Arts, entertainment, and recreation (%)
Most Common Industries - Accommodation and food services (%)
Most Common Industries - Other services, except public administration (%)
Most Common Industries - Public administration (%)
Occupation diversity
Most Common Occupations - Management, business, science, and arts occupations (%)
Most Common Occupations - Management, business, and financial occupations (%)
Most Common Occupations - Management occupations (%)
Most Common Occupations - Business and financial operations occupations (%)
Most Common Occupations - Computer, engineering, and science occupations (%)
Most Common Occupations - Computer and mathematical occupations (%)
Most Common Occupations - Architecture and engineering occupations (%)
Most Common Occupations - Life, physical, and social science occupations (%)
Most Common Occupations - Education, legal, community service, arts, and media occupations (%)
Most Common Occupations - Community and social service occupations (%)
Most Common Occupations - Legal occupations (%)
Most Common Occupations - Education, training, and library occupations (%)
Most Common Occupations - Arts, design, entertainment, sports, and media occupations (%)
Most Common Occupations - Healthcare practitioners and technical occupations (%)
Most Common Occupations - Health diagnosing and treating practitioners and other technical occupations (%)
Most Common Occupations - Health technologists and technicians (%)
Most Common Occupations - Service occupations (%)
Most Common Occupations - Healthcare support occupations (%)
Most Common Occupations - Protective service occupations (%)
Most Common Occupations - Fire fighting and prevention, and other protective service workers including supervisors (%)
Most Common Occupations - Law enforcement workers including supervisors (%)
Most Common Occupations - Food preparation and serving related occupations (%)
Most Common Occupations - Building and grounds cleaning and maintenance occupations (%)
Most Common Occupations - Personal care and service occupations (%)
Most Common Occupations - Sales and office occupations (%)
Most Common Occupations - Sales and related occupations (%)
Most Common Occupations - Office and administrative support occupations (%)
Most Common Occupations - Natural resources, construction, and maintenance occupations (%)
Most Common Occupations - Farming, fishing, and forestry occupations (%)
Most Common Occupations - Construction and extraction occupations (%)
Most Common Occupations - Installation, maintenance, and repair occupations (%)
Most Common Occupations - Production, transportation, and material moving occupations (%)
Most Common Occupations - Production occupations (%)
Most Common Occupations - Transportation occupations (%)
Most Common Occupations - Material moving occupations (%)
People in Group quarters - Institutionalized population (%)
People in Group quarters - Correctional institutions (%)
People in Group quarters - Federal prisons and detention centers (%)
People in Group quarters - Halfway houses (%)
People in Group quarters - Local jails and other confinement facilities (including police lockups) (%)
People in Group quarters - Military disciplinary barracks (%)
People in Group quarters - State prisons (%)
People in Group quarters - Other types of correctional institutions (%)
People in Group quarters - Nursing homes (%)
People in Group quarters - Hospitals/wards, hospices, and schools for the handicapped (%)
People in Group quarters - Hospitals/wards and hospices for chronically ill (%)
People in Group quarters - Hospices or homes for chronically ill (%)
People in Group quarters - Military hospitals or wards for chronically ill (%)
People in Group quarters - Other hospitals or wards for chronically ill (%)
People in Group quarters - Hospitals or wards for drug/alcohol abuse (%)
People in Group quarters - Mental (Psychiatric) hospitals or wards (%)
People in Group quarters - Schools, hospitals, or wards for the mentally retarded (%)
People in Group quarters - Schools, hospitals, or wards for the physically handicapped (%)
People in Group quarters - Institutions for the deaf (%)
People in Group quarters - Institutions for the blind (%)
People in Group quarters - Orthopedic wards and institutions for the physically handicapped (%)
People in Group quarters - Wards in general hospitals for patients who have no usual home elsewhere (%)
People in Group quarters - Wards in military hospitals for patients who have no usual home elsewhere (%)
People in Group quarters - Juvenile institutions (%)
People in Group quarters - Long-term care (%)
People in Group quarters - Homes for abused, dependent, and neglected children (%)
People in Group quarters - Residential treatment centers for emotionally disturbed children (%)
People in Group quarters - Training schools for juvenile delinquents (%)
People in Group quarters - Short-term care, detention or diagnostic centers for delinquent children (%)
People in Group quarters - Type of juvenile institution unknown (%)
People in Group quarters - Noninstitutionalized population (%)
People in Group quarters - College dormitories (includes college quarters off campus) (%)
People in Group quarters - Military quarters (%)
People in Group quarters - On base (%)
People in Group quarters - Barracks, unaccompanied personnel housing (UPH), (Enlisted/Officer), ;and similar group living quarters for military personnel (%)
People in Group quarters - Transient quarters for temporary residents (%)
People in Group quarters - Military ships (%)
People in Group quarters - Group homes (%)
People in Group quarters - Homes or halfway houses for drug/alcohol abuse (%)
People in Group quarters - Homes for the mentally ill (%)
People in Group quarters - Homes for the mentally retarded (%)
People in Group quarters - Homes for the physically handicapped (%)
People in Group quarters - Other group homes (%)
People in Group quarters - Religious group quarters (%)
People in Group quarters - Dormitories (%)
People in Group quarters - Agriculture workers' dormitories on farms (%)
People in Group quarters - Job Corps and vocational training facilities (%)
People in Group quarters - Other workers' dormitories (%)
People in Group quarters - Crews of maritime vessels (%)
People in Group quarters - Other nonhousehold living situations (%)
People in Group quarters - Other noninstitutional group quarters (%)
Residents speaking English at home (%)
Residents speaking English at home - Born in the United States (%)
Residents speaking English at home - Native, born elsewhere (%)
Residents speaking English at home - Foreign born (%)
Residents speaking Spanish at home (%)
Residents speaking Spanish at home - Born in the United States (%)
Residents speaking Spanish at home - Native, born elsewhere (%)
Residents speaking Spanish at home - Foreign born (%)
Residents speaking other language at home (%)
Residents speaking other language at home - Born in the United States (%)
Residents speaking other language at home - Native, born elsewhere (%)
Residents speaking other language at home - Foreign born (%)
Class of Workers - Employee of private company (%)
Class of Workers - Self-employed in own incorporated business (%)
Class of Workers - Private not-for-profit wage and salary workers (%)
Class of Workers - Local government workers (%)
Class of Workers - State government workers (%)
Class of Workers - Federal government workers (%)
Class of Workers - Self-employed workers in own not incorporated business and Unpaid family workers (%)
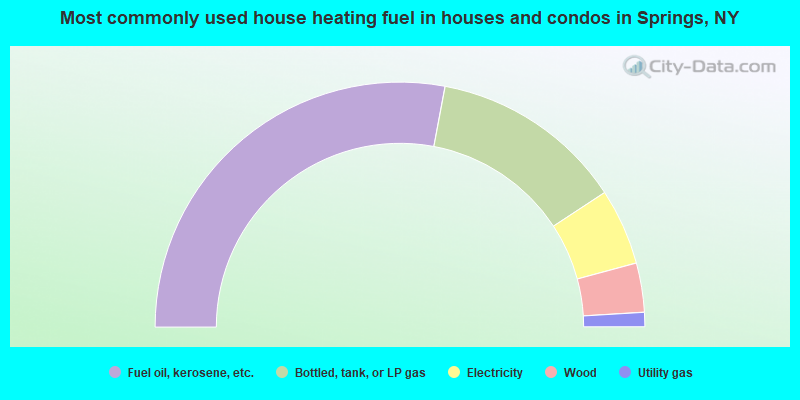
House heating fuel used in houses and condos - Utility gas (%)
House heating fuel used in houses and condos - Bottled, tank, or LP gas (%)
House heating fuel used in houses and condos - Electricity (%)
House heating fuel used in houses and condos - Fuel oil, kerosene, etc. (%)
House heating fuel used in houses and condos - Coal or coke (%)
House heating fuel used in houses and condos - Wood (%)
House heating fuel used in houses and condos - Solar energy (%)
House heating fuel used in houses and condos - Other fuel (%)
House heating fuel used in houses and condos - No fuel used (%)
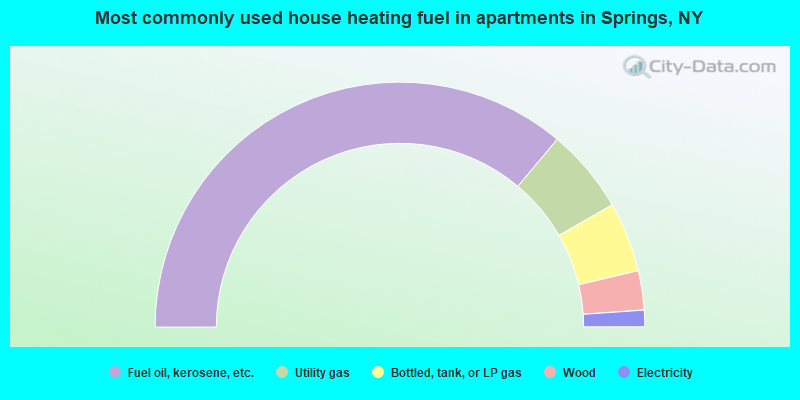
House heating fuel used in apartments - Utility gas (%)
House heating fuel used in apartments - Bottled, tank, or LP gas (%)
House heating fuel used in apartments - Electricity (%)
House heating fuel used in apartments - Fuel oil, kerosene, etc. (%)
House heating fuel used in apartments - Coal or coke (%)
House heating fuel used in apartments - Wood (%)
House heating fuel used in apartments - Solar energy (%)
House heating fuel used in apartments - Other fuel (%)
House heating fuel used in apartments - No fuel used (%)
Armed forces status - In Armed Forces (%)
Armed forces status - Civilian (%)
Armed forces status - Civilian - Veteran (%)
Armed forces status - Civilian - Nonveteran (%)
Fatal accidents locations in years 2005-2021
Fatal accidents locations in 2005
Fatal accidents locations in 2006
Fatal accidents locations in 2007
Fatal accidents locations in 2008
Fatal accidents locations in 2009
Fatal accidents locations in 2010
Fatal accidents locations in 2011
Fatal accidents locations in 2012
Fatal accidents locations in 2013
Fatal accidents locations in 2014
Fatal accidents locations in 2015
Fatal accidents locations in 2016
Fatal accidents locations in 2017
Fatal accidents locations in 2018
Fatal accidents locations in 2019
Fatal accidents locations in 2020
Fatal accidents locations in 2021
Alcohol use - People drinking some alcohol every month (%)
Alcohol use - People not drinking at all (%)
Alcohol use - Average days/month drinking alcohol
Alcohol use - Average drinks/week
Alcohol use - Average days/year people drink much
Audiometry - Average condition of hearing (%)
Audiometry - People that can hear a whisper from across a quiet room (%)
Audiometry - People that can hear normal voice from across a quiet room (%)
Audiometry - Ears ringing, roaring, buzzing (%)
Audiometry - Had a job exposure to loud noise (%)
Audiometry - Had off-work exposure to loud noise (%)
Blood Pressure & Cholesterol - Has high blood pressure (%)
Blood Pressure & Cholesterol - Checking blood pressure at home (%)
Blood Pressure & Cholesterol - Frequently checking blood cholesterol (%)
Blood Pressure & Cholesterol - Has high cholesterol level (%)
Consumer Behavior - Money monthly spent on food at supermarket/grocery store
Consumer Behavior - Money monthly spent on food at other stores
Consumer Behavior - Money monthly spent on eating out
Consumer Behavior - Money monthly spent on carryout/delivered foods
Consumer Behavior - Income spent on food at supermarket/grocery store (%)
Consumer Behavior - Income spent on food at other stores (%)
Consumer Behavior - Income spent on eating out (%)
Consumer Behavior - Income spent on carryout/delivered foods (%)
Current Health Status - General health condition (%)
Current Health Status - Blood donors (%)
Current Health Status - Has blood ever tested for HIV virus (%)
Current Health Status - Left-handed people (%)
Dermatology - People using sunscreen (%)
Diabetes - Diabetics (%)
Diabetes - Had a blood test for high blood sugar (%)
Diabetes - People taking insulin (%)
Diet Behavior & Nutrition - Diet health (%)
Diet Behavior & Nutrition - Milk product consumption (# of products/month)
Diet Behavior & Nutrition - Meals not home prepared (#/week)
Diet Behavior & Nutrition - Meals from fast food or pizza place (#/week)
Diet Behavior & Nutrition - Ready-to-eat foods (#/month)
Diet Behavior & Nutrition - Frozen meals/pizza (#/month)
Drug Use - People that ever used marijuana or hashish (%)
Drug Use - Ever used hard drugs (%)
Drug Use - Ever used any form of cocaine (%)
Drug Use - Ever used heroin (%)
Drug Use - Ever used methamphetamine (%)
Health Insurance - People covered by health insurance (%)
Kidney Conditions-Urology - Avg. # of times urinating at night
Medical Conditions - People with asthma (%)
Medical Conditions - People with anemia (%)
Medical Conditions - People with psoriasis (%)
Medical Conditions - People with overweight (%)
Medical Conditions - Elderly people having difficulties in thinking or remembering (%)
Medical Conditions - People who ever received blood transfusion (%)
Medical Conditions - People having trouble seeing even with glass/contacts (%)
Medical Conditions - People with arthritis (%)
Medical Conditions - People with gout (%)
Medical Conditions - People with congestive heart failure (%)
Medical Conditions - People with coronary heart disease (%)
Medical Conditions - People with angina pectoris (%)
Medical Conditions - People who ever had heart attack (%)
Medical Conditions - People who ever had stroke (%)
Medical Conditions - People with emphysema (%)
Medical Conditions - People with thyroid problem (%)
Medical Conditions - People with chronic bronchitis (%)
Medical Conditions - People with any liver condition (%)
Medical Conditions - People who ever had cancer or malignancy (%)
Mental Health - People who have little interest in doing things (%)
Mental Health - People feeling down, depressed, or hopeless (%)
Mental Health - People who have trouble sleeping or sleeping too much (%)
Mental Health - People feeling tired or having little energy (%)
Mental Health - People with poor appetite or overeating (%)
Mental Health - People feeling bad about themself (%)
Mental Health - People who have trouble concentrating on things (%)
Mental Health - People moving or speaking slowly or too fast (%)
Mental Health - People having thoughts they would be better off dead (%)
Oral Health - Average years since last visit a dentist
Oral Health - People embarrassed because of mouth (%)
Oral Health - People with gum disease (%)
Oral Health - General health of teeth and gums (%)
Oral Health - Average days a week using dental floss/device
Oral Health - Average days a week using mouthwash for dental problem
Oral Health - Average number of teeth
Pesticide Use - Households using pesticides to control insects (%)
Pesticide Use - Households using pesticides to kill weeds (%)
Physical Activity - People doing vigorous-intensity work activities (%)
Physical Activity - People doing moderate-intensity work activities (%)
Physical Activity - People walking or bicycling (%)
Physical Activity - People doing vigorous-intensity recreational activities (%)
Physical Activity - People doing moderate-intensity recreational activities (%)
Physical Activity - Average hours a day doing sedentary activities
Physical Activity - Average hours a day watching TV or videos
Physical Activity - Average hours a day using computer
Physical Functioning - People having limitations keeping them from working (%)
Physical Functioning - People limited in amount of work they can do (%)
Physical Functioning - People that need special equipment to walk (%)
Physical Functioning - People experiencing confusion/memory problems (%)
Physical Functioning - People requiring special healthcare equipment (%)
Prescription Medications - Average number of prescription medicines taking
Preventive Aspirin Use - Adults 40+ taking low-dose aspirin (%)
Reproductive Health - Vaginal deliveries (%)
Reproductive Health - Cesarean deliveries (%)
Reproductive Health - Deliveries resulted in a live birth (%)
Reproductive Health - Pregnancies resulted in a delivery (%)
Reproductive Health - Women breastfeeding newborns (%)
Reproductive Health - Women that had a hysterectomy (%)
Reproductive Health - Women that had both ovaries removed (%)
Reproductive Health - Women that have ever taken birth control pills (%)
Reproductive Health - Women taking birth control pills (%)
Reproductive Health - Women that have ever used Depo-Provera or injectables (%)
Reproductive Health - Women that have ever used female hormones (%)
Sexual Behavior - People 18+ that ever had sex (vaginal, anal, or oral) (%)
Sexual Behavior - Males 18+ that ever had vaginal sex with a woman (%)
Sexual Behavior - Males 18+ that ever performed oral sex on a woman (%)
Sexual Behavior - Males 18+ that ever had anal sex with a woman (%)
Sexual Behavior - Males 18+ that ever had any sex with a man (%)
Sexual Behavior - Females 18+ that ever had vaginal sex with a man (%)
Sexual Behavior - Females 18+ that ever performed oral sex on a man (%)
Sexual Behavior - Females 18+ that ever had anal sex with a man (%)
Sexual Behavior - Females 18+ that ever had any kind of sex with a woman (%)
Sexual Behavior - Average age people first had sex
Sexual Behavior - Average number of female sex partners in lifetime (males 18+)
Sexual Behavior - Average number of female vaginal sex partners in lifetime (males 18+)
Sexual Behavior - Average age people first performed oral sex on a woman (18+)
Sexual Behavior - Average number of woman performed oral sex on in lifetime (18+)
Sexual Behavior - Average number of male sex partners in lifetime (males 18+)
Sexual Behavior - Average number of male anal sex partners in lifetime (males 18+)
Sexual Behavior - Average age people first performed oral sex on a man (18+)
Sexual Behavior - Average number of male oral sex partners in lifetime (18+)
Sexual Behavior - People using protection when performing oral sex (%)
Sexual Behavior - Average number of times people have vaginal or anal sex a year
Sexual Behavior - People having sex without condom (%)
Sexual Behavior - Average number of male sex partners in lifetime (females 18+)
Sexual Behavior - Average number of male vaginal sex partners in lifetime (females 18+)
Sexual Behavior - Average number of female sex partners in lifetime (females 18+)
Sexual Behavior - Circumcised males 18+ (%)
Sleep Disorders - Average hours sleeping at night
Sleep Disorders - People that has trouble sleeping (%)
Smoking-Cigarette Use - People smoking cigarettes (%)
Taste & Smell - People 40+ having problems with smell (%)
Taste & Smell - People 40+ having problems with taste (%)
Taste & Smell - People 40+ that ever had wisdom teeth removed (%)
Taste & Smell - People 40+ that ever had tonsils teeth removed (%)
Taste & Smell - People 40+ that ever had a loss of consciousness because of a head injury (%)
Taste & Smell - People 40+ that ever had a broken nose or other serious injury to face or skull (%)
Taste & Smell - People 40+ that ever had two or more sinus infections (%)
Weight - Average height (inches)
Weight - Average weight (pounds)
Weight - Average BMI
Weight - People that are obese (%)
Weight - People that ever were obese (%)
Weight - People trying to lose weight (%)
Latest news from Springs, NY collected exclusively by city-data.com from local newspapers, TV, and radio stations
Ancestries: Eastern European (9.7%), Italian (8.7%), American (3.7%), English (3.2%), European (2.4%), German (2.2%).
Current Local Time:
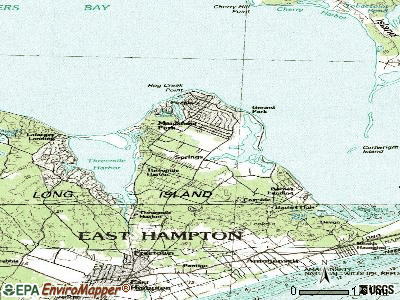
Land area: 8.46 square miles.
Population density: 779 people per square mile (low).
2,367 residents are foreign born (17.8% Latin America , 5.3% Europe ).
This place:
25.8%New York:
22.6%
Median real estate property taxes paid for housing units with mortgages in 2022: $6,882 (0.7%)Median real estate property taxes paid for housing units with no mortgage in 2022: $7,163 (0.8%)
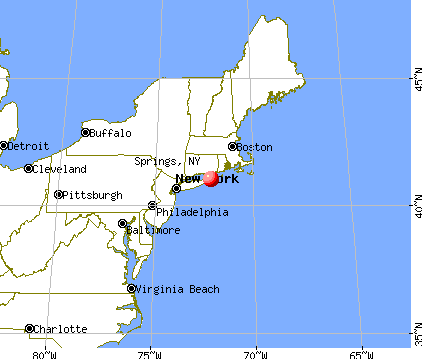
Nearest city with pop. 50,000+: New Haven, CT
Nearest city with pop. 200,000+: North Hempstead, NY
Nearest city with pop. 1,000,000+: Queens, NY
Nearest cities:
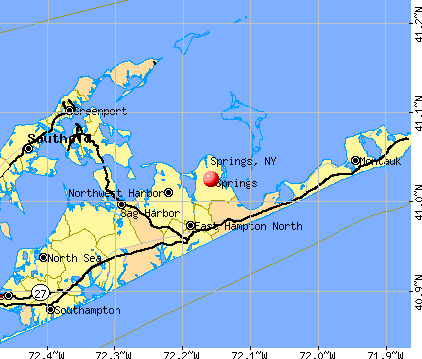
Latitude: 41.03 N, Longitude: 72.16 W
Daytime population change due to commuting: -2,676 (-29.2%)Workers who live and work in this place: 1,987 (38.6%)
Area code commonly used in this area: 631
Unemployment in December 2023:
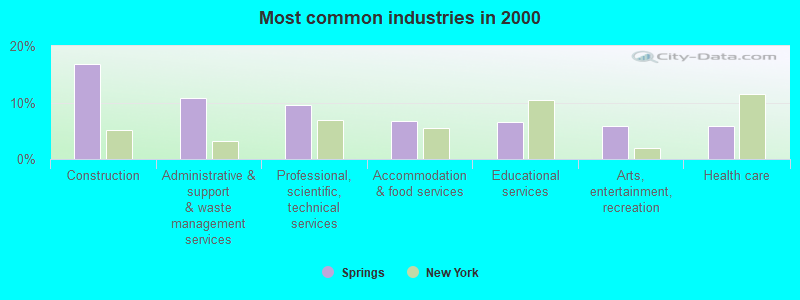
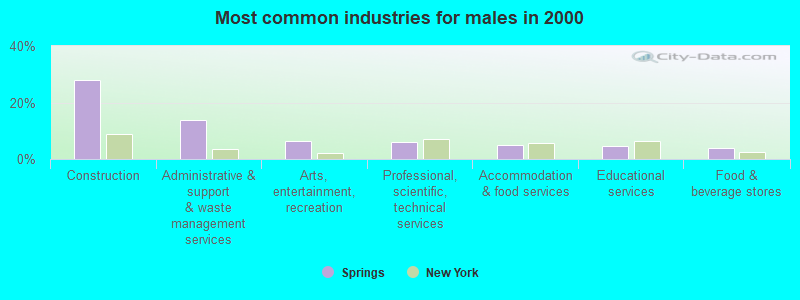
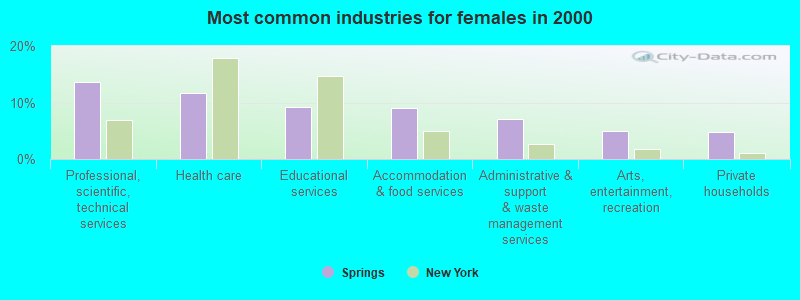
Most common industries in Springs, NY (%)
Both Males Females
Construction (16.8%)
Administrative & support & waste management services (10.8%)
Professional, scientific, technical services (9.5%)
Accommodation & food services (6.8%)
Educational services (6.6%)
Arts, entertainment, recreation (5.8%)
Health care (5.8%)
Construction (28.1%)
Administrative & support & waste management services (13.8%)
Arts, entertainment, recreation (6.5%)
Professional, scientific, technical services (6.1%)
Accommodation & food services (5.0%)
Educational services (4.6%)
Food & beverage stores (3.7%)
Professional, scientific, technical services (13.6%)
Health care (11.7%)
Educational services (9.2%)
Accommodation & food services (9.0%)
Administrative & support & waste management services (7.1%)
Arts, entertainment, recreation (4.9%)
Private households (4.9%)
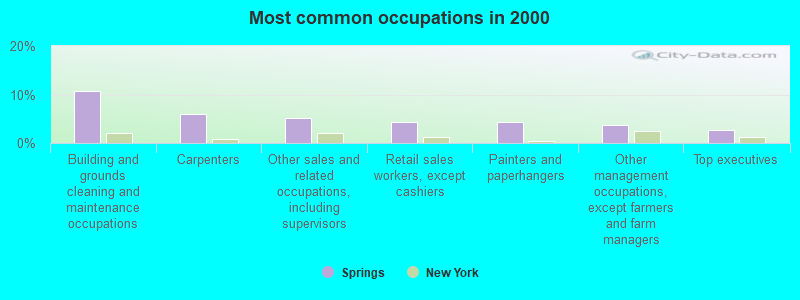
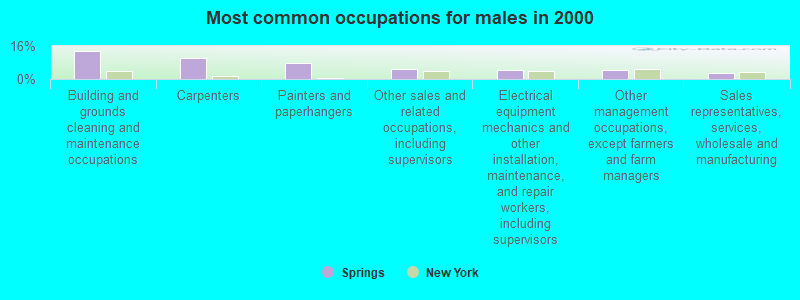
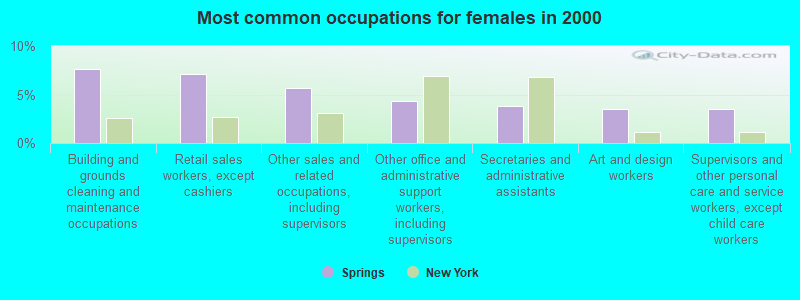
Most common occupations in Springs, NY (%)
Both Males Females
Building and grounds cleaning and maintenance occupations (10.8%)
Carpenters (6.1%)
Other sales and related occupations, including supervisors (5.2%)
Retail sales workers, except cashiers (4.3%)
Painters and paperhangers (4.2%)
Other management occupations, except farmers and farm managers (3.7%)
Top executives (2.8%)
Building and grounds cleaning and maintenance occupations (13.4%)
Carpenters (10.2%)
Painters and paperhangers (7.7%)
Other sales and related occupations, including supervisors (4.8%)
Electrical equipment mechanics and other installation, maintenance, and repair workers, including supervisors (4.3%)
Other management occupations, except farmers and farm managers (4.1%)
Sales representatives, services, wholesale and manufacturing (3.1%)
Building and grounds cleaning and maintenance occupations (7.6%)
Retail sales workers, except cashiers (7.2%)
Other sales and related occupations, including supervisors (5.7%)
Other office and administrative support workers, including supervisors (4.3%)
Secretaries and administrative assistants (3.8%)
Art and design workers (3.5%)
Supervisors and other personal care and service workers, except child care workers (3.5%)
Tornado activity:
Springs-area historical tornado activity is slightly below New York state average. It is 70% smaller than the overall U.S. average.
On 7/10/1989, a category F4 (max. wind speeds 207-260 mph) tornado 44.6 miles away from the Springs place center injured 40 people and caused between $50,000,000 and $500,000,000 in damages.
On 8/21/1951, a category F3 (max. wind speeds 158-206 mph) tornado 42.3 miles away from the place center injured 8 people and caused between $50,000 and $500,000 in damages.
Earthquake activity:
Springs-area historical earthquake activity is significantly above New York state average. It is 73% smaller than the overall U.S. average. On 10/7/1983 at 10:18:46, a magnitude 5.3 (5.1 MB, 5.3 LG, 5.1 ML, Class: Moderate, Intensity: VI - VII) earthquake occurred 231.1 miles away from Springs center On 4/20/2002 at 10:50:47, a magnitude 5.3 (5.3 ML, Depth: 3.0 mi) earthquake occurred 253.5 miles away from Springs center On 8/22/1992 at 12:20:32, a magnitude 4.8 (4.8 MB, 3.8 MS, 4.7 LG, Depth: 6.2 mi, Class: Light, Intensity: IV - V) earthquake occurred 164.6 miles away from Springs center On 4/20/2002 at 10:50:47, a magnitude 5.2 (5.2 MB, 4.2 MS, 5.2 MW, 5.0 MW) earthquake occurred 252.2 miles away from Springs center On 8/23/2011 at 17:51:04, a magnitude 5.8 (5.8 MW, Depth: 3.7 mi) earthquake occurred 376.2 miles away from Springs center On 1/19/1982 at 00:14:42, a magnitude 4.7 (4.5 MB, 4.7 MD, 4.5 LG) earthquake occurred 173.5 miles away from Springs center Magnitude types: regional Lg-wave magnitude (LG), body-wave magnitude (MB), duration magnitude (MD), local magnitude (ML), surface-wave magnitude (MS), moment magnitude (MW) Natural disasters: The number of natural disasters in Suffolk County (28) is a lot greater than the US average (15).Major Disasters (Presidential) Declared: 19Emergencies Declared: 7Hurricanes: 9, Floods: 7, Storms: 7, Snowstorms: 4, Winter Storms: 3, Blizzards: 2, Heavy Rain: 1, Power Outage: 1, Tropical Depression: 1, Tropical Storm: 1, Water Shortage: 1, Other: 3 (Note: some incidents may be assigned to more than one category). Hospitals and medical centers near Springs: CATHOLIC GUARDIAN SOCIETY OF NEW YORK (Hospital, about 5 miles away; EAST HAMPTON, NY)
EASTERN LONG ISLAND HOSPITAL (about 13 miles away; GREENPORT, NY)
SOUTHAMPTON CARE CENTER (Nursing Home, about 16 miles away; SOUTHAMPTON, NY)
SOUTHAMPTON HOSPITAL (about 16 miles away; SOUTHAMPTON, NY)
THE HAMPTONS CENTER FOR REHABILITATION AND NURSING (Nursing Home, about 16 miles away; SOUTH HAMPTON, NY)
Colleges/universities with over 2000 students nearest to Springs:
Connecticut College (about 25 miles; New London, CT ; Full-time enrollment: 2,068)
Three Rivers Community College (about 34 miles; Norwich, CT ; FT enrollment: 2,897)
Gateway Community College (about 45 miles; New Haven, CT ; FT enrollment: 4,672)
Yale University (about 45 miles; New Haven, CT ; FT enrollment: 13,121)
Wesleyan University (about 45 miles; Middletown, CT ; FT enrollment: 3,517)
University of Rhode Island (about 46 miles; Kingston, RI ; FT enrollment: 14,656)
University of New Haven (about 46 miles; West Haven, CT ; FT enrollment: 6,205)
Private elementary/middle school in Springs:
See full list of schools located in Springs
Notable locations in Springs: (A) , Blue Bay Girl Scout Camp (B) , East Hampton Fire Department (C) . Display/hide their locations on the map
Church in Springs: (A) . Display/hide its location on the map
Cemeteries: (1) , Edwards Cemetery (2) , John B Parsons Family Cemetery (3) , Springs Community Presbyterian Church Cemetery (4) , Richard King Cemetery (5) . Display/hide their locations on the map
Lakes and swamps: (A) , The Meadows (B) . Display/hide their locations on the map
Parks in Springs include: (1) , C Gerard Park (2) , Kaplan Meadows Sanctuary (3) , Merrill Lake Sanctuary (4) . Display/hide their locations on the map
Beach: (A) . Display/hide its location on the map
Birthplace of: Terra Naomi - Female singer, Anthony Weaver - Football player, Benjamin Pringle - Politician, Calvin C. Chaffee - Politician, Carleton J. King - Politician, Dorian Crozier - Rock drummer, James Graham Jenkins - Federal judge, Michael Rowland - Jockey, Pete Donnelly (musician) - Bass guitarist, Seth Payne - Football player.
Suffolk County has a predicted average indoor radon screening level less than 2 pCi/L (pico curies per liter) - Low Potential Drinking water stations with addresses in Springs that have no violations reported:
OLD STONE MARKET (Population served: 125, Primary Water Source Type: Groundwater)
Average household size: This place:
2.8 peopleNew York:
2.6 people
Percentage of family households: This place:
64.7%Whole state:
63.5%
Percentage of households with unmarried partners: This place:
8.3%Whole state:
6.8%
Likely homosexual households (counted as self-reported same-sex unmarried-partner households)
Lesbian couples: 1.0% of all households Gay men: 1.4% of all households
12 people in homes for the mentally retarded in 2000
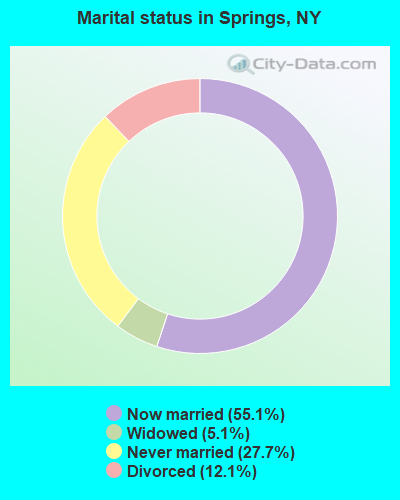
For population 15 years and over in Springs:
Never married: 27.7%Now married: 55.1%Separated: 0.0%Widowed: 5.1%Divorced: 12.1% For population 25 years and over in Springs:
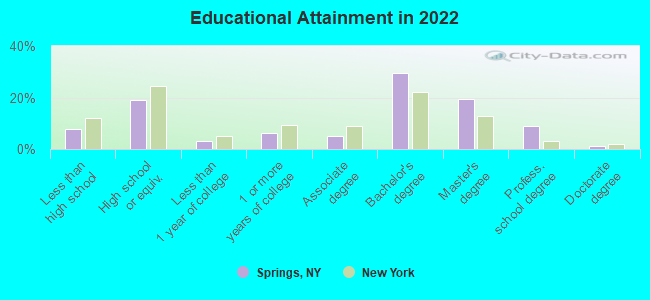
High school or higher: 91.7%Bachelor's degree or higher: 57.5%Graduate or professional degree: 28.7%Unemployed: 3.6%Mean travel time to work (commute): 19.4 minutes
Education Gini index (Inequality in education) Here:
14.1New York average:
13.9
Religion statistics for Springs, NY (based on Suffolk County data)
Religion Adherents Congregations Catholic 879,457 75 Mainline Protestant 69,205 182 Evangelical Protestant 58,909 264 Other 50,771 124 Orthodox 10,190 10 Black Protestant 8,298 49 None 416,520 -
Source: Clifford Grammich, Kirk Hadaway, Richard Houseal, Dale E.Jones, Alexei Krindatch, Richie Stanley and Richard H.Taylor. 2012. 2010 U.S.Religion Census: Religious Congregations & Membership Study. Association of Statisticians of American Religious Bodies. Jones, Dale E., et al. 2002. Congregations and Membership in the United States 2000. Nashville, TN: Glenmary Research Center. Graphs represent county-level data
Food Environment Statistics: Number of grocery stores : 514This county :
3.40 / 10,000 pop.New York :
4.13 / 10,000 pop.
Number of supercenters and club stores : 9Suffolk County :
0.06 / 10,000 pop.New York :
0.06 / 10,000 pop.
Number of convenience stores (no gas) : 217Here :
1.44 / 10,000 pop.New York :
0.92 / 10,000 pop.
Number of convenience stores (with gas) : 256This county :
1.69 / 10,000 pop.New York :
1.68 / 10,000 pop.
Number of full-service restaurants : 1,232Suffolk County :
8.15 / 10,000 pop.New York :
8.82 / 10,000 pop.
Low-income preschool obesity rate : This county :
22.3%New York :
15.6%
Health and Nutrition:
Average overall health of teeth and gums : Springs:
47.1%New York:
48.1%
People feeling badly about themselves : People not drinking alcohol at all : Average hours sleeping at night : Overweight people : Springs:
34.9%New York:
33.4%
General health condition : This city:
56.0%New York:
56.5%
Average condition of hearing : More about Health and Nutrition of Springs, NY Residents
4.14% of this county's 2021 resident taxpayers lived in other counties in 2020 ($206,656 average adjusted gross income )
Here:
4.14%New York average:
5.29%
0.01% of residents moved from foreign countries ($74 average AGI )Suffolk County:
0.01%New York average:
0.01%
Top counties from which taxpayers relocated into this county between 2020 and 2021:
4.28% of this county's 2020 resident taxpayers moved to other counties in 2021 ($141,172 average adjusted gross income )
Here:
4.28%New York average:
6.93%
0.01% of residents moved to foreign countries ($169 average AGI )Suffolk County:
0.01%New York average:
0.02%
Top counties to which taxpayers relocated from this county between 2020 and 2021: Strongest AM radio stations in Springs:
WTIC (1080 AM; 50 kW; HARTFORD, CT; Owner: INFINITY RADIO OPERATIONS INC.)
WNNZ (640 AM; 50 kW; WESTFIELD, MA; Owner: CLEAR CHANNEL BROADCASTING LICENSES, INC.)
WALE (990 AM; 50 kW; GREENVILLE, RI; Owner: NORTH AMERICAN BROADCASTING CO., INC.)
WFAN (660 AM; 50 kW; NEW YORK, NY; Owner: INFINITY BROADCASTING OPERATIONS, INC.)
WCRN (830 AM; 50 kW; WORCESTER, MA; Owner: CARTER BROADCASTING CORPORATION)
WMCA (570 AM; 50 kW; NEW YORK, NY; Owner: SALEM MEDIA OF NEW YORK, LLC)
WCBS (880 AM; 50 kW; NEW YORK, NY; Owner: INFINITY BROADCASTING OPERATIONS, INC.)
WGSM (740 AM; 25 kW; HUNTINGTON, NY; Owner: K RADIO LICENSEE, INC.)
WOR (710 AM; 50 kW; NEW YORK, NY; Owner: BUCKLEY BROADCASTING CORPORATION)
WABC (770 AM; 50 kW; NEW YORK, NY; Owner: WABC-AM RADIO, INC.)
WLIS (1420 AM; 5 kW; OLD SAYBROOK, CT; Owner: CROSSROADS COMM. OLD SAYBROOK, LLC)
WEEI (850 AM; 50 kW; BOSTON, MA; Owner: ENTERCOM BOSTON LICENSE, LLC)
WRKO (680 AM; 50 kW; BOSTON, MA; Owner: ENTERCOM BOSTON LICENSE, LLC)
Strongest FM radio stations in Springs:
WHBE (96.7 FM; EAST HAMPTON, NY; Owner: AAA ENTERTAINMENT LICENSING LLC)
WBEA (101.7 FM; SOUTHOLD, NY; Owner: AAA ENTERTAINMENT LICENSING LLC)
WMOS (104.7 FM; MONTAUK, NY; Owner: CITADEL BROADCASTING COMPANY)
WLNG (92.1 FM; SAG HARBOR, NY; Owner: MAIN STREET BROADCASTING CO., INC.)
WSUF (89.9 FM; NOYACK, NY; Owner: SACRED HEART UNIVERSITY, INC.)
WHFM (95.3 FM; SOUTHAMPTON, NY; Owner: CXR HOLDINGS, INC.)
W233AI (94.5 FM; SAG HARBOR, NY; Owner: MONROE BOARD OF EDUCATION)
WBAZ (102.5 FM; BRIDGEHAMPTON, NY; Owner: AAA ENTERTAINMENT LICENSING LLC)
WRLI-FM (91.3 FM; SOUTHAMPTON, NY; Owner: CONNECTICUT PUBLIC BROADCASTING, INC)
W277AB (103.3 FM; NOYACK, NY; Owner: SACRED HEART UNIVERSITY, INC.)
WLIU (88.3 FM; SOUTHAMPTON, NY; Owner: LONG ISLAND UNIVERSITY PUBLIC RADIO NETWORK)
W264AJ (100.7 FM; SOUTHAMPTON, NY; Owner: MONROE BOARD OF EDUCATION)
WLVG (96.1 FM; CENTER MORICHES, NY; Owner: WAY BROADCASTING, INC.)
WNLC (98.7 FM; EAST LYME, CT; Owner: HALL COMMUNICATIONS, INC.)
TV broadcast stations around Springs:
WVVH-LP (Channel 23; SOUTHAMPTON, ETC., NY; Owner: VIDEO VOICE, INC.)
WHPX (Channel 26; NEW LONDON, CT; Owner: PAXSON HARTFORD LICENSE, INC.)
WPXQ (Channel 69; BLOCK ISLAND, RI; Owner: OCEAN STATE TELEVISION, L.L.C.)
National Bridge Inventory (NBI) Statistics 1 Number of bridges3ft / 1.1m Total length $503,000 Total costs588 Total average daily traffic29 Total average daily truck traffic823 Total future (year 2040) average daily traffic
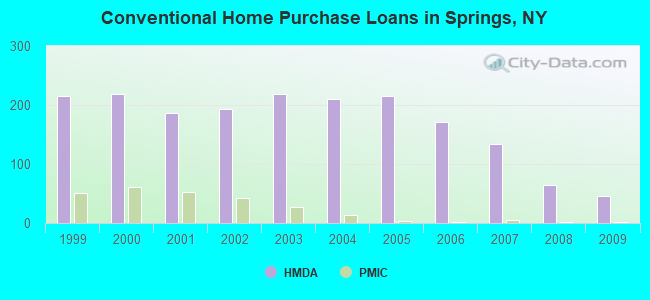
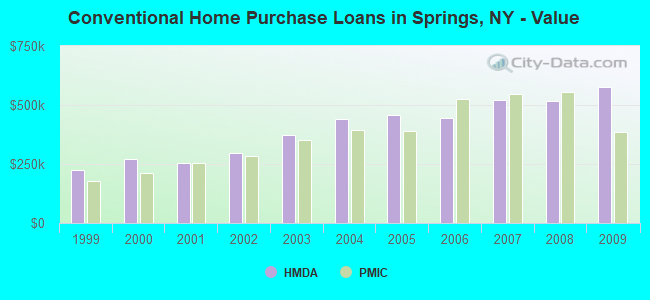
Home Mortgage Disclosure Act Aggregated Statistics For Year 2009(Based on 1 full tract) A) FHA, FSA/RHS & VA B) Conventional C) Refinancings D) Home Improvement Loans F) Non-occupant Loans on Number Average Value Number Average Value Number Average Value Number Average Value Number Average Value
LOANS ORIGINATED 3 $469,333 46 $578,022 138 $377,196 13 $176,692 76 $443,658 APPLICATIONS APPROVED, NOT ACCEPTED 0 $0 5 $415,800 29 $331,931 2 $236,000 9 $351,444 APPLICATIONS DENIED 2 $604,000 11 $376,636 99 $412,646 8 $399,250 34 $464,706 APPLICATIONS WITHDRAWN 1 $367,000 6 $512,167 43 $423,279 1 $1,500,000 15 $488,667 FILES CLOSED FOR INCOMPLETENESS 0 $0 3 $255,667 18 $358,889 0 $0 10 $296,600
Aggregated Statistics For Year 2008(Based on 1 full tract) A) FHA, FSA/RHS & VA B) Conventional C) Refinancings D) Home Improvement Loans F) Non-occupant Loans on G) Loans On Manufactured Number Average Value Number Average Value Number Average Value Number Average Value Number Average Value Number Average Value
LOANS ORIGINATED 1 $733,000 65 $516,615 86 $453,593 23 $282,957 55 $487,309 0 $0 APPLICATIONS APPROVED, NOT ACCEPTED 0 $0 14 $449,571 20 $439,000 4 $271,750 15 $464,133 0 $0 APPLICATIONS DENIED 2 $613,500 19 $378,316 80 $553,975 19 $183,105 23 $633,652 1 $197,000 APPLICATIONS WITHDRAWN 2 $410,500 17 $436,588 36 $518,056 1 $90,000 14 $516,500 0 $0 FILES CLOSED FOR INCOMPLETENESS 0 $0 3 $289,000 22 $509,545 2 $218,500 2 $242,000 0 $0
Aggregated Statistics For Year 2007(Based on 1 full tract) B) Conventional C) Refinancings D) Home Improvement Loans F) Non-occupant Loans on G) Loans On Manufactured Number Average Value Number Average Value Number Average Value Number Average Value Number Average Value
LOANS ORIGINATED 134 $521,657 197 $441,782 33 $231,758 88 $587,182 0 $0 APPLICATIONS APPROVED, NOT ACCEPTED 20 $460,500 35 $426,000 7 $88,571 15 $512,400 1 $120,000 APPLICATIONS DENIED 42 $448,238 155 $496,703 23 $191,870 32 $593,531 0 $0 APPLICATIONS WITHDRAWN 15 $297,400 56 $434,071 4 $299,250 12 $438,833 0 $0 FILES CLOSED FOR INCOMPLETENESS 9 $522,556 29 $426,517 2 $308,500 4 $421,500 0 $0
Aggregated Statistics For Year 2006(Based on 1 full tract) B) Conventional C) Refinancings D) Home Improvement Loans E) Loans on Dwellings For 5+ Families F) Non-occupant Loans on Number Average Value Number Average Value Number Average Value Number Average Value Number Average Value
LOANS ORIGINATED 172 $443,930 295 $406,881 33 $290,576 1 $410,000 106 $480,236 APPLICATIONS APPROVED, NOT ACCEPTED 18 $465,889 38 $376,342 10 $117,200 0 $0 11 $488,545 APPLICATIONS DENIED 33 $441,515 120 $385,433 23 $130,391 0 $0 20 $513,750 APPLICATIONS WITHDRAWN 19 $489,842 67 $440,328 5 $108,400 0 $0 18 $400,944 FILES CLOSED FOR INCOMPLETENESS 9 $375,889 47 $444,277 1 $400,000 0 $0 8 $562,750
Aggregated Statistics For Year 2005(Based on 1 full tract) B) Conventional C) Refinancings D) Home Improvement Loans F) Non-occupant Loans on G) Loans On Manufactured Number Average Value Number Average Value Number Average Value Number Average Value Number Average Value
LOANS ORIGINATED 215 $457,758 300 $374,477 30 $253,833 116 $491,371 0 $0 APPLICATIONS APPROVED, NOT ACCEPTED 41 $369,463 45 $341,444 6 $57,333 20 $428,650 0 $0 APPLICATIONS DENIED 49 $387,388 112 $397,893 23 $154,957 26 $389,423 1 $1,000 APPLICATIONS WITHDRAWN 31 $457,677 92 $461,152 13 $204,308 18 $841,722 0 $0 FILES CLOSED FOR INCOMPLETENESS 13 $481,154 77 $375,182 4 $207,500 11 $367,545 0 $0
Aggregated Statistics For Year 2004(Based on 1 full tract) B) Conventional C) Refinancings D) Home Improvement Loans F) Non-occupant Loans on G) Loans On Manufactured Number Average Value Number Average Value Number Average Value Number Average Value Number Average Value
LOANS ORIGINATED 210 $440,343 373 $315,713 29 $255,897 142 $432,739 0 $0 APPLICATIONS APPROVED, NOT ACCEPTED 23 $416,174 57 $293,316 12 $111,417 24 $395,000 0 $0 APPLICATIONS DENIED 40 $368,300 101 $350,426 24 $181,792 20 $313,750 2 $40,000 APPLICATIONS WITHDRAWN 26 $389,654 84 $317,714 10 $200,000 15 $313,000 0 $0 FILES CLOSED FOR INCOMPLETENESS 9 $363,778 56 $369,714 5 $119,400 5 $379,000 0 $0
Aggregated Statistics For Year 2003(Based on 1 full tract) A) FHA, FSA/RHS & VA B) Conventional C) Refinancings D) Home Improvement Loans F) Non-occupant Loans on Number Average Value Number Average Value Number Average Value Number Average Value Number Average Value
LOANS ORIGINATED 0 $0 219 $372,247 647 $263,808 18 $73,111 238 $336,210 APPLICATIONS APPROVED, NOT ACCEPTED 0 $0 21 $345,238 93 $246,602 7 $53,571 19 $297,947 APPLICATIONS DENIED 0 $0 45 $349,533 175 $251,286 14 $48,429 29 $271,586 APPLICATIONS WITHDRAWN 2 $272,500 18 $336,444 129 $269,527 4 $138,750 13 $305,923 FILES CLOSED FOR INCOMPLETENESS 0 $0 9 $324,444 36 $248,250 4 $61,250 9 $243,333
Aggregated Statistics For Year 2002(Based on 1 full tract) A) FHA, FSA/RHS & VA B) Conventional C) Refinancings D) Home Improvement Loans F) Non-occupant Loans on Number Average Value Number Average Value Number Average Value Number Average Value Number Average Value
LOANS ORIGINATED 0 $0 194 $295,361 538 $229,935 33 $97,636 191 $272,686 APPLICATIONS APPROVED, NOT ACCEPTED 0 $0 24 $304,375 92 $219,185 8 $44,125 21 $284,952 APPLICATIONS DENIED 0 $0 31 $298,161 103 $252,330 13 $49,077 25 $292,640 APPLICATIONS WITHDRAWN 1 $170,000 20 $276,300 89 $217,685 14 $53,000 12 $301,917 FILES CLOSED FOR INCOMPLETENESS 0 $0 4 $231,500 31 $415,226 1 $100,000 1 $400,000
Aggregated Statistics For Year 2001(Based on 1 full tract) A) FHA, FSA/RHS & VA B) Conventional C) Refinancings D) Home Improvement Loans F) Non-occupant Loans on Number Average Value Number Average Value Number Average Value Number Average Value Number Average Value
LOANS ORIGINATED 1 $238,000 186 $254,269 330 $208,685 30 $44,000 113 $249,522 APPLICATIONS APPROVED, NOT ACCEPTED 0 $0 25 $257,920 65 $211,985 7 $112,000 12 $304,583 APPLICATIONS DENIED 0 $0 42 $272,190 79 $187,810 26 $39,654 18 $265,611 APPLICATIONS WITHDRAWN 0 $0 11 $342,909 86 $150,628 10 $45,300 8 $214,250 FILES CLOSED FOR INCOMPLETENESS 0 $0 4 $356,250 23 $166,043 1 $78,000 4 $176,250
Aggregated Statistics For Year 2000(Based on 1 full tract) A) FHA, FSA/RHS & VA B) Conventional C) Refinancings D) Home Improvement Loans E) Loans on Dwellings For 5+ Families F) Non-occupant Loans on Number Average Value Number Average Value Number Average Value Number Average Value Number Average Value Number Average Value
LOANS ORIGINATED 4 $199,750 218 $272,537 129 $192,659 36 $47,750 0 $0 94 $330,074 APPLICATIONS APPROVED, NOT ACCEPTED 0 $0 29 $286,931 28 $166,786 11 $27,818 0 $0 10 $430,800 APPLICATIONS DENIED 3 $226,333 65 $239,646 69 $140,029 18 $25,500 0 $0 21 $215,381 APPLICATIONS WITHDRAWN 0 $0 24 $208,833 47 $111,085 9 $33,778 1 $17,000 12 $137,417 FILES CLOSED FOR INCOMPLETENESS 1 $176,000 3 $196,667 9 $138,000 2 $55,000 0 $0 4 $167,000
Aggregated Statistics For Year 1999(Based on 1 full tract) A) FHA, FSA/RHS & VA B) Conventional C) Refinancings D) Home Improvement Loans F) Non-occupant Loans on Number Average Value Number Average Value Number Average Value Number Average Value Number Average Value
LOANS ORIGINATED 4 $153,895 216 $223,217 230 $153,711 22 $45,843 102 $260,526 APPLICATIONS APPROVED, NOT ACCEPTED 0 $0 24 $273,996 39 $139,675 8 $27,464 13 $336,978 APPLICATIONS DENIED 1 $171,320 52 $183,305 67 $201,829 13 $67,604 23 $194,927 APPLICATIONS WITHDRAWN 3 $149,703 12 $167,366 57 $127,933 10 $90,111 11 $134,362 FILES CLOSED FOR INCOMPLETENESS 0 $0 8 $237,499 21 $193,257 0 $0 3 $112,277
Detailed HMDA statistics for the following Tracts:
2010.01
Private Mortgage Insurance Companies Aggregated Statistics For Year 2009(Based on 1 full tract) A) Conventional Number Average Value
LOANS ORIGINATED 2 $383,500 APPLICATIONS APPROVED, NOT ACCEPTED 0 $0 APPLICATIONS DENIED 0 $0 APPLICATIONS WITHDRAWN 0 $0 FILES CLOSED FOR INCOMPLETENESS 1 $407,000
Aggregated Statistics For Year 2008(Based on 1 full tract) A) Conventional B) Refinancings Number Average Value Number Average Value
LOANS ORIGINATED 2 $555,500 1 $711,000 APPLICATIONS APPROVED, NOT ACCEPTED 1 $553,000 1 $628,000 APPLICATIONS DENIED 1 $477,000 0 $0 APPLICATIONS WITHDRAWN 0 $0 1 $711,000 FILES CLOSED FOR INCOMPLETENESS 0 $0 0 $0
Aggregated Statistics For Year 2007(Based on 1 full tract) A) Conventional B) Refinancings C) Non-occupant Loans on Number Average Value Number Average Value Number Average Value
LOANS ORIGINATED 5 $548,400 2 $649,000 1 $574,000 APPLICATIONS APPROVED, NOT ACCEPTED 1 $553,000 0 $0 0 $0 APPLICATIONS DENIED 0 $0 0 $0 0 $0 APPLICATIONS WITHDRAWN 0 $0 0 $0 0 $0 FILES CLOSED FOR INCOMPLETENESS 0 $0 0 $0 0 $0
Aggregated Statistics For Year 2006(Based on 1 full tract) A) Conventional B) Refinancings C) Non-occupant Loans on Number Average Value Number Average Value Number Average Value
LOANS ORIGINATED 1 $527,000 0 $0 1 $527,000 APPLICATIONS APPROVED, NOT ACCEPTED 0 $0 2 $540,000 2 $540,000 APPLICATIONS DENIED 0 $0 0 $0 0 $0 APPLICATIONS WITHDRAWN 1 $170,000 0 $0 0 $0 FILES CLOSED FOR INCOMPLETENESS 0 $0 0 $0 0 $0
Aggregated Statistics For Year 2005(Based on 1 full tract) A) Conventional B) Refinancings C) Non-occupant Loans on Number Average Value Number Average Value Number Average Value
LOANS ORIGINATED 4 $390,750 2 $725,500 1 $451,000 APPLICATIONS APPROVED, NOT ACCEPTED 0 $0 1 $422,000 0 $0 APPLICATIONS DENIED 0 $0 0 $0 0 $0 APPLICATIONS WITHDRAWN 0 $0 2 $431,000 0 $0 FILES CLOSED FOR INCOMPLETENESS 0 $0 0 $0 0 $0
Aggregated Statistics For Year 2004(Based on 1 full tract) A) Conventional B) Refinancings C) Non-occupant Loans on Number Average Value Number Average Value Number Average Value
LOANS ORIGINATED 14 $395,643 1 $184,000 1 $334,000 APPLICATIONS APPROVED, NOT ACCEPTED 6 $454,167 1 $272,000 0 $0 APPLICATIONS DENIED 0 $0 1 $833,000 1 $833,000 APPLICATIONS WITHDRAWN 1 $314,000 1 $484,000 0 $0 FILES CLOSED FOR INCOMPLETENESS 0 $0 0 $0 0 $0
Aggregated Statistics For Year 2003(Based on 1 full tract) A) Conventional B) Refinancings C) Non-occupant Loans on Number Average Value Number Average Value Number Average Value
LOANS ORIGINATED 27 $353,407 2 $342,000 0 $0 APPLICATIONS APPROVED, NOT ACCEPTED 10 $349,700 5 $326,800 1 $323,000 APPLICATIONS DENIED 1 $338,000 1 $348,000 0 $0 APPLICATIONS WITHDRAWN 2 $391,000 0 $0 0 $0 FILES CLOSED FOR INCOMPLETENESS 0 $0 1 $348,000 0 $0
Aggregated Statistics For Year 2002(Based on 1 full tract) A) Conventional B) Refinancings C) Non-occupant Loans on Number Average Value Number Average Value Number Average Value
LOANS ORIGINATED 42 $285,643 6 $270,833 4 $266,250 APPLICATIONS APPROVED, NOT ACCEPTED 22 $305,409 5 $278,200 3 $244,000 APPLICATIONS DENIED 5 $363,800 1 $426,000 1 $356,000 APPLICATIONS WITHDRAWN 4 $346,250 1 $194,000 1 $223,000 FILES CLOSED FOR INCOMPLETENESS 0 $0 0 $0 0 $0
Aggregated Statistics For Year 2001(Based on 1 full tract) A) Conventional B) Refinancings C) Non-occupant Loans on Number Average Value Number Average Value Number Average Value
LOANS ORIGINATED 53 $253,189 3 $215,333 3 $270,333 APPLICATIONS APPROVED, NOT ACCEPTED 18 $239,611 1 $275,000 7 $250,429 APPLICATIONS DENIED 2 $182,500 0 $0 1 $189,000 APPLICATIONS WITHDRAWN 2 $336,500 0 $0 0 $0 FILES CLOSED FOR INCOMPLETENESS 1 $193,000 0 $0 0 $0
Aggregated Statistics For Year 2000(Based on 1 full tract) A) Conventional B) Refinancings C) Non-occupant Loans on Number Average Value Number Average Value Number Average Value
LOANS ORIGINATED 61 $212,557 6 $154,167 8 $228,875 APPLICATIONS APPROVED, NOT ACCEPTED 14 $194,429 1 $130,000 2 $180,000 APPLICATIONS DENIED 5 $215,400 0 $0 0 $0 APPLICATIONS WITHDRAWN 3 $255,333 0 $0 0 $0 FILES CLOSED FOR INCOMPLETENESS 0 $0 0 $0 0 $0
Aggregated Statistics For Year 1999(Based on 1 full tract) A) Conventional B) Refinancings C) Non-occupant Loans on Number Average Value Number Average Value Number Average Value
LOANS ORIGINATED 51 $179,194 7 $173,254 7 $173,807 APPLICATIONS APPROVED, NOT ACCEPTED 4 $166,962 1 $133,570 0 $0 APPLICATIONS DENIED 2 $189,225 0 $0 0 $0 APPLICATIONS WITHDRAWN 2 $136,960 0 $0 0 $0 FILES CLOSED FOR INCOMPLETENESS 1 $146,150 0 $0 0 $0
Detailed PMIC statistics for the following Tracts:
2010.01
Springs compared to New York state average:
Median household income above state average. Median house value significantly above state average. Unemployed percentage significantly below state average. Black race population percentage significantly below state average. Hispanic race population percentage significantly above state average. Foreign-born population percentage above state average. Renting percentage below state average. Length of stay since moving in significantly above state average. House age below state average. Percentage of population with a bachelor's degree or higher above state average.
#3 on the list of "Top 101 cities with the most residents born in Ecuador (population 500+)"
#10 on the list of "Top 101 cities with the most residents born in Middle Africa (population 500+)"
#25 on the list of "Top 101 cities with largest percentage of females in occupations: building and grounds cleaning and maintenance occupations (population 5,000+)"
#26 on the list of "Top 101 cities with the largest percentage of likely gay men couples (counted as self-reported male-male unmarried-partner households) (population 5,000+)"
#28 on the list of "Top 101 cities with largest percentage of males in industries: construction (population 5,000+)"
#29 on the list of "Top 101 cities with largest percentage of females in industries: other services, except public administration (population 5,000+)"
#29 on the list of "Top 101 cities with the largest percentage of one, detached housing units in structures (2,000+ housing units)"
#30 on the list of "Top 101 cities with the most residents born in South America (population 500+)"
#31 on the list of "Top 101 cities with the largest percentage of likely homosexual households (counted as self-reported same-sex unmarried-partner households) (population 5,000+)"
#42 on the list of "Top 101 cities with the most residents born in Europe, n.e.c. (population 500+)"
#56 on the list of "Top 101 cities with largest percentage of males in occupations: construction and extraction occupations (population 5,000+)"
#63 on the list of "Top 101 cities with largest percentage of females in industries: construction (population 5,000+)"
#65 on the list of "Top 101 cities with the largest percentage of likely lesbian couples (counted as self-reported female-female unmarried-partner households) (population 5,000+)"
#69 on the list of "Top 101 cities with the most residents born in Colombia (population 500+)"
#83 on the list of "Top 101 cities with the highest percentage of workers working at home, population 5,000+"
#94 on the list of "Top 101 cities with the most people living the same house as 1 year ago (population 5,000+))"
#42 (11937) on the list of "Top 101 zip codes with the largest percentage of taxpayers reporting profit/loss from business in 2012 (pop 5,000+)"
#89 (11937) on the list of "Top 101 zip codes with the highest 2012 average net capital gain/loss (pop 5,000+)"
#3 on the list of "Top 101 counties with the most Catholic adherents"
#6 on the list of "Top 101 counties with the lowest percentage of residents relocating from other counties between 2010 and 2011"
#7 on the list of "Top 101 counties with the lowest surface withdrawal of fresh water for public supply (pop. 50,000+)"
#9 on the list of "Top 101 counties with the lowest percentage of residents relocating to other counties in 2011"
#19 on the list of "Top 101 counties with the highest ground withdrawal of fresh water for public supply (pop. 50,000+)"
Top Patent Applicants
Total of 1 patent application in 2008-2024.


 Recent articles from our blog. Our writers, many of them Ph.D. graduates or candidates, create easy-to-read articles on a wide variety of topics.

 (44.5 miles