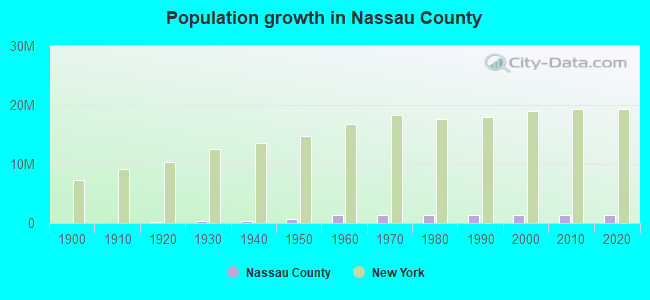
Nassau County, New York (NY)
County owner-occupied free and clear houses and condos in 2010: 114,460
County owner-occupied houses and condos in 2000: 359,257
Renter-occupied apartments: 90,228 (it was 88,130 in 2000)
| % of renters here: | 20% |
| State: | 47% |
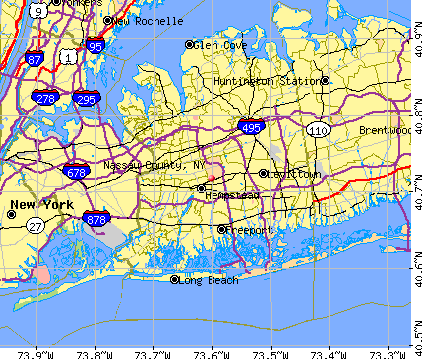
Land area: 287 sq. mi.
Water area: 166.4 sq. mi.
Population density: 4827 people per square mile (very high).
Industries providing employment: Educational, health and social services (31.1%), Professional, scientific, management, administrative, and waste management services (13.4%).
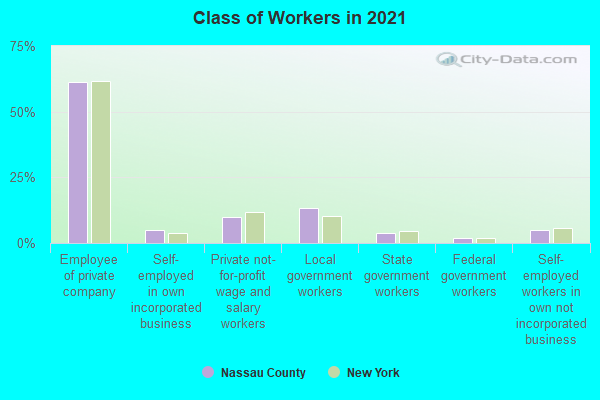
Type of workers:
- Private wage or salary: 78%
- Government: 17%
- Self-employed, not incorporated: 5%
- Unpaid family work: 0%
- OSM Map
- General Map
- Google Map
- MSN Map

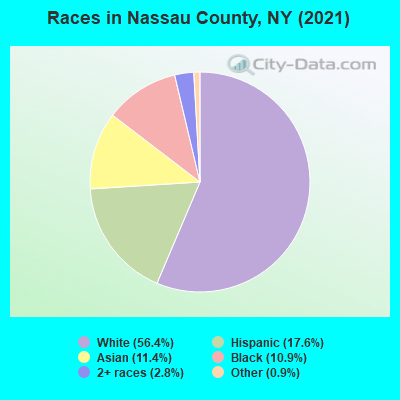
- 755,12254.6%White Non-Hispanic Alone
- 247,64617.9%Hispanic or Latino
- 172,33912.5%Asian alone
- 155,39811.2%Black Non-Hispanic Alone
- 34,6602.5%Two or more races
- 17,4011.3%Some other race alone
- 9660.07%American Indian and Alaska Native alone
- 1940.01%Native Hawaiian and Other
Pacific Islander alone
| Median resident age: | 41.8 years |
| New York median age: | 40.0 years |
| Males: 681,928 | |
| Females: 701,798 |


| Nassau County: | 2.0 people |
| New York: | 3 people |
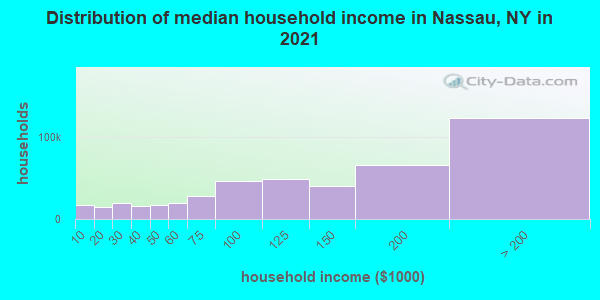
Estimated median household income in 2022: $136,984 ($72,030 in 1999)
| This county: | $136,984 |
| New York: | $79,557 |
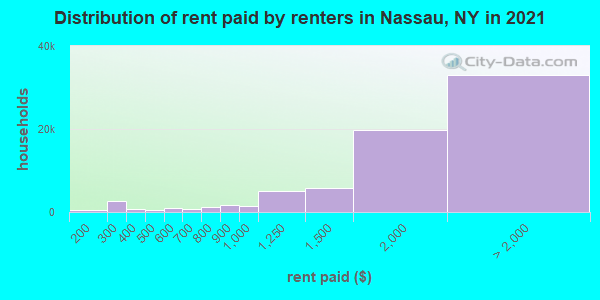
Median contract rent in 2022 for apartments: $1,846 (lower quartile is $1,276, upper quartile is $2,580)
| This county: | $1846 |
| State: | $1354 |
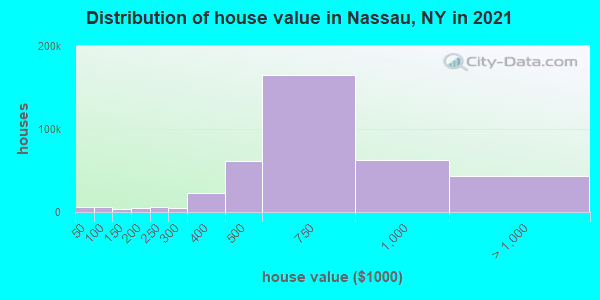
Estimated median house or condo value in 2022: $654,600 (it was $240,200 in 2000)
| Nassau: | $654,600 |
| New York: | $400,400 |
Mean price in 2022:
Median monthly housing costs for homes and condos with a mortgage: $3,485Detached houses: $818,157
Here: $818,157 State: $476,719 Townhouses or other attached units: $921,906
Here: $921,906 State: $699,270 In 2-unit structures: $649,689
Here: $649,689 State: $713,077 In 3-to-4-unit structures: $388,210
Here: $388,210 State: $764,568 In 5-or-more-unit structures: $438,581
Here: $438,581 State: $912,009 Mobile homes: $1,122,213
Here: $1,122,213 State: $88,925
Median monthly housing costs for units without a mortgage: $1,501
Institutionalized population: 9,423
Crime in 2020 (reported by the sheriff's office or county police, not the county total):
- Murders: 14
- Rapes: 45
- Robberies: 358
- Assaults: 887
- Burglaries: 752
- Thefts: 7365
- Auto thefts: 455
Crime in 2019 (reported by the sheriff's office or county police, not the county total):
- Murders: 9
- Rapes: 40
- Robberies: 339
- Assaults: 791
- Burglaries: 583
- Thefts: 8677
- Auto thefts: 395
Health of residents in Nassau County based on CDC Behavioral Risk Factor Surveillance System Survey Questionnaires from 2003 to 2012:
General health status score of residents in this county from 1 (poor) to 5 (excellent) is 3.6. This is better than average.75.9% of residents exercised in the past month. This is about average.
46.9% of residents smoked 100+ cigarettes in their lives. This is about average.
87.1% of adult residents drank alcohol in the past 30 days. This is more than average.
79.5% of residents visited a dentist within the past year. This is more than average.
Average weight of males is 191 pounds. This is about average.
Average weight of females is 154 pounds. This is less than average.
8.3% of residents keep firearms around their homes. This is less than average.
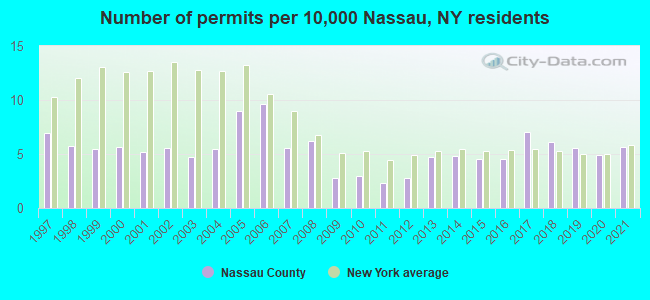
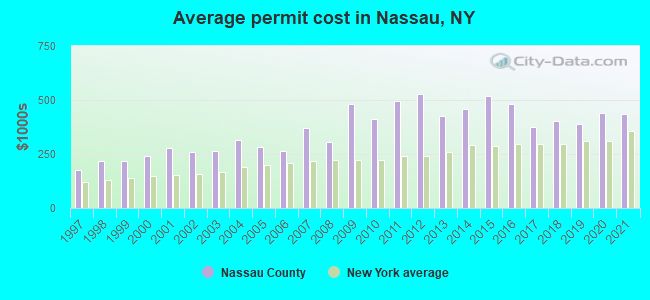
Single-family new house construction building permits:
- 2022: 581 buildings, average cost: $655,500
- 2021: 753 buildings, average cost: $432,800
- 2020: 657 buildings, average cost: $442,000
- 2019: 736 buildings, average cost: $386,600
- 2018: 816 buildings, average cost: $402,500
- 2017: 943 buildings, average cost: $374,200
- 2016: 609 buildings, average cost: $481,000
- 2015: 608 buildings, average cost: $519,700
- 2014: 640 buildings, average cost: $457,400
- 2013: 630 buildings, average cost: $426,600
- 2012: 375 buildings, average cost: $530,000
- 2011: 311 buildings, average cost: $493,700
- 2010: 400 buildings, average cost: $413,700
- 2009: 365 buildings, average cost: $482,400
- 2008: 822 buildings, average cost: $307,000
- 2007: 737 buildings, average cost: $369,800
- 2006: 1291 buildings, average cost: $266,300
- 2005: 1197 buildings, average cost: $281,700
- 2004: 735 buildings, average cost: $313,100
- 2003: 635 buildings, average cost: $265,000
- 2002: 740 buildings, average cost: $259,300
- 2001: 688 buildings, average cost: $276,200
- 2000: 753 buildings, average cost: $241,200
- 1999: 730 buildings, average cost: $217,000
- 1998: 770 buildings, average cost: $216,600
- 1997: 925 buildings, average cost: $174,600
Median real estate property taxes paid for housing units with mortgages in 2022: $10,001 (1.5%)
Median real estate property taxes paid for housing units with no mortgage in 2022: $10,001 (1.6%)
| Nassau County: | 5.3% |
| New York: | 14.3% |
Median age of residents in 2022: 41.8 years old
(Males: 40.5 years old, Females: 43.0 years old)
(Median age for: White residents: 48.1 years old, Black residents: 39.2 years old, American Indian residents: 43.1 years old, Asian residents: 38.7 years old, Hispanic or Latino residents: 34.4 years old, Other race residents: 36.0 years old)
Area name: Nassau-Suffolk, NY HUD Metro FMR Area
Fair market rent in 2006 for a 1-bedroom apartment in Nassau County is $1084 a month.
Fair market rent for a 2-bedroom apartment is $1280 a month.
Fair market rent for a 3-bedroom apartment is $1699 a month.
Cities in this county include: North Hempstead, Hempstead, Levittown, Freeport, Hicksville, East Meadow, Valley Stream, Long Beach, Oceanside, Elmont.
| City or Town | Homes measured | Living Area | Basement | ||
|---|---|---|---|---|---|
| Homes Above 4 pCi/L Best Estimate (%) | Homes Above 4 pCi/L Range (%) | Homes Above 4 pCi/L Best Estimate (%) | Homes Above 4 pCi/L Range (%) | ||
| Glen Cove city | 5 | 0.4 | 0.1 - 1.7 | 8 | 3 - 17 |
| Hempstead town | 279 | 0.1 | 0.1 - 0.2 | 2.1 | 1.7 - 2.7 |
| Long Beach city | 0 | 0.5 | 0.2 - 4.0 | 8 | 1 - 16 |
| North Hempstead town | 140 | 0.2 | 0.1 - 0.4 | 6 | 4 - 7 |
| Oyster Bay town | 166 | 0.5 | 0.3 - 0.9 | 8 | 6 - 9 |
| Nassau county | 590 | 0.3 | 4 | ||
2023 air pollution in Nassau County:
Particulate Matter (PM2.5) Annual: 7.7 µg/m3(standard limit: 15.0 µg/m3). Near U.S. average.
Sulfur Oxides Annual: 0.000 ppm (standard limit: 0.03 ppm). Near U.S. average.
Neighboring counties: Allen County, Ohio  , Carroll County, Ohio , Knox County, Ohio , Medina County, Ohio , Wayne County, Ohio .
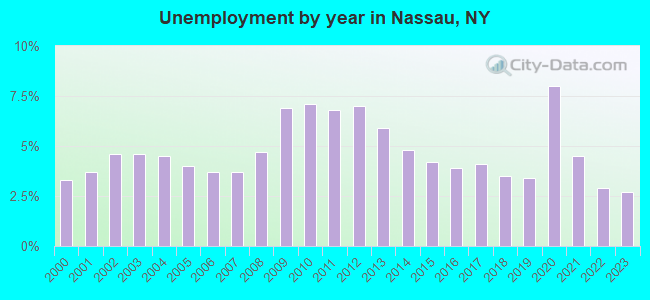
| Here: | 3.4% |
| New York: | 4.4% |
Current college students: 81,375
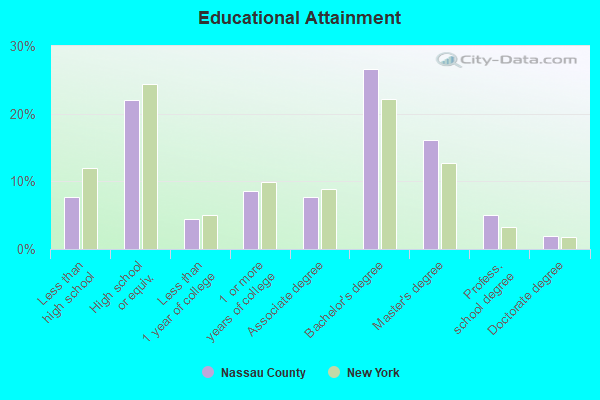
People 25 years of age or older with a high school degree or higher: 91.3%
People 25 years of age or older with a bachelor's degree or higher: 49.3%
Number of foreign born residents: 323,718 (70.2% naturalized citizens)
| Nassau County: | 23.4% |
| Whole state: | 22.7% |
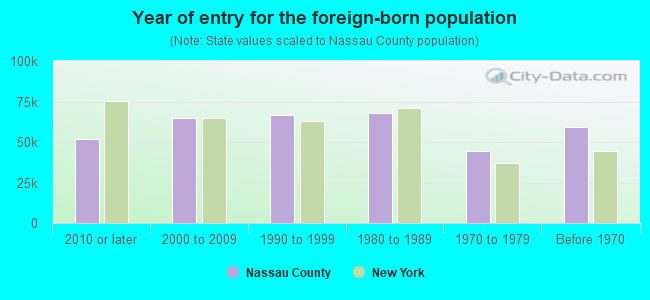
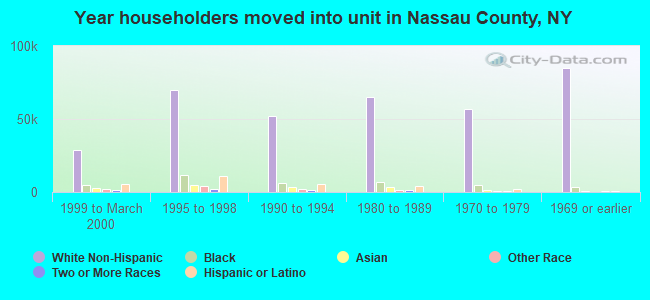
- Year of entry for the foreign-born population
- 57,6042010 or later
- 72,3702000 to 2009
- 69,1351990 to 1999
- 68,1241980 to 1989
- 44,7501970 to 1979
- 59,518Before 1970
Mean travel time to work (commute): % minutes
Percentage of county residents living and working in this county: 99.0%

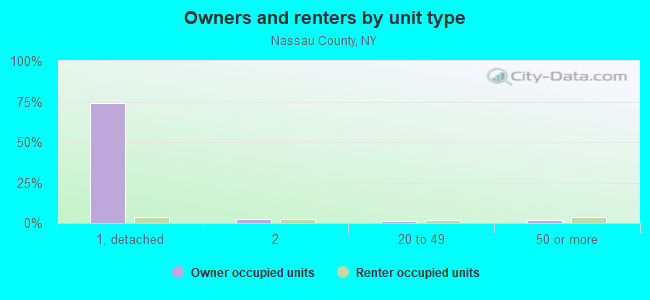
Housing units in structures:
- One, detached: 356,219
- One, attached: 15,433
- Two: 29,886
- 3 or 4: 9,766
- 5 to 9: 10,965
- 10 to 19: 10,887
- 20 to 49: 15,783
- 50 or more: 28,773
- Mobile homes: 1,487
- Boats, RVs, vans, etc.: 44
Housing units in Nassau County with a mortgage: 234,714 (30,534 second mortgage, 803 home equity loan, 26,925 both second mortgage and home equity loan)
Houses without a mortgage: 9,191
| Here: | 96.3% with mortgage |
| State: | 95.5% with mortgage |
Religion statistics for Nassau County
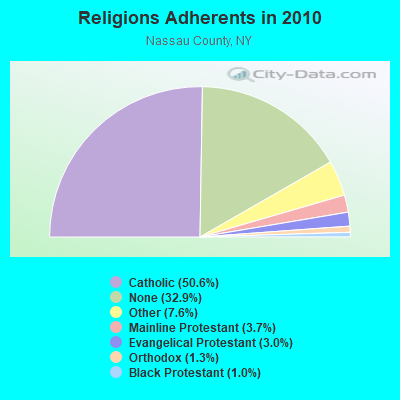
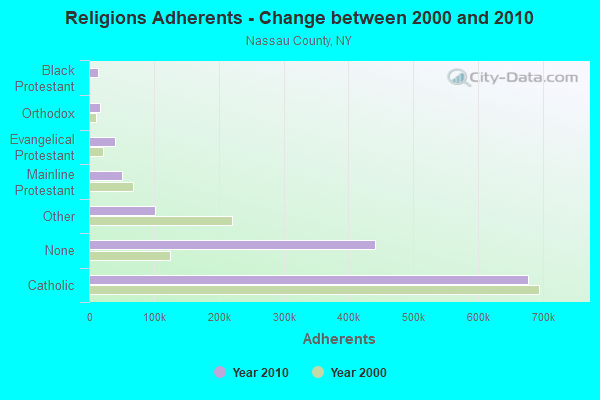
| Religion | Adherents | Congregations |
|---|---|---|
| Catholic | 677,149 | 73 |
| Other | 102,012 | 168 |
| Mainline Protestant | 50,181 | 184 |
| Evangelical Protestant | 39,923 | 251 |
| Orthodox | 16,758 | 22 |
| Black Protestant | 13,189 | 45 |
| None | 440,320 | - |
Source: Clifford Grammich, Kirk Hadaway, Richard Houseal, Dale E.Jones, Alexei Krindatch, Richie Stanley and Richard H.Taylor. 2012. 2010 U.S.Religion Census: Religious Congregations & Membership Study. Association of Statisticians of American Religious Bodies. Jones, Dale E., et al. 2002. Congregations and Membership in the United States 2000. Nashville, TN: Glenmary Research Center.
Food Environment Statistics:
| Nassau County: | 4.11 / 10,000 pop. |
| State: | 4.13 / 10,000 pop. |
| Here: | 0.05 / 10,000 pop. |
| New York: | 0.06 / 10,000 pop. |
| This county: | 1.49 / 10,000 pop. |
| New York: | 0.92 / 10,000 pop. |
| Nassau County: | 1.29 / 10,000 pop. |
| New York: | 1.68 / 10,000 pop. |
| This county: | 9.01 / 10,000 pop. |
| State: | 8.82 / 10,000 pop. |
| Nassau County: | 8.3% |
| New York: | 8.2% |
| Nassau County: | 20.9% |
| State: | 23.8% |
| Here: | 22.2% |
| State: | 15.6% |
Agriculture in Nassau County:
Average size of farms: 17 acresAverage value of agricultural products sold per farm: $126,935
The value of nursery, greenhouse, floriculture, and sod as a percentage of the total market value of agricultural products sold: 62.56%
Average total farm production expenses per farm: $84,868
Harvested cropland as a percentage of land in farms: 43.20%
Irrigated harvested cropland as a percentage of land in farms: 24.02%
Average market value of all machinery and equipment per farm: $97,143
The percentage of farms operated by a family or individual: 58.46%
Average age of principal farm operators: 50 years
Vegetables: 78 harvested acres
Land in orchards: 97 acres
Earthquake activity:
Nassau County-area historical earthquake activity is significantly above New York state average. It is 70% smaller than the overall U.S. average.On 8/23/2011 at 17:51:04, a magnitude 5.8 (5.8 MW, Depth: 3.7 mi, Class: Moderate, Intensity: VI - VII) earthquake occurred 302.4 miles away from Nassau County center
On 10/7/1983 at 10:18:46, a magnitude 5.3 (5.1 MB, 5.3 LG, 5.1 ML) earthquake occurred 227.1 miles away from the county center
On 4/20/2002 at 10:50:47, a magnitude 5.3 (5.3 ML, Depth: 3.0 mi) earthquake occurred 262.6 miles away from the county center
On 1/16/1994 at 01:49:16, a magnitude 4.6 (4.6 MB, 4.6 LG, Depth: 3.1 mi, Class: Light, Intensity: IV - V) earthquake occurred 130.7 miles away from the county center
On 4/20/2002 at 10:50:47, a magnitude 5.2 (5.2 MB, 4.2 MS, 5.2 MW, 5.0 MW) earthquake occurred 260.9 miles away from Nassau County center
On 8/22/1992 at 12:20:32, a magnitude 4.8 (4.8 MB, 3.8 MS, 4.7 LG, Depth: 6.2 mi) earthquake occurred 206.7 miles away from the county center
Magnitude types: regional Lg-wave magnitude (LG), body-wave magnitude (MB), local magnitude (ML), surface-wave magnitude (MS), moment magnitude (MW)
Most recent natural disasters:
- New York Tropical Storm Isaias, Incident Period: August 4, 2020, FEMA Id: 4567, Natural disaster type: Tropical Storm
- New York Covid-19 Pandemic, Incident Period: January 20, 2020, Major Disaster (Presidential) Declared DR-4480-NY: March 20, 2020, FEMA Id: 4480, Natural disaster type: Other
- New York Hurricane Sandy, Incident Period: October 27, 2012 to November 09, 2012, Emergency Declared EM-3351: October 28, 2012, FEMA Id: 3351, Natural disaster type: Hurricane
- New York Hurricane Sandy, Incident Period: October 27, 2012 to November 09, 2012, Major Disaster (Presidential) Declared DR-4085: October 30, 2012, FEMA Id: 4085, Natural disaster type: Hurricane
- New York Hurricane Irene, Incident Period: August 26, 2011 to September 05, 2011, Major Disaster (Presidential) Declared DR-4020: August 31, 2011, FEMA Id: 4020, Natural disaster type: Hurricane
- New York Hurricane Irene, Incident Period: August 25, 2011 to September 05, 2011, Emergency Declared EM-3328: August 26, 2011, FEMA Id: 3328, Natural disaster type: Hurricane
- New York Severe Winter Storm and Snowstorm, Incident Period: December 26, 2010 to December 27, 2010, Major Disaster (Presidential) Declared DR-1957: February 18, 2011, FEMA Id: 1957, Natural disaster type: Snowstorm, Winter Storm
- New York Severe Storms and Flooding, Incident Period: March 13, 2010 to March 31, 2010, Major Disaster (Presidential) Declared DR-1899: April 16, 2010, FEMA Id: 1899, Natural disaster type: Storm, Flood
- New York Severe Storms and Flooding Associated with Tropical Depression Ida and a Nor'easter, Incident Period: November 12, 2009 to November 14, 2009, Major Disaster (Presidential) Declared DR-1869: December 31, 2009, FEMA Id: 1869, Natural disaster type: Storm, Flood, Tropical Depression
- New York Hurricane Katrina Evacuation, Incident Period: August 29, 2005 to October 01, 2005, Emergency Declared EM-3262: September 30, 2005, FEMA Id: 3262, Natural disaster type: Hurricane
- 15 other natural disasters have been reported since 1953.
The number of natural disasters in Nassau County (25) is a lot greater than the US average (15).
Major Disasters (Presidential) Declared: 17
Emergencies Declared: 7
Causes of natural disasters: Hurricanes: 8, Storms: 7, Floods: 6, Blizzards: 2, Snowstorms: 2, Heavy Rain: 1, Power Outage: 1, Tropical Depression: 1, Tropical Storm: 1, Water Shortage: 1, Winter Storm: 1, Other: 3 (Note: some incidents may be assigned to more than one category).
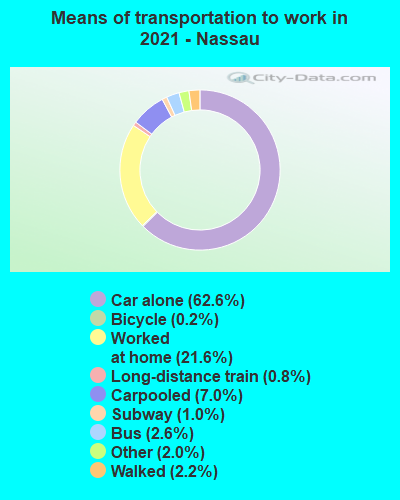
Means of transportation to work:
- Drove a car alone: 401,451 (66.2%)
- Carpooled: 43,909 (7.2%)
- Bus: 16,288 (2.7%)
- Subway or elevated rail: 6,778 (1.1%)
- Long-distance train or commuter rail: 6,542 (1.1%)
- Light rail, streetcar or trolley: 39 (0.0%)
- Ferryboat: 73 (0.0%)
- Taxicab, motorcycle, or other means: 14,039 (2.3%)
- Bicycle: 2,458 (0.4%)
- Walked: 15,607 (2.6%)
- Worked at home: 98,968 (16.3%)
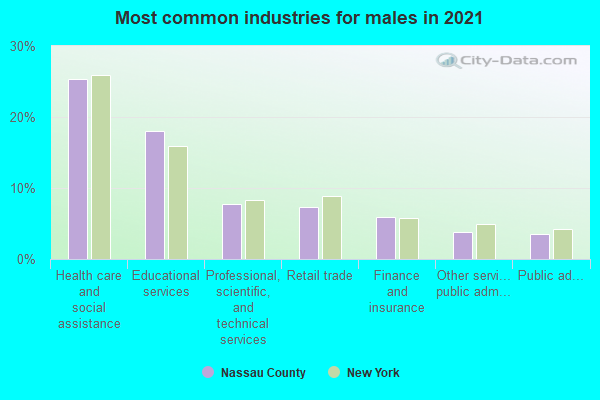
- Health care and social assistance (24%)
- Educational services (17%)
- Professional, scientific, and technical services (9%)
- Retail trade (8%)
- Finance and insurance (5%)
- Accommodation and food services (4%)
- Other services, except public administration (4%)
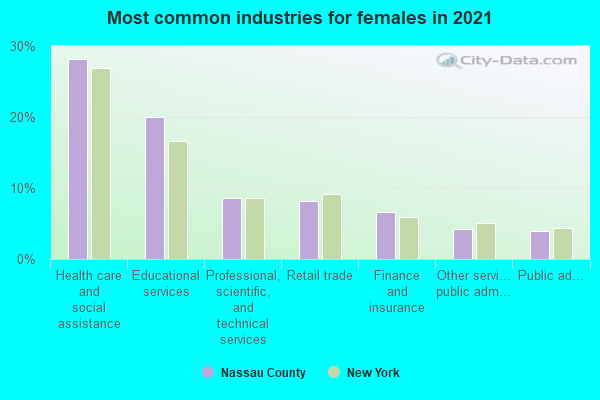
- Health care and social assistance (27%)
- Educational services (19%)
- Professional, scientific, and technical services (10%)
- Retail trade (9%)
- Finance and insurance (6%)
- Accommodation and food services (5%)
- Other services, except public administration (4%)
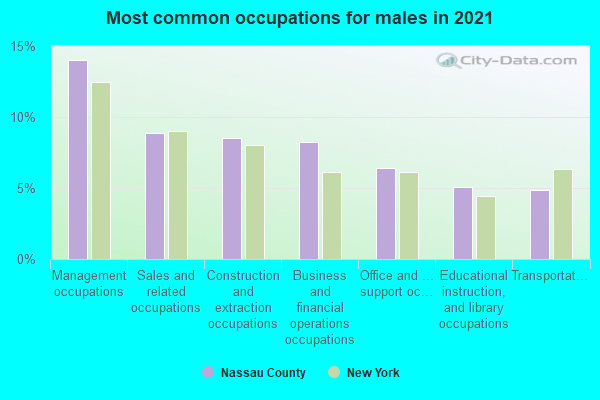
- Management occupations (14%)
- Sales and related occupations (12%)
- Construction and extraction occupations (8%)
- Business and financial operations occupations (8%)
- Transportation occupations (6%)
- Computer and mathematical occupations (5%)
- Educational instruction, and library occupations (5%)
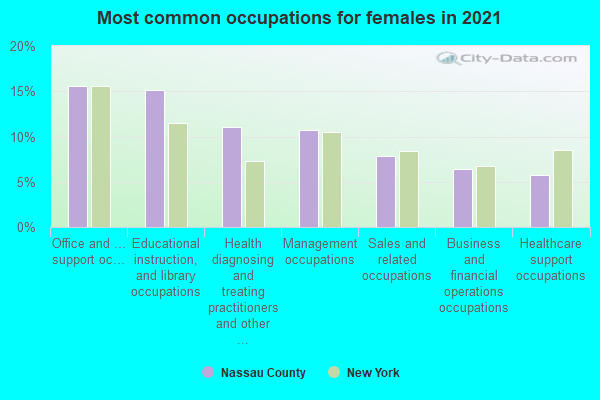
- Office and administrative support occupations (16%)
- Educational instruction, and library occupations (13%)
- Management occupations (10%)
- Health diagnosing and treating practitioners and other technical occupations (10%)
- Sales and related occupations (10%)
- Business and financial operations occupations (7%)
- Healthcare support occupations (6%)
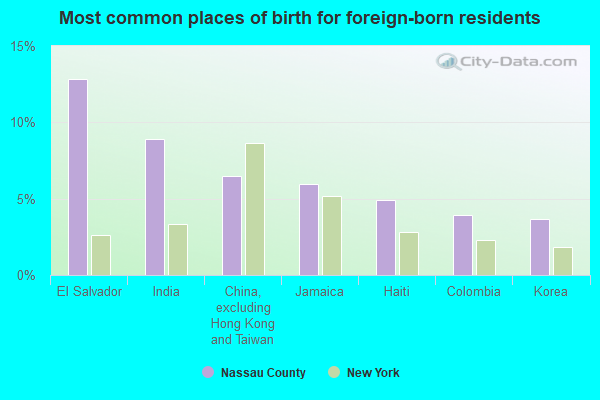
- El Salvador (10%)
- India (8%)
- China, excluding Hong Kong and Taiwan (7%)
- Jamaica (5%)
- Haiti (5%)
- Dominican Republic (5%)
- Colombia (3%)
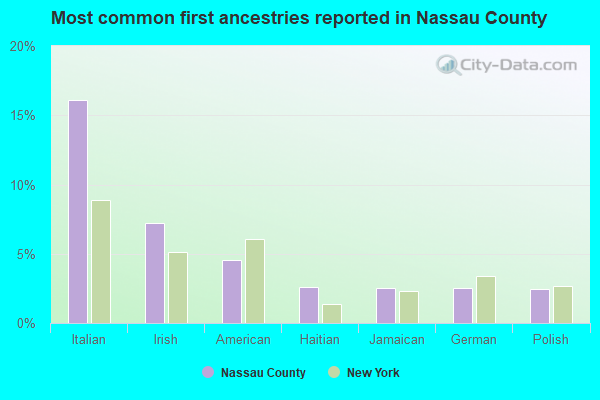
- Italian (16%)
- Irish (6%)
- American (6%)
- German (3%)
- Jamaican (2%)
- Polish (2%)
- Haitian (2%)

People in group quarters in Nassau County, New York in 2010:
- 8,449 people in college/university student housing
- 7,255 people in nursing facilities/skilled-nursing facilities
- 1,773 people in group homes intended for adults
- 1,651 people in local jails and other municipal confinement facilities
- 1,146 people in other noninstitutional facilities
- 375 people in residential treatment centers for adults
- 307 people in emergency and transitional shelters (with sleeping facilities) for people experiencing homelessness
- 249 people in residential treatment centers for juveniles (non-correctional)
- 193 people in workers' group living quarters and job corps centers
- 96 people in residential schools for people with disabilities
- 60 people in group homes for juveniles (non-correctional)
- 43 people in mental (psychiatric) hospitals and psychiatric units in other hospitals
- 39 people in correctional facilities intended for juveniles
- 24 people in hospitals with patients who have no usual home elsewhere
- 6 people in correctional residential facilities
People in group quarters in Nassau County, New York in 2000:
- 7,787 people in nursing homes
- 6,859 people in college dormitories (includes college quarters off campus)
- 1,423 people in local jails and other confinement facilities (including police lockups)
- 1,257 people in other noninstitutional group quarters
- 1,241 people in homes for the mentally retarded
- 757 people in religious group quarters
- 604 people in homes for the mentally ill
- 476 people in homes for the physically handicapped
- 367 people in other group homes
- 291 people in homes or halfway houses for drug/alcohol abuse
- 281 people in homes for abused, dependent, and neglected children
- 156 people in other nonhousehold living situations
- 46 people in other workers' dormitories
- 34 people in hospitals or wards for drug/alcohol abuse
- 31 people in short-term care, detention or diagnostic centers for delinquent children
- 30 people in job corps and vocational training facilities
- 10 people in schools, hospitals, or wards for the intellectually disabled
- 4 people in military barracks, etc.
- 2 people in unknown juvenile institutions
- 2 people in agriculture workers' dormitories on farms
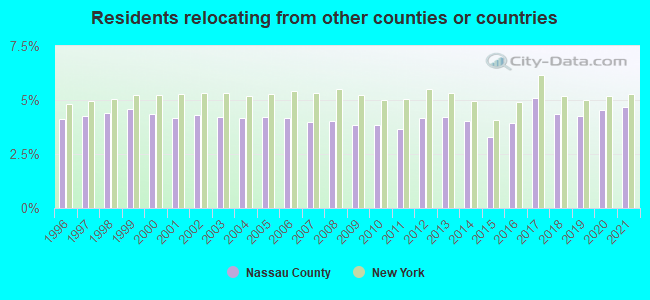
4.70% of this county's 2021 resident taxpayers lived in other counties in 2020 ($121,726 average adjusted gross income)
| Here: | 4.70% |
| New York average: | 5.29% |
0.01% of residents moved from foreign countries ($55 average AGI)
Nassau County: 0.01% New York average: 0.01%
3.74% relocated from other counties in New York ($99,095 average AGI)
0.95% relocated from other states ($22,577 average AGI)
Nassau County: 0.95% New York average: 1.86%
Top counties from which taxpayers relocated into this county between 2020 and 2021:
| from Queens County, NY | |
| from Suffolk County, NY | |
| from Kings County, NY | |
| from New York County, NY | |
| from Bronx County, NY | |
| from Westchester County, NY | |
| from Palm Beach County, FL |
5.44% of this county's 2020 resident taxpayers moved to other counties in 2021 ($120,429 average adjusted gross income)
| Here: | 5.44% |
| New York average: | 6.93% |
0.01% of residents moved to foreign countries ($114 average AGI)
Nassau County: 0.01% New York average: 0.02%
2.95% relocated to other counties in New York ($54,635 average AGI)
2.48% relocated to other states ($65,680 average AGI)
Nassau County: 2.48% New York average: 3.55%

Top counties to which taxpayers relocated from this county between 2020 and 2021:
| to Suffolk County, NY | |
| to Queens County, NY | |
| to New York County, NY | |
| to Kings County, NY | |
| to Palm Beach County, FL | |
| to Westchester County, NY | |
| to Broward County, FL |
Births per 1000 population from 1990 to 1999: 13.6
Births per 1000 population from 2000 to 2009: 11.8
Births per 1000 population from 2010 to 2022: 8.8

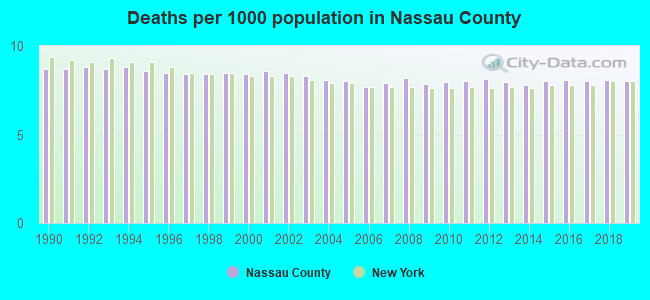
Deaths per 1000 population from 1990 to 1999: 8.6
Deaths per 1000 population from 2000 to 2009: 8.2
Deaths per 1000 population from 2010 to 2020: 8.3
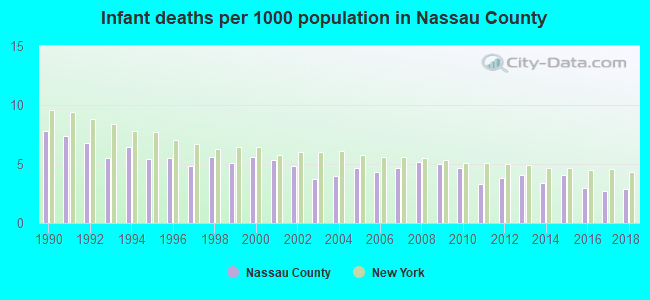
Infant deaths per 1000 live births from 1990 to 1999: 6.0
Infant deaths per 1000 live births from 2000 to 2009: 4.7
Infant deaths per 1000 live births from 2010 to 2021: 3.3
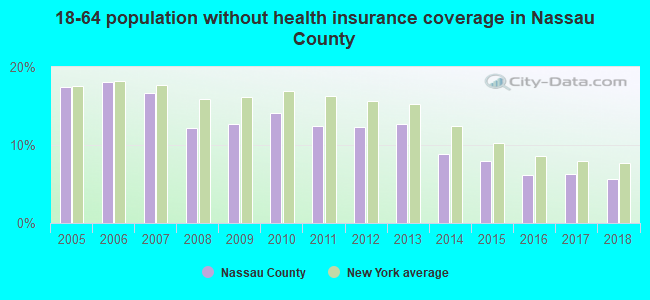
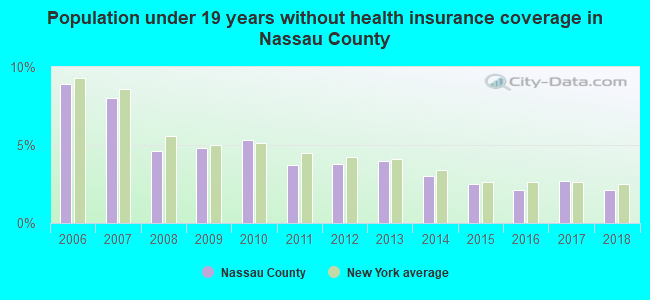
Persons under 19 years old without health insurance coverage in 2018: 2.1%
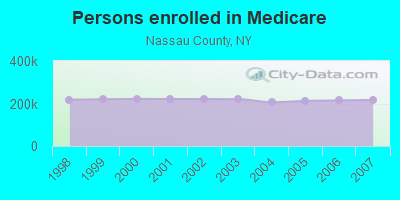
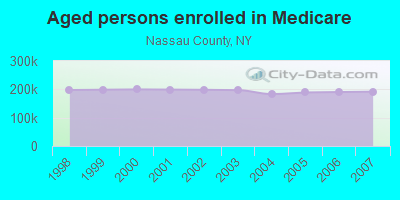
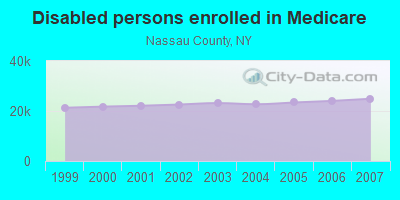
Persons enrolled in hospital insurance and/or supplemental medical insurance (Medicare) in July 1, 2007: 216,619 (191,722 aged, 24,897 disabled)
Children under 18 without health insurance coverage in 2007: 20,886 (6%)
Most common underlying causes of death in Nassau County, New York in 1999 - 2019:
- Atherosclerotic heart disease (50,176)
- Bronchus or lung, unspecified - Malignant neoplasms (12,705)
- Acute myocardial infarction, unspecified (10,615)
- Atherosclerotic cardiovascular disease, so described (6,473)
- Chronic obstructive pulmonary disease, unspecified (6,419)
- Pneumonia, unspecified (4,986)
- Unspecified dementia (4,833)
- Breast, unspecified - Malignant neoplasms (4,475)
- Stroke, not specified as haemorrhage or infarction (4,339)
- Pancreas, unspecified - Malignant neoplasms (4,258)
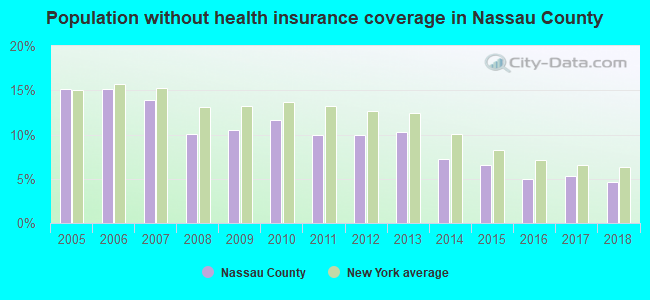
Population without health insurance coverage in 2000: 10%
Children under 18 without health insurance coverage in 2000: 8%
Short term general hospital admissions per 100,000 population in 2004: 16,798
Short term general hospital beds per 100,000 population in 2004: 353
Emergency room visits per 100,000 population in 2004: 36,105
General practice office based MDs per 100,000 population in 2005: 1,136
Medical specialist MDs per 100,000 population in 2005: 822
Dentists per 100,000 population in 1998: 15
Total births per 100,000 population, July 2005 - July 2006 : 109
Total deaths per 100,000 population, July 2005 - July 2006: 104
Limited-service eating places per 100,000 population in 2005 : 19
Beer, wine & liquor stores per 100,000 population in 2005: 1
Fitness & recreation sports centers per 100,000 population in 2005: 2,510
EPA green book nonattainment status in 2004-2006: 1
Suicides per 1,000,000 population from 2000 to 2006: 44.7. This is less than state average.
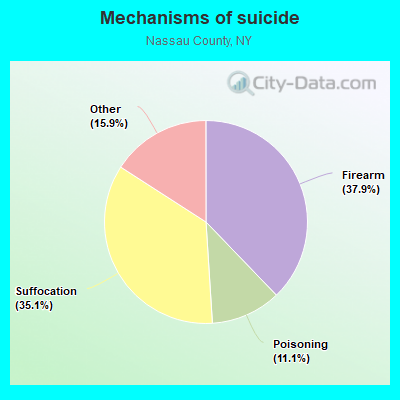
- Firearm - 16.9
- Suffocation - 15.7
- Poisoning - 5.0
- Other - 7.1
Household type by relationship:
Households: 1,383,726- Male householders: 230,432 (36,287 living alone), Female householders: 225,717 (54,785 living alone)
270,676 spouses (269,466 opposite-sex spouses), 20,711 unmarried partners, (19,686 opposite-sex unmarried partners), 448,280 children (433,533 natural, 6,219 adopted, 8,528 stepchildren), 33,073 grandchildren, 21,248 brothers or sisters, 37,585 parents, 789 foster children, 42,838 other relatives, 32,388 non-relatives
- In group quarters: 19,989
Size of family households: 117,205 2-persons, 77,721 3-persons, 85,236 4-persons, 41,055 5-persons, 14,794 6-persons, 12,856 7-or-more-persons.
Size of nonfamily households: 91,072 1-person, 13,738 2-persons, 1,510 3-persons, 518 4-persons, 280 5-persons, 81 6-persons, 83 7-or-more-persons.
209,144 married couples with children.
42,114 single-parent households (12,844 men, 29,270 women).
69.7% of residents of Nassau speak English at home.
12.8% of residents speak Spanish at home (56% speak English very well, 20% speak English well, 18% speak English not well, 6% don't speak English at all).
9.9% of residents speak other Indo-European language at home (72% speak English very well, 19% speak English well, 6% speak English not well, 3% don't speak English at all).
6.1% of residents speak Asian or Pacific Island language at home (56% speak English very well, 26% speak English well, 15% speak English not well, 3% don't speak English at all).
1.5% of residents speak other language at home (88% speak English very well, 9% speak English well, 3% speak English not well, 1% don't speak English at all).
In fiscal year 2004:
Federal Government expenditure: $8,049,151,000 ($6,008 per capita)
Department of Defense expenditure: $673,379,000
Federal direct payments to individuals for retirement and disability: $3,375,311,000
Federal other direct payments to individuals: $2,123,411,000
Federal direct payments not to individuals: $6,169,000
Federal grants: $1,294,670,000
Federal procurement contracts: $716,478,000 ($590,488,000 Department of Defense)
Federal salaries and wages: $533,112,000 ($53,270,000 Department of Defense)
Federal Government direct loans: $143,118,000
Federal guaranteed/insured loans: $290,357,000
Federal Government insurance: $4,638,450,000
Population change from April 1, 2000 to July 1, 2005:
Births: 84,861| Here: | 64 per 1000 residents |
| State: | 70 per 1000 residents |
Deaths: 58,658
| Here: | 44 per 1000 residents |
| State: | 42 per 1000 residents |
Net international migration: +26,327
| Here: | +20 per 1000 residents |
| State: | +35 per 1000 residents |
Net internal migration: -51,544
| Here: | |
| State: |
Total withdrawal of fresh water for public supply: 183.37 millions of gallons per day (all from ground)
| Here: | 6.9 |
| State: | 6.3 |
| Here: | 4.1 |
| State: | 3.8 |
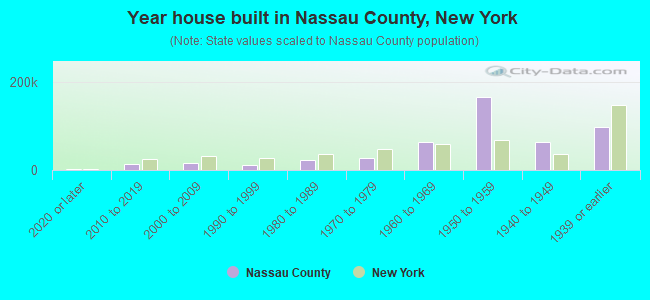
- Year house built in Nassau County, New York
- 3,8952020 or later
- 17,9672010 to 2019
- 15,0382000 to 2009
- 13,7211990 to 1999
- 22,9781980 to 1989
- 31,3091970 to 1979
- 61,0751960 to 1969
- 161,6641950 to 1959
- 60,0331940 to 1949
- 91,5631939 or earlier
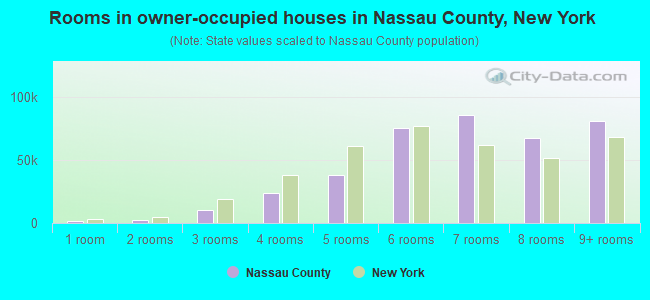
- Rooms in owner-occupied houses in Nassau County, New York
- 1,1881 room
- 3,1712 rooms
- 10,7583 rooms
- 22,6724 rooms
- 42,0315 rooms
- 76,9246 rooms
- 75,9067 rooms
- 63,4168 rooms
- 75,5149+ rooms
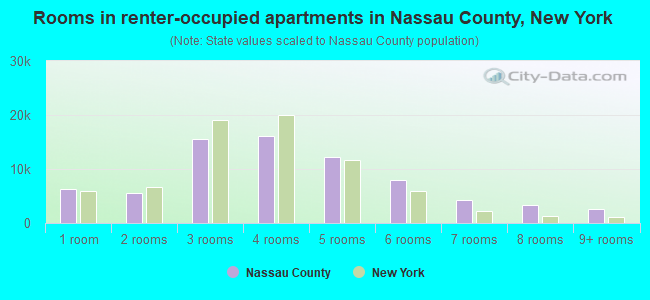
- Rooms in renter-occupied apartments in Nassau County, New York
- 7,5581 room
- 6,3162 rooms
- 17,1573 rooms
- 18,4394 rooms
- 13,7515 rooms
- 10,8076 rooms
- 4,7527 rooms
- 2,4128 rooms
- 3,3779+ rooms
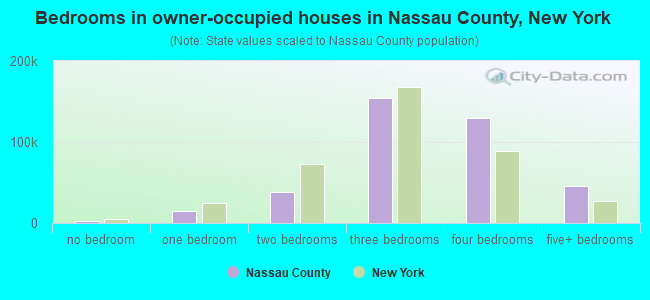
- Bedrooms in owner-occupied houses in Nassau County, New York
- 2,465no bedroom
- 14,0961 bedroom
- 39,2572 bedrooms
- 147,6633 bedrooms
- 121,3944 bedrooms
- 46,7055+ bedrooms
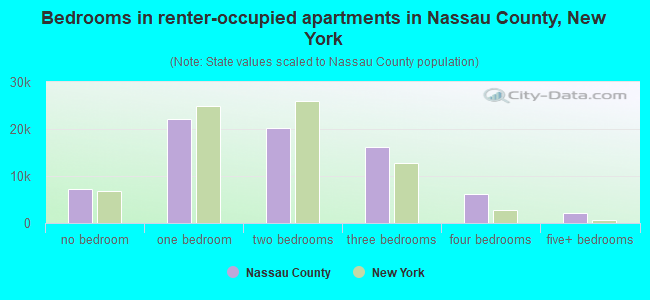
- Bedrooms in renter-occupied apartments in Nassau County, New York
- 8,286no bedroom
- 23,7691 bedroom
- 25,4512 bedrooms
- 18,2473 bedrooms
- 6,4884 bedrooms
- 2,3285+ bedrooms
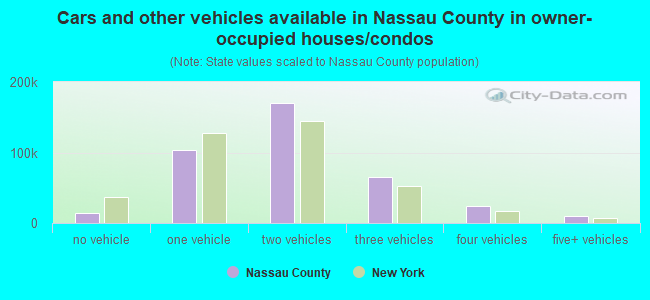
- Cars and other vehicles available in Nassau County in owner-occupied houses/condos
- 14,103no vehicle
- 94,6581 vehicle
- 168,5932 vehicles
- 62,5153 vehicles
- 23,1594 vehicles
- 8,5525+ vehicles
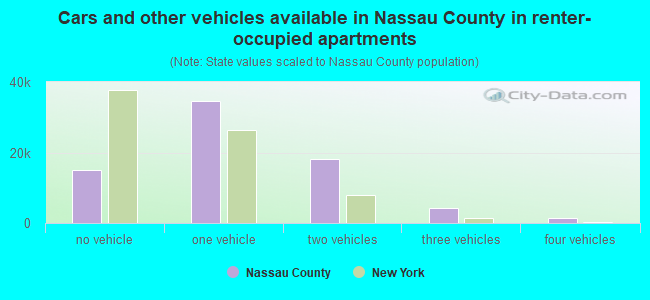
- Cars and other vehicles available in Nassau County in renter-occupied apartments
- 16,806no vehicle
- 40,1561 vehicle
- 19,8032 vehicles
- 6,4043 vehicles
- 1,2124 vehicles
- 1885+ vehicles
92.0% of Nassau County residents lived in the same house 1 years ago.
Out of people who lived in different houses, 32% lived in this county.
Out of people who lived in different counties, 86% lived in New York.
| Nassau County: | 92.0% |
| State average: | 89.6% |
Place of birth for U.S.-born residents:
- This state: 953,653
- Other state: 79,305
- Northeast: 28,454
- Midwest: 12,151
- South: 26,816
- West: 11,884
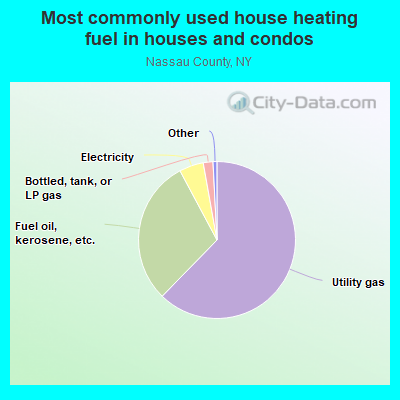
- 62.2%Utility gas
- 29.2%Fuel oil, kerosene, etc.
- 5.3%Electricity
- 2.4%Bottled, tank, or LP gas
- 0.4%Other fuel
- 0.2%No fuel used
- 0.2%Wood
- 0.2%Solar energy
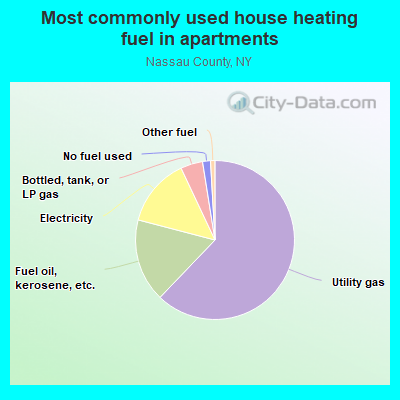
- 56.0%Utility gas
- 18.3%Electricity
- 16.5%Fuel oil, kerosene, etc.
- 5.2%Bottled, tank, or LP gas
- 2.3%No fuel used
- 1.6%Other fuel
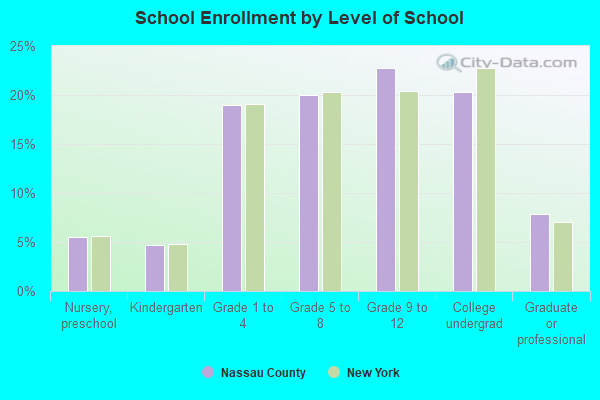
Private vs. public school enrollment:
| Here: | 13.7% |
| New York: | 15.6% |
| Here: | 14.9% |
| New York: | 15.0% |
| Here: | 42.6% |
| New York: | 39.2% |
Nassau County government finances - Expenditure in 2020:
- Assistance and Subsidies - Public Welfare, Federal Categorical Assistance Programs: $23,974,000
Public Welfare, Federal Categorical Assistance Programs: $22,927,000
- Bond Funds - Cash and Securities: $437,139,000
Cash and Securities: $402,220,000
- Charges - Hospital Public: $316,079,000
Hospital Public: $310,525,000
Other: $170,954,000
Other: $166,443,000
Higher Education - Other: $56,760,000
Higher Education - Other: $54,592,000
Parks and Recreation: $23,518,000
Parks and Recreation: $21,836,000
Toll Highways: $6,447,000
Toll Highways: $6,335,000
Sewerage: $1,422,000
Sewerage: $656,000
- Construction - Sewerage: $169,971,000
Sewerage: $80,693,000
Regular Highways: $59,189,000
Regular Highways: $56,635,000
General - Other: $42,880,000
Police Protection: $41,995,000
General - Other: $31,904,000
Police Protection: $30,898,000
Other Higher Education: $13,240,000
Parks and Recreation: $10,557,000
Toll Highways: $9,366,000
Health - Other: $8,795,000
Other Higher Education: $7,876,000
Health - Other: $3,691,000
Parks and Recreation: $3,559,000
Solid Waste Management: $2,089,000
Water Utilities: $2,054,000
Solid Waste Management: $1,857,000
Corrections - Other: $742,000
Water Utilities: $464,000
Corrections - Other: $48,000
- Current Operations - Police Protection: $900,097,000
Police Protection: $868,244,000
Hospitals: $577,896,000
Hospitals: $499,705,000
General - Other: $371,769,000
General - Other: $350,908,000
Health - Other: $281,247,000
Health - Other: $266,966,000
Other Higher Education: $235,527,000
Public Welfare - Other: $218,216,000
Public Welfare - Other: $216,386,000
Correctional Institutions: $212,605,000
Other Higher Education: $208,647,000
Correctional Institutions: $202,495,000
Regular Highways: $168,769,000
Regular Highways: $153,961,000
Public Welfare Institutions: $124,926,000
Public Welfare Institutions: $119,000,000
Sewerage: $98,433,000
Judicial and Legal Services: $96,005,000
Sewerage: $95,686,000
Judicial and Legal Services: $90,090,000
Financial Administration: $51,637,000
General Public Buildings: $49,740,000
Financial Administration: $48,632,000
Transit Utilities: $44,048,000
Parks and Recreation: $43,744,000
Transit Utilities: $43,116,000
General Public Buildings: $41,657,000
Parks and Recreation: $38,501,000
Central Staff Services: $36,993,000
Central Staff Services: $34,648,000
Corrections - Other: $33,627,000
Corrections - Other: $33,122,000
Local Fire Protection: $24,105,000
Local Fire Protection: $23,870,000
Public Welfare, Vendor Payments for Other Purposes: $18,354,000
Public Welfare, Vendor Payments for Other Purposes: $16,304,000
Natural Resources - Other: $9,986,000
Water Utilities: $9,880,000
Natural Resources - Other: $9,472,000
Water Utilities: $9,363,000
Toll Highways: $4,435,000
Toll Highways: $2,052,000
- Federal Intergovernmental - Education: $6,264,000
Other: $72,000
Other: $11,000
- General - Interest on Debt: $412,654,000
Interest on Debt: $362,773,000
- Intergovernmental to Local - Other - General - Other: $131,612,000
Other - General - Other: $122,125,000
- Intergovernmental to State - Public Welfare - Categorical Assistance Programs: $243,103,000
Public Welfare - Categorical Assistance Programs: $233,192,000
Corrections: $4,617,000
Corrections: $3,451,000
- Local Intergovernmental - Education: $70,211,000
Education: $67,383,000
Other: $118,000
- Long Term Debt - Beginning Outstanding - Unspecified Public Purpose: $3,635,042,000
Beginning Outstanding - Unspecified Public Purpose: $3,540,710,000
Outstanding Unspecified Public Purpose: $3,509,410,000
Outstanding Unspecified Public Purpose: $3,499,564,000
Retired Unspecified Public Purpose: $606,263,000
Issue, Unspecified Public Purpose: $473,395,000
Beginning Outstanding - Public Debt for Private Purpose: $431,516,000
Outstanding Nonguaranteed - Industrial Revenue: $388,826,000
Retired Unspecified Public Purpose: $251,370,000
Issue, Unspecified Public Purpose: $202,040,000
Retired Nonguaranteed - Public Debt for Private Purpose: $42,690,000
- Miscellaneous - General Revenue - Other: $138,810,000
Fines and Forfeits: $102,691,000
Fines and Forfeits: $91,525,000
General Revenue - Other: $85,224,000
Interest Earnings: $22,110,000
Rents: $13,384,000
Rents: $12,710,000
Interest Earnings: $6,401,000
Sale of Property: $1,200,000
Donations From Private Sources: $828,000
Donations From Private Sources: $821,000
Sale of Property: $51,000
- Other Capital Outlay - Police Protection: $6,397,000
General - Other: $5,246,000
Police Protection: $3,005,000
General - Other: $1,451,000
Central Staff Services: $1,439,000
Central Staff Services: $1,312,000
Other Higher Education: $680,000
Parks and Recreation: $620,000
Other Higher Education: $469,000
Parks and Recreation: $419,000
Correctional Institutions: $226,000
Public Welfare - Other: $161,000
Health - Other: $98,000
Judicial and Legal Services: $73,000
Local Fire Protection: $63,000
Judicial and Legal Services: $62,000
General Public Building: $57,000
Regular Highways: $32,000
Corrections - Other: $32,000
Corrections - Other: $31,000
Health - Other: $24,000
Regular Highways: $14,000
Correctional Institutions: $11,000
Sewerage: $10,000
Public Welfare - Other: $10,000
Local Fire Protection: $9,000
General Public Building: $4,000
Water Utilities: $3,000
Financial Administration: $3,000
Financial Administration: $1,000
- Other Funds - Cash and Securities: $724,566,000
Cash and Securities: $699,147,000
- Revenue - Transit Utilities: $47,519,000
Transit Utilities: $43,219,000
- Short Term Debt Outstanding - End of Fiscal Year: $522,833,000
Beginning: $514,107,000
Beginning: $361,885,000
End of Fiscal Year: $296,475,000
- Sinking Funds - Cash and Securities: $436,663,000
Cash and Securities: $63,870,000
- State Intergovernmental - Other: $340,786,000
Other: $262,518,000
Health and Hospitals: $120,499,000
Public Welfare: $110,253,000
Public Welfare: $110,210,000
Health and Hospitals: $106,169,000
Transit Utilities: $74,472,000
Transit Utilities: $68,089,000
Education: $63,585,000
Education: $61,350,000
- Tax - General Sales and Gross Receipts: $1,299,260,000
General Sales and Gross Receipts: $1,205,214,000
Property: $1,006,248,000
Property: $963,083,000
Documentary and Stock Transfer: $47,162,000
Other License: $27,152,000
Other Selective Sales: $21,369,000
Other Selective Sales: $21,316,000
Other License: $16,775,000
Other: $5,316,000
- Total Salaries and Wages: $945,603,000
: $899,174,000
Nassau County government finances - Revenue in 2020:
- Assistance and Subsidies - Public Welfare, Federal Categorical Assistance Programs: $23,974,000
Public Welfare, Federal Categorical Assistance Programs: $22,927,000
- Bond Funds - Cash and Securities: $437,139,000
Cash and Securities: $402,220,000
- Charges - Hospital Public: $316,079,000
Hospital Public: $310,525,000
Other: $170,954,000
Other: $166,443,000
Higher Education - Other: $56,760,000
Higher Education - Other: $54,592,000
Parks and Recreation: $23,518,000
Parks and Recreation: $21,836,000
Toll Highways: $6,447,000
Toll Highways: $6,335,000
Sewerage: $1,422,000
Sewerage: $656,000
- Construction - Sewerage: $169,971,000
Sewerage: $80,693,000
Regular Highways: $59,189,000
Regular Highways: $56,635,000
General - Other: $42,880,000
Police Protection: $41,995,000
General - Other: $31,904,000
Police Protection: $30,898,000
Other Higher Education: $13,240,000
Parks and Recreation: $10,557,000
Toll Highways: $9,366,000
Health - Other: $8,795,000
Other Higher Education: $7,876,000
Health - Other: $3,691,000
Parks and Recreation: $3,559,000
Solid Waste Management: $2,089,000
Water Utilities: $2,054,000
Solid Waste Management: $1,857,000
Corrections - Other: $742,000
Water Utilities: $464,000
Corrections - Other: $48,000
- Current Operations - Police Protection: $900,097,000
Police Protection: $868,244,000
Hospitals: $577,896,000
Hospitals: $499,705,000
General - Other: $371,769,000
General - Other: $350,908,000
Health - Other: $281,247,000
Health - Other: $266,966,000
Other Higher Education: $235,527,000
Public Welfare - Other: $218,216,000
Public Welfare - Other: $216,386,000
Correctional Institutions: $212,605,000
Other Higher Education: $208,647,000
Correctional Institutions: $202,495,000
Regular Highways: $168,769,000
Regular Highways: $153,961,000
Public Welfare Institutions: $124,926,000
Public Welfare Institutions: $119,000,000
Sewerage: $98,433,000
Judicial and Legal Services: $96,005,000
Sewerage: $95,686,000
Judicial and Legal Services: $90,090,000
Financial Administration: $51,637,000
General Public Buildings: $49,740,000
Financial Administration: $48,632,000
Transit Utilities: $44,048,000
Parks and Recreation: $43,744,000
Transit Utilities: $43,116,000
General Public Buildings: $41,657,000
Parks and Recreation: $38,501,000
Central Staff Services: $36,993,000
Central Staff Services: $34,648,000
Corrections - Other: $33,627,000
Corrections - Other: $33,122,000
Local Fire Protection: $24,105,000
Local Fire Protection: $23,870,000
Public Welfare, Vendor Payments for Other Purposes: $18,354,000
Public Welfare, Vendor Payments for Other Purposes: $16,304,000
Natural Resources - Other: $9,986,000
Water Utilities: $9,880,000
Natural Resources - Other: $9,472,000
Water Utilities: $9,363,000
Toll Highways: $4,435,000
Toll Highways: $2,052,000
- Federal Intergovernmental - Education: $6,264,000
Other: $72,000
Other: $11,000
- General - Interest on Debt: $412,654,000
Interest on Debt: $362,773,000
- Intergovernmental to Local - Other - General - Other: $131,612,000
Other - General - Other: $122,125,000
- Intergovernmental to State - Public Welfare - Categorical Assistance Programs: $243,103,000
Public Welfare - Categorical Assistance Programs: $233,192,000
Corrections: $4,617,000
Corrections: $3,451,000
- Local Intergovernmental - Education: $70,211,000
Education: $67,383,000
Other: $118,000
- Long Term Debt - Beginning Outstanding - Unspecified Public Purpose: $3,635,042,000
Beginning Outstanding - Unspecified Public Purpose: $3,540,710,000
Outstanding Unspecified Public Purpose: $3,509,410,000
Outstanding Unspecified Public Purpose: $3,499,564,000
Retired Unspecified Public Purpose: $606,263,000
Issue, Unspecified Public Purpose: $473,395,000
Beginning Outstanding - Public Debt for Private Purpose: $431,516,000
Outstanding Nonguaranteed - Industrial Revenue: $388,826,000
Retired Unspecified Public Purpose: $251,370,000
Issue, Unspecified Public Purpose: $202,040,000
Retired Nonguaranteed - Public Debt for Private Purpose: $42,690,000
- Miscellaneous - General Revenue - Other: $138,810,000
Fines and Forfeits: $102,691,000
Fines and Forfeits: $91,525,000
General Revenue - Other: $85,224,000
Interest Earnings: $22,110,000
Rents: $13,384,000
Rents: $12,710,000
Interest Earnings: $6,401,000
Sale of Property: $1,200,000
Donations From Private Sources: $828,000
Donations From Private Sources: $821,000
Sale of Property: $51,000
- Other Capital Outlay - Police Protection: $6,397,000
General - Other: $5,246,000
Police Protection: $3,005,000
General - Other: $1,451,000
Central Staff Services: $1,439,000
Central Staff Services: $1,312,000
Other Higher Education: $680,000
Parks and Recreation: $620,000
Other Higher Education: $469,000
Parks and Recreation: $419,000
Correctional Institutions: $226,000
Public Welfare - Other: $161,000
Health - Other: $98,000
Judicial and Legal Services: $73,000
Local Fire Protection: $63,000
Judicial and Legal Services: $62,000
General Public Building: $57,000
Regular Highways: $32,000
Corrections - Other: $32,000
Corrections - Other: $31,000
Health - Other: $24,000
Regular Highways: $14,000
Correctional Institutions: $11,000
Sewerage: $10,000
Public Welfare - Other: $10,000
Local Fire Protection: $9,000
General Public Building: $4,000
Water Utilities: $3,000
Financial Administration: $3,000
Financial Administration: $1,000
- Other Funds - Cash and Securities: $724,566,000
Cash and Securities: $699,147,000
- Revenue - Transit Utilities: $47,519,000
Transit Utilities: $43,219,000
- Short Term Debt Outstanding - End of Fiscal Year: $522,833,000
Beginning: $514,107,000
Beginning: $361,885,000
End of Fiscal Year: $296,475,000
- Sinking Funds - Cash and Securities: $436,663,000
Cash and Securities: $63,870,000
- State Intergovernmental - Other: $340,786,000
Other: $262,518,000
Health and Hospitals: $120,499,000
Public Welfare: $110,253,000
Public Welfare: $110,210,000
Health and Hospitals: $106,169,000
Transit Utilities: $74,472,000
Transit Utilities: $68,089,000
Education: $63,585,000
Education: $61,350,000
- Tax - General Sales and Gross Receipts: $1,299,260,000
General Sales and Gross Receipts: $1,205,214,000
Property: $1,006,248,000
Property: $963,083,000
Documentary and Stock Transfer: $47,162,000
Other License: $27,152,000
Other Selective Sales: $21,369,000
Other Selective Sales: $21,316,000
Other License: $16,775,000
Other: $5,316,000
- Total Salaries and Wages: $945,603,000
: $899,174,000
Nassau County government finances - Debt in 2020:
- Assistance and Subsidies - Public Welfare, Federal Categorical Assistance Programs: $23,974,000
Public Welfare, Federal Categorical Assistance Programs: $22,927,000
- Bond Funds - Cash and Securities: $437,139,000
Cash and Securities: $402,220,000
- Charges - Hospital Public: $316,079,000
Hospital Public: $310,525,000
Other: $170,954,000
Other: $166,443,000
Higher Education - Other: $56,760,000
Higher Education - Other: $54,592,000
Parks and Recreation: $23,518,000
Parks and Recreation: $21,836,000
Toll Highways: $6,447,000
Toll Highways: $6,335,000
Sewerage: $1,422,000
Sewerage: $656,000
- Construction - Sewerage: $169,971,000
Sewerage: $80,693,000
Regular Highways: $59,189,000
Regular Highways: $56,635,000
General - Other: $42,880,000
Police Protection: $41,995,000
General - Other: $31,904,000
Police Protection: $30,898,000
Other Higher Education: $13,240,000
Parks and Recreation: $10,557,000
Toll Highways: $9,366,000
Health - Other: $8,795,000
Other Higher Education: $7,876,000
Health - Other: $3,691,000
Parks and Recreation: $3,559,000
Solid Waste Management: $2,089,000
Water Utilities: $2,054,000
Solid Waste Management: $1,857,000
Corrections - Other: $742,000
Water Utilities: $464,000
Corrections - Other: $48,000
- Current Operations - Police Protection: $900,097,000
Police Protection: $868,244,000
Hospitals: $577,896,000
Hospitals: $499,705,000
General - Other: $371,769,000
General - Other: $350,908,000
Health - Other: $281,247,000
Health - Other: $266,966,000
Other Higher Education: $235,527,000
Public Welfare - Other: $218,216,000
Public Welfare - Other: $216,386,000
Correctional Institutions: $212,605,000
Other Higher Education: $208,647,000
Correctional Institutions: $202,495,000
Regular Highways: $168,769,000
Regular Highways: $153,961,000
Public Welfare Institutions: $124,926,000
Public Welfare Institutions: $119,000,000
Sewerage: $98,433,000
Judicial and Legal Services: $96,005,000
Sewerage: $95,686,000
Judicial and Legal Services: $90,090,000
Financial Administration: $51,637,000
General Public Buildings: $49,740,000
Financial Administration: $48,632,000
Transit Utilities: $44,048,000
Parks and Recreation: $43,744,000
Transit Utilities: $43,116,000
General Public Buildings: $41,657,000
Parks and Recreation: $38,501,000
Central Staff Services: $36,993,000
Central Staff Services: $34,648,000
Corrections - Other: $33,627,000
Corrections - Other: $33,122,000
Local Fire Protection: $24,105,000
Local Fire Protection: $23,870,000
Public Welfare, Vendor Payments for Other Purposes: $18,354,000
Public Welfare, Vendor Payments for Other Purposes: $16,304,000
Natural Resources - Other: $9,986,000
Water Utilities: $9,880,000
Natural Resources - Other: $9,472,000
Water Utilities: $9,363,000
Toll Highways: $4,435,000
Toll Highways: $2,052,000
- Federal Intergovernmental - Education: $6,264,000
Other: $72,000
Other: $11,000
- General - Interest on Debt: $412,654,000
Interest on Debt: $362,773,000
- Intergovernmental to Local - Other - General - Other: $131,612,000
Other - General - Other: $122,125,000
- Intergovernmental to State - Public Welfare - Categorical Assistance Programs: $243,103,000
Public Welfare - Categorical Assistance Programs: $233,192,000
Corrections: $4,617,000
Corrections: $3,451,000
- Local Intergovernmental - Education: $70,211,000
Education: $67,383,000
Other: $118,000
- Long Term Debt - Beginning Outstanding - Unspecified Public Purpose: $3,635,042,000
Beginning Outstanding - Unspecified Public Purpose: $3,540,710,000
Outstanding Unspecified Public Purpose: $3,509,410,000
Outstanding Unspecified Public Purpose: $3,499,564,000
Retired Unspecified Public Purpose: $606,263,000
Issue, Unspecified Public Purpose: $473,395,000
Beginning Outstanding - Public Debt for Private Purpose: $431,516,000
Outstanding Nonguaranteed - Industrial Revenue: $388,826,000
Retired Unspecified Public Purpose: $251,370,000
Issue, Unspecified Public Purpose: $202,040,000
Retired Nonguaranteed - Public Debt for Private Purpose: $42,690,000
- Miscellaneous - General Revenue - Other: $138,810,000
Fines and Forfeits: $102,691,000
Fines and Forfeits: $91,525,000
General Revenue - Other: $85,224,000
Interest Earnings: $22,110,000
Rents: $13,384,000
Rents: $12,710,000
Interest Earnings: $6,401,000
Sale of Property: $1,200,000
Donations From Private Sources: $828,000
Donations From Private Sources: $821,000
Sale of Property: $51,000
- Other Capital Outlay - Police Protection: $6,397,000
General - Other: $5,246,000
Police Protection: $3,005,000
General - Other: $1,451,000
Central Staff Services: $1,439,000
Central Staff Services: $1,312,000
Other Higher Education: $680,000
Parks and Recreation: $620,000
Other Higher Education: $469,000
Parks and Recreation: $419,000
Correctional Institutions: $226,000
Public Welfare - Other: $161,000
Health - Other: $98,000
Judicial and Legal Services: $73,000
Local Fire Protection: $63,000
Judicial and Legal Services: $62,000
General Public Building: $57,000
Regular Highways: $32,000
Corrections - Other: $32,000
Corrections - Other: $31,000
Health - Other: $24,000
Regular Highways: $14,000
Correctional Institutions: $11,000
Sewerage: $10,000
Public Welfare - Other: $10,000
Local Fire Protection: $9,000
General Public Building: $4,000
Water Utilities: $3,000
Financial Administration: $3,000
Financial Administration: $1,000
- Other Funds - Cash and Securities: $724,566,000
Cash and Securities: $699,147,000
- Revenue - Transit Utilities: $47,519,000
Transit Utilities: $43,219,000
- Short Term Debt Outstanding - End of Fiscal Year: $522,833,000
Beginning: $514,107,000
Beginning: $361,885,000
End of Fiscal Year: $296,475,000
- Sinking Funds - Cash and Securities: $436,663,000
Cash and Securities: $63,870,000
- State Intergovernmental - Other: $340,786,000
Other: $262,518,000
Health and Hospitals: $120,499,000
Public Welfare: $110,253,000
Public Welfare: $110,210,000
Health and Hospitals: $106,169,000
Transit Utilities: $74,472,000
Transit Utilities: $68,089,000
Education: $63,585,000
Education: $61,350,000
- Tax - General Sales and Gross Receipts: $1,299,260,000
General Sales and Gross Receipts: $1,205,214,000
Property: $1,006,248,000
Property: $963,083,000
Documentary and Stock Transfer: $47,162,000
Other License: $27,152,000
Other Selective Sales: $21,369,000
Other Selective Sales: $21,316,000
Other License: $16,775,000
Other: $5,316,000
- Total Salaries and Wages: $945,603,000
: $899,174,000
Nassau County government finances - Cash and Securities in 2020:
- Assistance and Subsidies - Public Welfare, Federal Categorical Assistance Programs: $23,974,000
Public Welfare, Federal Categorical Assistance Programs: $22,927,000
- Bond Funds - Cash and Securities: $437,139,000
Cash and Securities: $402,220,000
- Charges - Hospital Public: $316,079,000
Hospital Public: $310,525,000
Other: $170,954,000
Other: $166,443,000
Higher Education - Other: $56,760,000
Higher Education - Other: $54,592,000
Parks and Recreation: $23,518,000
Parks and Recreation: $21,836,000
Toll Highways: $6,447,000
Toll Highways: $6,335,000
Sewerage: $1,422,000
Sewerage: $656,000
- Construction - Sewerage: $169,971,000
Sewerage: $80,693,000
Regular Highways: $59,189,000
Regular Highways: $56,635,000
General - Other: $42,880,000
Police Protection: $41,995,000
General - Other: $31,904,000
Police Protection: $30,898,000
Other Higher Education: $13,240,000
Parks and Recreation: $10,557,000
Toll Highways: $9,366,000
Health - Other: $8,795,000
Other Higher Education: $7,876,000
Health - Other: $3,691,000
Parks and Recreation: $3,559,000
Solid Waste Management: $2,089,000
Water Utilities: $2,054,000
Solid Waste Management: $1,857,000
Corrections - Other: $742,000
Water Utilities: $464,000
Corrections - Other: $48,000
- Current Operations - Police Protection: $900,097,000
Police Protection: $868,244,000
Hospitals: $577,896,000
Hospitals: $499,705,000
General - Other: $371,769,000
General - Other: $350,908,000
Health - Other: $281,247,000
Health - Other: $266,966,000
Other Higher Education: $235,527,000
Public Welfare - Other: $218,216,000
Public Welfare - Other: $216,386,000
Correctional Institutions: $212,605,000
Other Higher Education: $208,647,000
Correctional Institutions: $202,495,000
Regular Highways: $168,769,000
Regular Highways: $153,961,000
Public Welfare Institutions: $124,926,000
Public Welfare Institutions: $119,000,000
Sewerage: $98,433,000
Judicial and Legal Services: $96,005,000
Sewerage: $95,686,000
Judicial and Legal Services: $90,090,000
Financial Administration: $51,637,000
General Public Buildings: $49,740,000
Financial Administration: $48,632,000
Transit Utilities: $44,048,000
Parks and Recreation: $43,744,000
Transit Utilities: $43,116,000
General Public Buildings: $41,657,000
Parks and Recreation: $38,501,000
Central Staff Services: $36,993,000
Central Staff Services: $34,648,000
Corrections - Other: $33,627,000
Corrections - Other: $33,122,000
Local Fire Protection: $24,105,000
Local Fire Protection: $23,870,000
Public Welfare, Vendor Payments for Other Purposes: $18,354,000
Public Welfare, Vendor Payments for Other Purposes: $16,304,000
Natural Resources - Other: $9,986,000
Water Utilities: $9,880,000
Natural Resources - Other: $9,472,000
Water Utilities: $9,363,000
Toll Highways: $4,435,000
Toll Highways: $2,052,000
- Federal Intergovernmental - Education: $6,264,000
Other: $72,000
Other: $11,000
- General - Interest on Debt: $412,654,000
Interest on Debt: $362,773,000
- Intergovernmental to Local - Other - General - Other: $131,612,000
Other - General - Other: $122,125,000
- Intergovernmental to State - Public Welfare - Categorical Assistance Programs: $243,103,000
Public Welfare - Categorical Assistance Programs: $233,192,000
Corrections: $4,617,000
Corrections: $3,451,000
- Local Intergovernmental - Education: $70,211,000
Education: $67,383,000
Other: $118,000
- Long Term Debt - Beginning Outstanding - Unspecified Public Purpose: $3,635,042,000
Beginning Outstanding - Unspecified Public Purpose: $3,540,710,000
Outstanding Unspecified Public Purpose: $3,509,410,000
Outstanding Unspecified Public Purpose: $3,499,564,000
Retired Unspecified Public Purpose: $606,263,000
Issue, Unspecified Public Purpose: $473,395,000
Beginning Outstanding - Public Debt for Private Purpose: $431,516,000
Outstanding Nonguaranteed - Industrial Revenue: $388,826,000
Retired Unspecified Public Purpose: $251,370,000
Issue, Unspecified Public Purpose: $202,040,000
Retired Nonguaranteed - Public Debt for Private Purpose: $42,690,000
- Miscellaneous - General Revenue - Other: $138,810,000
Fines and Forfeits: $102,691,000
Fines and Forfeits: $91,525,000
General Revenue - Other: $85,224,000
Interest Earnings: $22,110,000
Rents: $13,384,000
Rents: $12,710,000
Interest Earnings: $6,401,000
Sale of Property: $1,200,000
Donations From Private Sources: $828,000
Donations From Private Sources: $821,000
Sale of Property: $51,000
- Other Capital Outlay - Police Protection: $6,397,000
General - Other: $5,246,000
Police Protection: $3,005,000
General - Other: $1,451,000
Central Staff Services: $1,439,000
Central Staff Services: $1,312,000
Other Higher Education: $680,000
Parks and Recreation: $620,000
Other Higher Education: $469,000
Parks and Recreation: $419,000
Correctional Institutions: $226,000
Public Welfare - Other: $161,000
Health - Other: $98,000
Judicial and Legal Services: $73,000
Local Fire Protection: $63,000
Judicial and Legal Services: $62,000
General Public Building: $57,000
Regular Highways: $32,000
Corrections - Other: $32,000
Corrections - Other: $31,000
Health - Other: $24,000
Regular Highways: $14,000
Correctional Institutions: $11,000
Sewerage: $10,000
Public Welfare - Other: $10,000
Local Fire Protection: $9,000
General Public Building: $4,000
Water Utilities: $3,000
Financial Administration: $3,000
Financial Administration: $1,000
- Other Funds - Cash and Securities: $724,566,000
Cash and Securities: $699,147,000
- Revenue - Transit Utilities: $47,519,000
Transit Utilities: $43,219,000
- Short Term Debt Outstanding - End of Fiscal Year: $522,833,000
Beginning: $514,107,000
Beginning: $361,885,000
End of Fiscal Year: $296,475,000
- Sinking Funds - Cash and Securities: $436,663,000
Cash and Securities: $63,870,000
- State Intergovernmental - Other: $340,786,000
Other: $262,518,000
Health and Hospitals: $120,499,000
Public Welfare: $110,253,000
Public Welfare: $110,210,000
Health and Hospitals: $106,169,000
Transit Utilities: $74,472,000
Transit Utilities: $68,089,000
Education: $63,585,000
Education: $61,350,000
- Tax - General Sales and Gross Receipts: $1,299,260,000
General Sales and Gross Receipts: $1,205,214,000
Property: $1,006,248,000
Property: $963,083,000
Documentary and Stock Transfer: $47,162,000
Other License: $27,152,000
Other Selective Sales: $21,369,000
Other Selective Sales: $21,316,000
Other License: $16,775,000
Other: $5,316,000
- Total Salaries and Wages: $945,603,000
: $899,174,000
Supplemental Security Income (SSI) in 2006:
- Total number of recipients: 16,890
- Number of aged recipients: 4,588
- Number of blind and disabled recipients: 12,302
- Number of recipients under 18: 1,297
- Number of recipients between 18 and 64: 8,988
- Number of recipients older than 64: 6,605
- Number of recipients also receiving OASDI: 6,194
- Amount of payments (thousands of dollars): 7,908
| Home Mortgage Disclosure Act Aggregated Statistics For Year 2009 (Based on 271 full tracts) | ||||||||||||||
| A) FHA, FSA/RHS & VA Home Purchase Loans | B) Conventional Home Purchase Loans | C) Refinancings | D) Home Improvement Loans | E) Loans on Dwellings For 5+ Families | F) Non-occupant Loans on < 5 Family Dwellings (A B C & D) | G) Loans On Manufactured Home Dwelling (A B C & D) | ||||||||
|---|---|---|---|---|---|---|---|---|---|---|---|---|---|---|
| Number | Average Value | Number | Average Value | Number | Average Value | Number | Average Value | Number | Average Value | Number | Average Value | Number | Average Value | |
| LOANS ORIGINATED | 2,194 | $353,986 | 6,238 | $364,324 | 14,378 | $304,089 | 993 | $183,587 | 50 | $1,233,700 | 499 | $303,166 | 5 | $338,800 |
| APPLICATIONS APPROVED, NOT ACCEPTED | 186 | $347,511 | 788 | $380,128 | 2,243 | $328,955 | 249 | $112,213 | 1 | $454,000 | 79 | $333,734 | 0 | $0 |
| APPLICATIONS DENIED | 564 | $342,842 | 1,512 | $367,255 | 8,011 | $353,065 | 921 | $100,282 | 11 | $2,014,636 | 405 | $278,919 | 8 | $116,125 |
| APPLICATIONS WITHDRAWN | 499 | $337,287 | 906 | $366,907 | 4,944 | $334,319 | 280 | $261,800 | 8 | $367,625 | 183 | $295,765 | 1 | $200,000 |
| FILES CLOSED FOR INCOMPLETENESS | 108 | $348,972 | 266 | $390,147 | 1,495 | $357,841 | 106 | $161,481 | 0 | $0 | 38 | $255,105 | 0 | $0 |
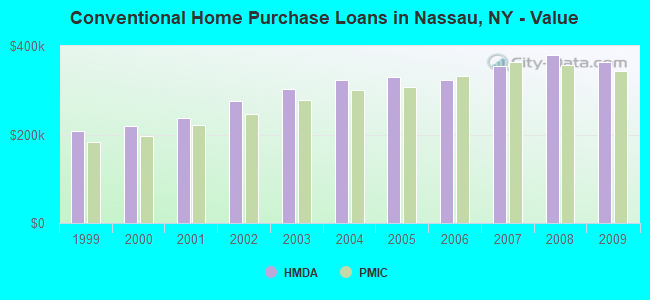
| Private Mortgage Insurance Companies Aggregated Statistics For Year 2009 (Based on 243 full tracts) | ||||||||
| A) Conventional Home Purchase Loans | B) Refinancings | C) Non-occupant Loans on < 5 Family Dwellings (A & B) | D) Loans On Manufactured Home Dwelling (A & B) | |||||
|---|---|---|---|---|---|---|---|---|
| Number | Average Value | Number | Average Value | Number | Average Value | Number | Average Value | |
| LOANS ORIGINATED | 814 | $343,114 | 256 | $374,152 | 0 | $0 | 0 | $0 |
| APPLICATIONS APPROVED, NOT ACCEPTED | 375 | $348,064 | 134 | $370,000 | 1 | $417,000 | 0 | $0 |
| APPLICATIONS DENIED | 198 | $346,919 | 134 | $384,164 | 1 | $311,000 | 1 | $165,000 |
| APPLICATIONS WITHDRAWN | 127 | $338,165 | 65 | $372,154 | 0 | $0 | 1 | $608,000 |
| FILES CLOSED FOR INCOMPLETENESS | 53 | $354,151 | 25 | $370,080 | 0 | $0 | 0 | $0 |
| Most common first names in Nassau County, NY among deceased individuals | ||
| Name | Count | Lived (average) |
|---|---|---|
| John | 12,560 | 74.2 years |
| Mary | 11,018 | 80.9 years |
| Joseph | 9,470 | 75.0 years |
| William | 8,526 | 74.4 years |
| Anna | 6,624 | 83.2 years |
| Helen | 5,473 | 79.9 years |
| Margaret | 5,348 | 80.2 years |
| Rose | 5,293 | 82.2 years |
| Frank | 5,281 | 75.8 years |
| George | 5,242 | 75.1 years |
| Most common last names in Nassau County, NY among deceased individuals | ||
| Last name | Count | Lived (average) |
|---|---|---|
| Smith | 2,170 | 76.2 years |
| Miller | 1,318 | 77.2 years |
| Brown | 1,159 | 74.6 years |
| Cohen | 1,147 | 77.9 years |
| Johnson | 1,132 | 75.8 years |
| Williams | 789 | 72.1 years |
| Murphy | 746 | 75.6 years |
| Kelly | 734 | 76.1 years |
| Schwartz | 695 | 77.9 years |
| Anderson | 647 | 76.6 years |
| Businesses in Nassau County, NY | ||||
| Name | Count | Name | Count | |
|---|---|---|---|---|
| 7-Eleven | 79 | Jones New York | 22 | |
| ALDO | 3 | Journeys | 4 | |
| AMF Bowling | 6 | Justice | 4 | |
| AT&T | 51 | KFC | 16 | |
| Abercrombie & Fitch | 2 | Kincaid | 2 | |
| Abercrombie Kids | 2 | Kohl's | 5 | |
| Ace Hardware | 13 | Kroger | 1 | |
| Advance Auto Parts | 9 | LA Fitness | 4 | |
| Aeropostale | 5 | La Quinta | 1 | |
| Aerosoles | 1 | La-Z-Boy | 6 | |
| American Eagle Outfitters | 6 | Lane Bryant | 5 | |
| Ann Taylor | 5 | Lane Furniture | 5 | |
| Apple Store | 2 | LensCrafters | 2 | |
| Applebee's | 8 | Lowe's | 4 | |
| Arby's | 2 | Macy's | 7 | |
| Ashley Furniture | 2 | Marriott | 5 | |
| Audi | 2 | Marshalls | 10 | |
| AutoZone | 7 | MasterBrand Cabinets | 67 | |
| Avenue | 8 | McDonald's | 38 | |
| BMW | 3 | Men's Wearhouse | 7 | |
| Baja Fresh Mexican Grill | 1 | Motherhood Maternity | 8 | |
| Bakers | 4 | New Balance | 25 | |
| Bally Total Fitness | 2 | New York & Co | 6 | |
| Banana Republic | 5 | Nike | 114 | |
| Barnes & Noble | 4 | Nissan | 8 | |
| Baskin-Robbins | 52 | Nordstrom | 2 | |
| Bath & Body Works | 8 | OfficeMax | 4 | |
| Bebe | 1 | Old Country Buffet | 1 | |
| Bed Bath & Beyond | 7 | Old Navy | 6 | |
| Ben & Jerry's | 1 | Olive Garden | 2 | |
| Bentleymotors.Com | 1 | On The Border | 1 | |
| Best Western | 3 | Outback | 3 | |
| Blockbuster | 14 | Outback Steakhouse | 3 | |
| Brooks Brothers | 3 | Pac Sun | 3 | |
| Brookstone | 1 | Panera Bread | 8 | |
| Budget Car Rental | 3 | Papa John's Pizza | 10 | |
| Burger King | 26 | Pathmark | 8 | |
| Buybuy BABY | 1 | Payless | 23 | |
| CVS | 58 | Penske | 4 | |
| Cache | 1 | PetSmart | 3 | |
| Casual Male XL | 4 | Pier 1 Imports | 5 | |
| Catherines | 1 | Pizza Hut | 3 | |
| Century 21 | 1 | Popeyes | 4 | |
| Charlotte Russe | 4 | Pottery Barn Kids | 1 | |
| Chevrolet | 3 | Quality | 1 | |
| Chico's | 4 | Quiznos | 4 | |
| Chipotle | 5 | RadioShack | 30 | |
| Chuck E. Cheese's | 2 | Ramada | 1 | |
| Cinnabon | 2 | Raymour & Flanigan | 5 | |
| Cold Stone Creamery | 4 | Red Lobster | 3 | |
| Coldwater Creek | 1 | Red Robin | 1 | |
| Costco | 2 | Red Roof Inn | 1 | |
| Crate & Barrel | 1 | Rite Aid | 32 | |
| Curves | 8 | Rodeway Inn | 1 | |
| DHL | 13 | Ruby Tuesday | 3 | |
| Decora Cabinetry | 19 | Ryder Rental & Truck Leasing | 2 | |
| Dennys | 1 | SAS Shoes | 4 | |
| Domino's Pizza | 13 | Sears | 9 | |
| DressBarn | 9 | Sephora | 2 | |
| Dressbarn | 9 | Skechers USA | 1 | |
| Dunkin Donuts | 101 | Soma Intimates | 2 | |
| Econo Lodge | 1 | Spencer Gifts | 3 | |
| Express | 6 | Sprint Nextel | 25 | |
| Extended Stay America | 1 | Staples | 14 | |
| Famous Footwear | 4 | Starbucks | 44 | |
| Fashion Bug | 1 | Stop & Shop | 17 | |
| FedEx | 262 | Subaru | 5 | |
| Finish Line | 3 | Subway | 9 | |
| Firestone Complete Auto Care | 3 | T-Mobile | 20 | |
| Foot Locker | 4 | T.G.I. Driday's | 6 | |
| Forever 21 | 4 | T.J.Maxx | 6 | |
| Fredericks Of Hollywood | 2 | Taco Bell | 20 | |
| GNC | 32 | Talbots | 1 | |
| GameStop | 29 | Target | 5 | |
| Gap | 11 | The Cheesecake Factory | 1 | |
| Goodwill | 7 | The Room Place | 16 | |
| Gymboree | 2 | Tim Hortons | 1 | |
| H&M | 5 | Torrid | 1 | |
| H&R Block | 20 | Toyota | 4 | |
| Haagen-Dazs | 3 | Toys"R"Us | 15 | |
| Harmon Face Values | 4 | Trader Joe's | 4 | |
| Haworth | 1 | True Value | 17 | |
| Hilton | 4 | U-Haul | 26 | |
| Holiday Inn | 3 | UPS | 266 | |
| Hollister Co. | 3 | Urban Outfitters | 3 | |
| Home Depot | 9 | Vans | 9 | |
| Honda | 5 | Verizon Wireless | 16 | |
| Hot Topic | 3 | Victoria's Secret | 7 | |
| Houlihan's | 2 | Volkswagen | 2 | |
| Hyatt | 1 | Waldbaums | 13 | |
| Hyundai | 3 | Walgreens | 20 | |
| IHOP | 8 | Walmart | 6 | |
| IZOD | 1 | Wendy's | 26 | |
| J.Crew | 2 | Wet Seal | 2 | |
| JCPenney | 3 | White Castle | 4 | |
| Jamba Juice | 1 | Whole Foods Market | 2 | |
| JoS. A. Bank | 3 | World Gym | 1 | |
| Johnny Rockets | 2 | YMCA | 2 | |
Nassau County on our top lists:
- #8 on the list of "Top 101 counties with the most Orthodox adherents"
- #8 on the list of "Top 101 counties with the most Orthodox adherents (pop. 50,000+)"
- #9 on the list of "Top 101 counties with the most Catholic adherents (pop. 50,000+)"
- #9 on the list of "Top 101 counties with the most Catholic adherents"
- #11 on the list of "Top 101 counties with the lowest percentage of residents that keep firearms around their homes"
- #13 on the list of "Top 101 counties with the highest ground withdrawal of fresh water for public supply"
- #13 on the list of "Top 101 counties with the highest ground withdrawal of fresh water for public supply (pop. 50,000+)"
- #13 on the list of "Top 101 counties with the most Orthodox congregations"
- #13 on the list of "Top 101 counties with the most Orthodox congregations (pop. 50,000+)"
- #18 on the list of "Top 101 counties with the most Other adherents"
- #18 on the list of "Top 101 counties with the most Other adherents (pop. 50,000+)"
- #27 on the list of "Top 101 counties with the most Other congregations (pop. 50,000+)"
- #27 on the list of "Top 101 counties with the most Other congregations"
- #28 on the list of "Top 101 counties with the most Mainline Protestant congregations"
- #28 on the list of "Top 101 counties with the most Mainline Protestant congregations (pop. 50,000+)"
- #30 on the list of "Top 101 counties with the most Catholic congregations (pop. 50,000+)"
- #30 on the list of "Top 101 counties with the most Catholic congregations"
- #31 on the list of "Top 101 counties with the highest percentage of residents that visited a dentist within the past year"
- #33 on the list of "Top 101 counties with the highest Sulfur Oxides Annual air pollution readings in 2012 (µg/m3)"
- #36 on the list of "Top 101 counties with the lowest average weight of females"