Percentage of residents living in poverty in 2022: 39.2%
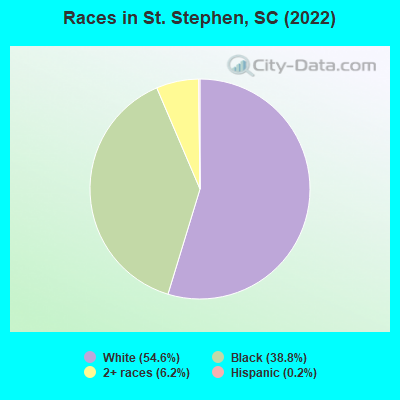
(23.3% for White Non-Hispanic residents, 54.2% for Black residents, 92.5% for two or more races residents)
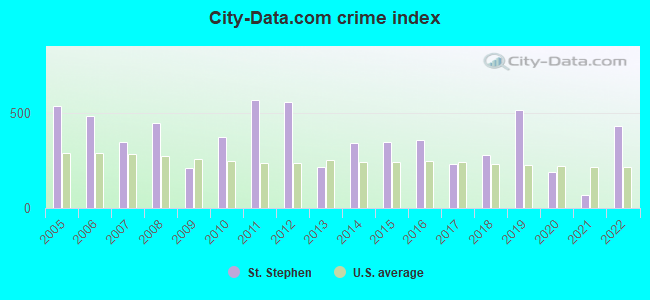
The City-Data.com crime index weighs serious crimes and violent crimes more heavily. Higher means more crime, U.S. average is 246.1. It adjusts for the number of visitors and daily workers commuting into cities.
Latest news from St. Stephen, SC collected exclusively by city-data.com from local newspapers, TV, and radio stations
Ancestries: American (17.9%), Irish (10.2%), English (5.0%), Scottish (1.6%), Polish (1.2%), German (1.1%).
Current Local Time: EST time zone
Elevation: 75 feet
Land area: 2.46 square miles.
Population density: 636 people per square mile (low).
16 residents are foreign born
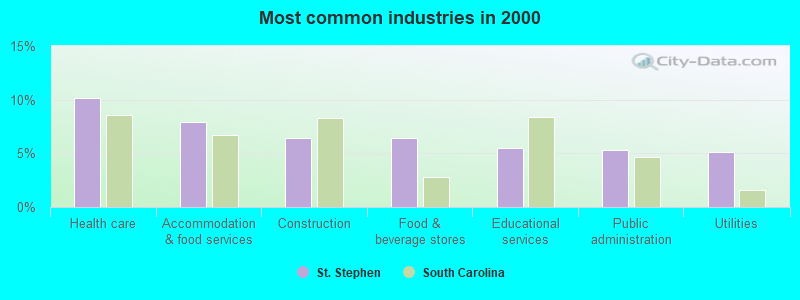
This town:
1.1%
South Carolina:
5.3%
Median real estate property taxes paid for housing units with mortgages in 2022: $1,204 (0.6%) Median real estate property taxes paid for housing units with no mortgage in 2022: $501 (0.6%)
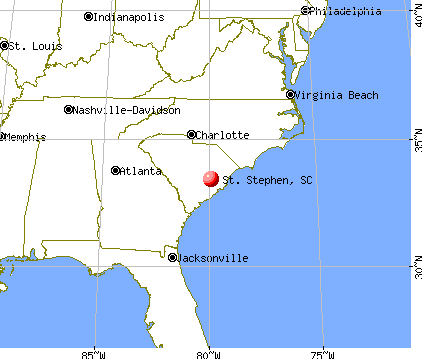
Nearest city with pop. 50,000+: North Charleston, SC (36.3 miles , pop. 79,641).
Nearest city with pop. 200,000+: Charlotte, NC (135.0 miles , pop. 540,828).
Nearest city with pop. 1,000,000+: Philadelphia, PA (527.2 miles , pop. 1,517,550).
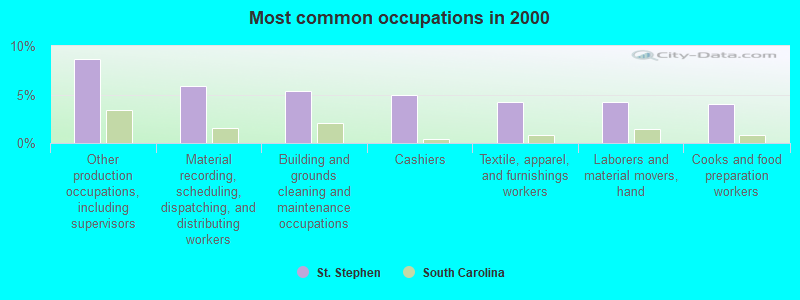
Other production occupations, including supervisors (8.7%)
Material recording, scheduling, dispatching, and distributing workers (5.9%)
Building and grounds cleaning and maintenance occupations (5.3%)
Cashiers (5.0%)
Textile, apparel, and furnishings workers (4.2%)
Laborers and material movers, hand (4.2%)
Cooks and food preparation workers (4.1%)
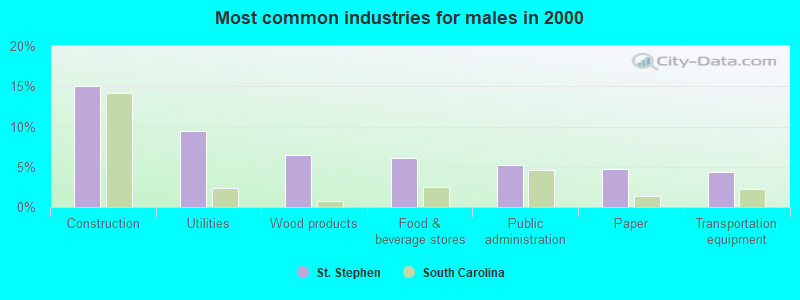
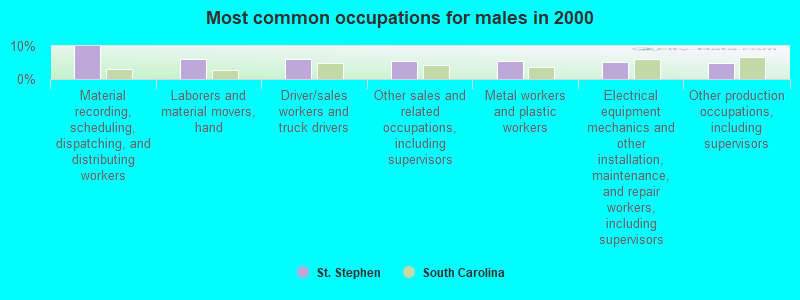
Material recording, scheduling, dispatching, and distributing workers (9.9%)
Laborers and material movers, hand (6.0%)
Driver/sales workers and truck drivers (6.0%)
Other sales and related occupations, including supervisors (5.6%)
Metal workers and plastic workers (5.6%)
Electrical equipment mechanics and other installation, maintenance, and repair workers, including supervisors (5.2%)
Other production occupations, including supervisors (4.7%)
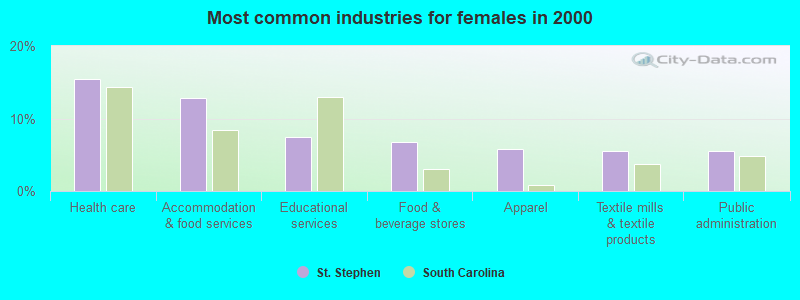
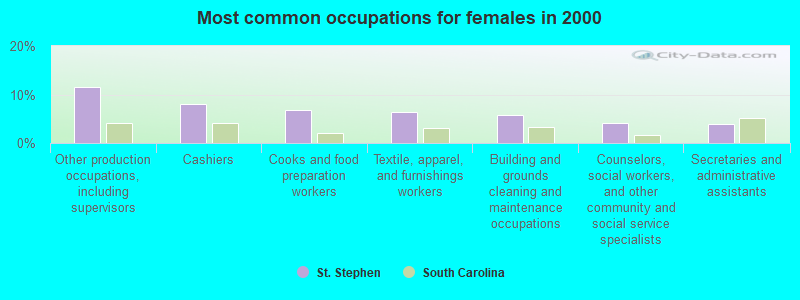
Other production occupations, including supervisors (11.6%)
Cashiers (8.0%)
Cooks and food preparation workers (6.8%)
Textile, apparel, and furnishings workers (6.4%)
Building and grounds cleaning and maintenance occupations (5.8%)
Counselors, social workers, and other community and social service specialists (4.2%)
Secretaries and administrative assistants (3.9%)
Average climate in St. Stephen, South Carolina
Based on data reported by over 4,000 weather stations
Tornado activity:
St. Stephen-area historical tornado activity is slightly below South Carolina state average. It is 15% smaller than the overall U.S. average.
On 9/3/1998, a category F2 (max. wind speeds 113-157 mph) tornado 10.8 miles away from the St. Stephen town center injured 9 peopleand caused $3 million in damages.
On 9/11/1960, a category F3 (max. wind speeds 158-206 mph) tornado 42.0 miles away from the town center injured 10 peopleand causedbetween $500,000 and $5,000,000 in damages.
Earthquake activity:
St. Stephen-area historical earthquake activity is significantly above South Carolina state average. It is 48% smaller than the overall U.S. average.
On 11/22/1974 at 05:25:55, a magnitude 4.7 (4.7 MB, Class: Light, Intensity: IV - V) earthquake occurred 37.2 miles away from St. Stephen center On 8/21/1992 at 16:31:55, a magnitude 4.4 (4.1 MB, 4.1 LG, 4.4 LG, Depth: 6.2 mi) earthquake occurred 27.0 miles away from St. Stephen center On 8/2/1974 at 08:52:09, a magnitude 4.9 (4.3 MB, 4.9 LG) earthquake occurred 151.2 miles away from the city center On 8/23/2011 at 17:51:04, a magnitude 5.8 (5.8 MW, Depth: 3.7 mi, Class: Moderate, Intensity: VI - VII) earthquake occurred 331.0 miles away from the city center On 8/9/2020 at 12:07:37, a magnitude 5.1 (5.1 MW, Depth: 4.7 mi) earthquake occurred 222.5 miles away from St. Stephen center On 4/17/1995 at 13:45:57, a magnitude 3.9 (3.9 LG, Depth: 6.2 mi, Class: Light, Intensity: II - III) earthquake occurred 32.8 miles away from St. Stephen center Magnitude types: regional Lg-wave magnitude (LG), body-wave magnitude (MB), moment magnitude (MW)
Natural disasters:
The number of natural disasters in Berkeley County (18) is near the US average (15). Major Disasters (Presidential) Declared: 8 Emergencies Declared: 5
Causes of natural disasters: Hurricanes: 9, Storms: 3, Winter Storms: 3, Floods: 2, Tropical Storms: 2, Tornado: 1, Wind: 1, Other: 1 (Note: some incidents may be assigned to more than one category).
Hospitals and medical centers near St. Stephen:
LAKE MOULTRIE NURSING HOME (Nursing Home, about 1 miles away; SAINT STEPHEN, SC)
FMC DIALYSIS SERVICES ANDREWS (Dialysis Facility, about 16 miles away; ANDREWS, SC)
Amtrak station near St. Stephen:
19 miles: KINGSTREE (101 E. MAIN ST.) . Services: enclosed waiting area, public restrooms, public payphones, call for taxi service, intercity bus service.
Colleges/universities with over 2000 students nearest to St. Stephen:
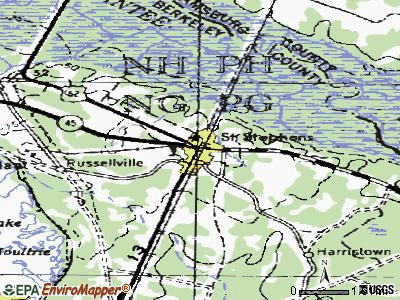
Notable locations in St. Stephen: Saint Stephen Golf Course (A), Berkeley County Library Saint Stephen Branch (B), Saint Stephen Rural Volunteer Fire Department (C), Saint Stephen Police Department (D). Display/hide their locations on the map
Churches in St. Stephen include: Saint Stephen Baptist Church (A), Saint Stephens Episcopal Church (B), Bryant Chapel (C), Saint Michaels Church (D). Display/hide their locations on the map
Berkeley County has a predicted average indoor radon screening level less than 2 pCi/L (pico curies per liter) - Low Potential
Average household size:
This town:
2.5 people
South Carolina:
2.5 people
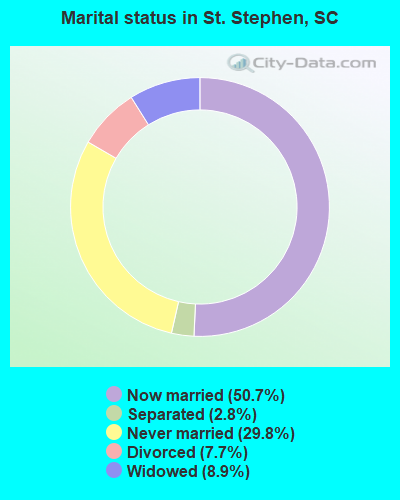
Percentage of family households:
This town:
64.7%
Whole state:
67.5%
Percentage of households with unmarried partners:
This town:
6.0%
Whole state:
6.0%
Likely homosexual households (counted as self-reported same-sex unmarried-partner households)
Lesbian couples: 0.5% of all households
Gay men: 0.5% of all households
84 people in nursing facilities/skilled-nursing facilities in 2010
83 people in nursing homes in 2000
Banks with branches in St. Stephen (2011 data):
Farmers and Merchants Bank of South Carolina: St. Stephen Branch at 117 Church Street, branch established on 1968/10/01. Info updated 2006/11/03: Bank assets: $303.7 mil, Deposits: $262.3 mil, headquarters in Holly Hill, SC, positive income, 8 total offices, Holding Company: Fmb Of S.C. Bancshares, Inc.
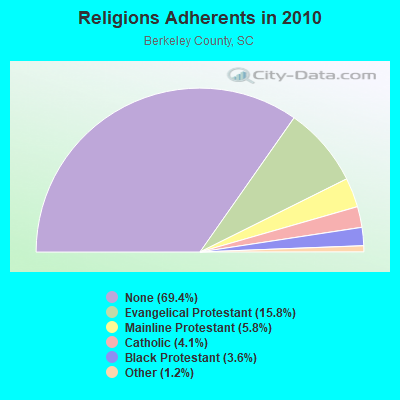
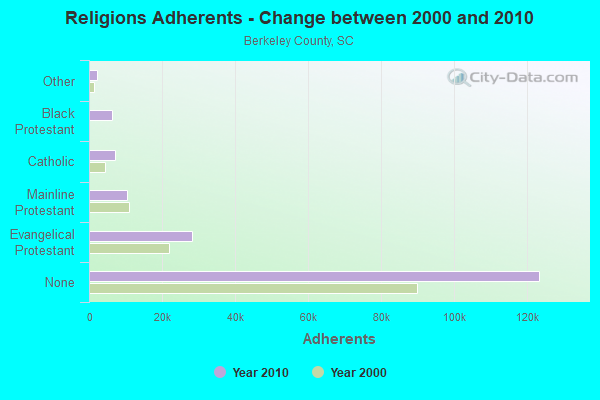
Religion statistics for St. Stephen, SC (based on Berkeley County data)
Religion
Adherents
Congregations
Evangelical Protestant
28,148
126
Mainline Protestant
10,346
51
Catholic
7,244
4
Black Protestant
6,388
37
Other
2,215
7
None
123,502
-
Source: Clifford Grammich, Kirk Hadaway, Richard Houseal, Dale E.Jones, Alexei Krindatch, Richie Stanley and Richard H.Taylor. 2012. 2010 U.S.Religion Census: Religious Congregations & Membership Study. Association of Statisticians of American Religious Bodies. Jones, Dale E., et al. 2002. Congregations and Membership in the United States 2000. Nashville, TN: Glenmary Research Center. Graphs represent county-level data
14 Miles Wnw At Lake Spillway (Lat: 33.446833 Lon: -80.162583), Type: Gtower, Structure height: 121.9 m, Overall height: 128 m, Call Sign: WQYK243, Assigned Frequencies: 935.637 MHz, 936.675 MHz, 938.425 MHz, Grant Date: 10/20/2016, Expiration Date: 10/20/2026, Cancellation Date: 05/18/2018, Certifier: Arthur E Brown, Registrant: South Carolina Public Service Authority, One Riverwood Drive, Moncks Corner, SC 29461, Phone: (843) 761-8000, Email:
FCC Registered Microwave Towers:
5
WTUA Studio, 4013 Byrne Street (Lat: 33.410139 Lon: -79.930500), Type: Tower, Structure height: 21.3 m, Overall height: 21.7 m, Call Sign: WQCY431, Assigned Frequencies: 946.375 MHz, 946.625 MHz, Grant Date: 06/22/2005, Expiration Date: 12/01/2027, Certifier: Alex Snipe, Registrant: Graham Brock, Inc., St. Simons Island, GA 31522, Phone: (912) 638-8028, Fax: (912) 638-7722, Email:
TIMBERLAND HS, 1418 Gravel Hill Road (Lat: 33.336917 Lon: -79.889750), Type: Upole, Structure height: 42.7 m, Overall height: 43.1 m, Call Sign: WQDZ512, Assigned Frequencies: 19360.0 MHz, 19560.0 MHz, 19460.0 MHz, Grant Date: 12/07/2005, Expiration Date: 12/07/2015, Cancellation Date: 08/19/2011, Certifier: Terry W Johnson, Registrant: Trillion Partners, Inc., 9208 Waterford Centre Blvd. Suite 150, Austin, TX 78758, Phone: (512) 334-4100, Fax: (512) 334-4099, Email:
JK Gourdin ES, 2205 Hwy 35 (Lat: 33.425139 Lon: -79.991167), Type: Tower, Structure height: 42.7 m, Overall height: 43.6 m, Call Sign: WQFP559, Assigned Frequencies: 23025.0 MHz, 23125.0 MHz, 17800.0 MHz, Grant Date: 08/31/2006, Expiration Date: 08/31/2016, Cancellation Date: 08/19/2011, Certifier: Scott Smyth, Registrant: Trillion Partners, Inc., 9208 Waterford Centre Blvd. Suite 150, Austin, TX 78758, Phone: (512) 334-4100, Fax: (512) 334-4099, Email:
St Stephen ES, 1053 Russellville Rd. (Lat: 33.397917 Lon: -79.928861), Type: Tower, Structure height: 30.5 m, Overall height: 31.4 m, Call Sign: WQFP664, Assigned Frequencies: 21825.0 MHz, Grant Date: 09/01/2006, Expiration Date: 09/01/2016, Cancellation Date: 08/19/2011, Certifier: Scott Smyth, Registrant: Trillion Partners, Inc., 9208 Waterford Centre Blvd. Suite 150, Austin, TX 78758, Phone: (512) 334-4100, Fax: (512) 334-4099, Email:
St Stephen MS, 225 Carolina Ave. (Lat: 33.404778 Lon: -79.933083), Type: Tower, Structure height: 30.5 m, Overall height: 31.4 m, Call Sign: WQFP665, Assigned Frequencies: 21925.0 MHz, Grant Date: 09/01/2006, Expiration Date: 09/01/2016, Cancellation Date: 08/19/2011, Certifier: Scott Smyth, Registrant: Trillion Partners, Inc., 9208 Waterford Centre Blvd. Suite 150, Austin, TX 78758, Phone: (512) 334-4100, Fax: (512) 334-4099, Email:
FCC Registered Amateur Radio Licenses:
2
Call Sign: KE5VVE, Licensee ID: L01421015, Grant Date: 06/12/2018, Expiration Date: 08/05/2028, Certifier: Richard E Marsh, Registrant: Richard E Marsh, 143 Janeal Ct., St. Stephen, SC 29479-3777
Call Sign: KK4CRW, Licensee ID: L01645071, Grant Date: 06/16/2011, Expiration Date: 06/16/2021, Cancellation Date: 07/08/2014, Certifier: Justin L Wyman, Registrant: Justin C Wyman, 122 Janeal Crt, St. Stephen, SC 29479
Home Mortgage Disclosure Act Aggregated Statistics For Year 2009 (Based on 1 partial tract)
C) Refinancings
D) Home Improvement Loans
Number
Average Value
Number
Average Value
LOANS ORIGINATED
1
$84,110
1
$9,660
APPLICATIONS APPROVED, NOT ACCEPTED
0
$0
0
$0
APPLICATIONS DENIED
1
$84,660
0
$0
APPLICATIONS WITHDRAWN
0
$0
0
$0
FILES CLOSED FOR INCOMPLETENESS
0
$0
0
$0
Aggregated Statistics For Year 2008 (Based on 1 partial tract)
C) Refinancings
G) Loans On Manufactured Home Dwelling (A B C & D)
Number
Average Value
Number
Average Value
LOANS ORIGINATED
1
$83,690
1
$27,390
APPLICATIONS APPROVED, NOT ACCEPTED
0
$0
0
$0
APPLICATIONS DENIED
1
$97,640
0
$0
APPLICATIONS WITHDRAWN
0
$0
0
$0
FILES CLOSED FOR INCOMPLETENESS
0
$0
0
$0
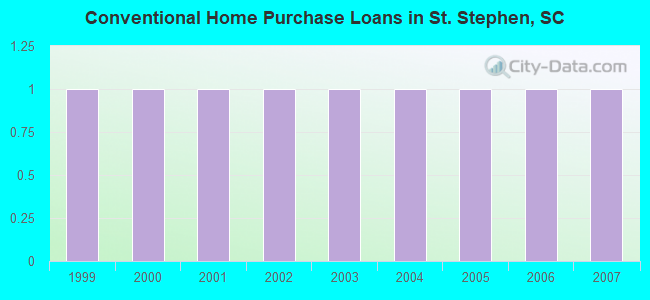
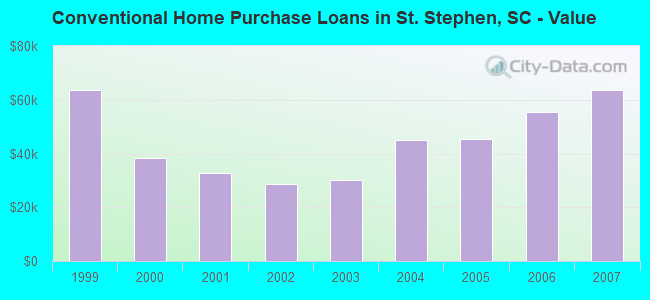
Aggregated Statistics For Year 2007 (Based on 1 partial tract)
B) Conventional Home Purchase Loans
C) Refinancings
G) Loans On Manufactured Home Dwelling (A B C & D)
Number
Average Value
Number
Average Value
Number
Average Value
LOANS ORIGINATED
1
$63,600
1
$105,350
1
$31,710
APPLICATIONS APPROVED, NOT ACCEPTED
0
$0
0
$0
0
$0
APPLICATIONS DENIED
1
$37,300
1
$139,440
1
$35,710
APPLICATIONS WITHDRAWN
0
$0
0
$0
0
$0
FILES CLOSED FOR INCOMPLETENESS
0
$0
0
$0
0
$0
Aggregated Statistics For Year 2006 (Based on 1 partial tract)
B) Conventional Home Purchase Loans
C) Refinancings
G) Loans On Manufactured Home Dwelling (A B C & D)
Number
Average Value
Number
Average Value
Number
Average Value
LOANS ORIGINATED
1
$55,520
1
$87,260
1
$25,700
APPLICATIONS APPROVED, NOT ACCEPTED
0
$0
0
$0
0
$0
APPLICATIONS DENIED
1
$75,270
2
$78,680
1
$56,330
APPLICATIONS WITHDRAWN
0
$0
1
$53,110
0
$0
FILES CLOSED FOR INCOMPLETENESS
0
$0
0
$0
0
$0
Aggregated Statistics For Year 2005 (Based on 1 partial tract)
B) Conventional Home Purchase Loans
C) Refinancings
G) Loans On Manufactured Home Dwelling (A B C & D)
Number
Average Value
Number
Average Value
Number
Average Value
LOANS ORIGINATED
1
$45,380
1
$111,380
1
$31,500
APPLICATIONS APPROVED, NOT ACCEPTED
0
$0
0
$0
0
$0
APPLICATIONS DENIED
1
$65,870
2
$78,945
1
$69,760
APPLICATIONS WITHDRAWN
0
$0
1
$63,080
0
$0
FILES CLOSED FOR INCOMPLETENESS
0
$0
0
$0
0
$0
Aggregated Statistics For Year 2004 (Based on 1 partial tract)
B) Conventional Home Purchase Loans
C) Refinancings
D) Home Improvement Loans
G) Loans On Manufactured Home Dwelling (A B C & D)
Number
Average Value
Number
Average Value
Number
Average Value
Number
Average Value
LOANS ORIGINATED
1
$45,180
1
$80,810
1
$11,020
1
$29,610
APPLICATIONS APPROVED, NOT ACCEPTED
0
$0
0
$0
0
$0
0
$0
APPLICATIONS DENIED
1
$66,510
2
$79,380
1
$20,260
1
$59,510
APPLICATIONS WITHDRAWN
0
$0
1
$62,550
0
$0
0
$0
FILES CLOSED FOR INCOMPLETENESS
0
$0
0
$0
0
$0
0
$0
Aggregated Statistics For Year 2003 (Based on 1 partial tract)
B) Conventional Home Purchase Loans
C) Refinancings
D) Home Improvement Loans
Number
Average Value
Number
Average Value
Number
Average Value
LOANS ORIGINATED
1
$30,100
2
$74,040
1
$5,670
APPLICATIONS APPROVED, NOT ACCEPTED
0
$0
0
$0
0
$0
APPLICATIONS DENIED
2
$44,780
2
$65,625
0
$0
APPLICATIONS WITHDRAWN
0
$0
0
$0
0
$0
FILES CLOSED FOR INCOMPLETENESS
0
$0
0
$0
0
$0
Aggregated Statistics For Year 2002 (Based on 1 partial tract)
B) Conventional Home Purchase Loans
C) Refinancings
D) Home Improvement Loans
Number
Average Value
Number
Average Value
Number
Average Value
LOANS ORIGINATED
1
$28,680
2
$56,785
1
$4,590
APPLICATIONS APPROVED, NOT ACCEPTED
0
$0
1
$37,630
0
$0
APPLICATIONS DENIED
1
$52,170
2
$65,960
0
$0
APPLICATIONS WITHDRAWN
0
$0
0
$0
0
$0
FILES CLOSED FOR INCOMPLETENESS
0
$0
0
$0
0
$0
Aggregated Statistics For Year 2001 (Based on 1 partial tract)
B) Conventional Home Purchase Loans
C) Refinancings
D) Home Improvement Loans
Number
Average Value
Number
Average Value
Number
Average Value
LOANS ORIGINATED
1
$32,900
2
$49,005
1
$6,530
APPLICATIONS APPROVED, NOT ACCEPTED
0
$0
0
$0
0
$0
APPLICATIONS DENIED
2
$39,745
2
$64,930
0
$0
APPLICATIONS WITHDRAWN
0
$0
1
$37,700
0
$0
FILES CLOSED FOR INCOMPLETENESS
0
$0
0
$0
0
$0
Aggregated Statistics For Year 2000 (Based on 1 partial tract)
B) Conventional Home Purchase Loans
C) Refinancings
D) Home Improvement Loans
Number
Average Value
Number
Average Value
Number
Average Value
LOANS ORIGINATED
1
$38,200
1
$80,850
1
$6,360
APPLICATIONS APPROVED, NOT ACCEPTED
1
$34,190
1
$46,140
0
$0
APPLICATIONS DENIED
3
$39,830
2
$61,235
0
$0
APPLICATIONS WITHDRAWN
0
$0
1
$39,700
0
$0
FILES CLOSED FOR INCOMPLETENESS
0
$0
0
$0
0
$0
Aggregated Statistics For Year 1999 (Based on 1 partial tract)
Detailed HMDA statistics for the following Tracts:0202.00
2003 - 2011 National Fire Incident Reporting System (NFIRS) incidents
According to the data from the years 2003 - 2011 the average number of fire incidents per year is 31. The highest number of fires - 103 took place in 2004, and the least - 0 in 2008. The data has a rising trend.
When looking into fire subcategories, the most incidents belonged to: Outside Fires (43.2%), and Structure Fires (40.0%).
Fire incident types reported to NFIRS in St. Stephen, SC


 Recent articles from our blog. Our writers, many of them Ph.D. graduates or candidates, create easy-to-read articles on a wide variety of topics.

 (36.3 miles


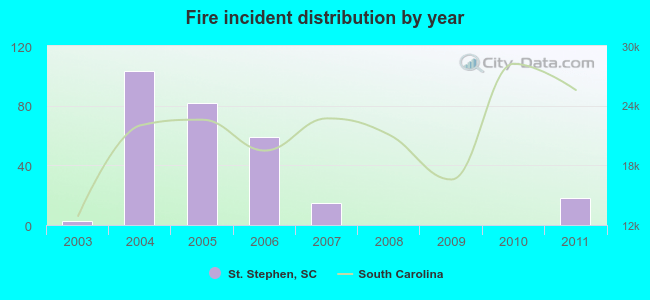 According to the data from the years 2003 - 2011 the average number of fire incidents per year is 31. The highest number of fires - 103 took place in 2004, and the least - 0 in 2008. The data has a rising trend.
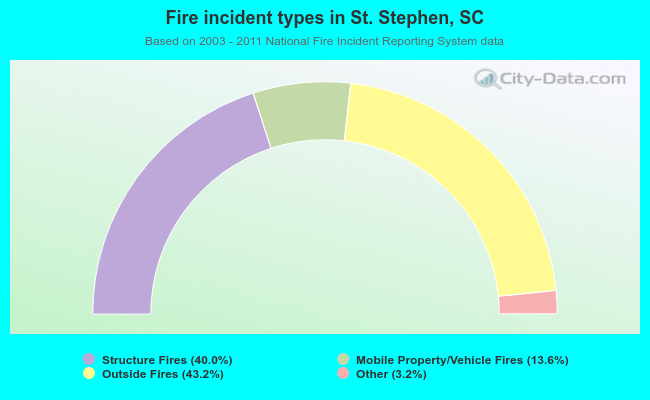 When looking into fire subcategories, the most incidents belonged to: Outside Fires (43.2%), and Structure Fires (40.0%).