Urbana, Illinois Submit your own pictures of this city and show them to the world
OSM Map
General Map
Google Map
MSN Map
OSM Map
General Map
Google Map
MSN Map
OSM Map
General Map
Google Map
MSN Map
OSM Map
General Map
Google Map
MSN Map
Please wait while loading the map...
Population in 2022: 38,468 (100% urban, 0% rural). Population change since 2000: +5.7%Males: 18,638 Females: 19,830
March 2022 cost of living index in Urbana: 86.4 (less than average, U.S. average is 100) Percentage of residents living in poverty in 2022: 27.7%for White Non-Hispanic residents , 30.8% for Black residents , 28.4% for Hispanic or Latino residents , 37.4% for other race residents , 22.2% for two or more races residents )
Profiles of local businesses
Business Search - 14 Million verified businesses
Data:
Median household income ($)
Median household income (% change since 2000)
Household income diversity
Ratio of average income to average house value (%)
Ratio of average income to average rent
Median household income ($) - White
Median household income ($) - Black or African American
Median household income ($) - Asian
Median household income ($) - Hispanic or Latino
Median household income ($) - American Indian and Alaska Native
Median household income ($) - Multirace
Median household income ($) - Other Race
Median household income for houses/condos with a mortgage ($)
Median household income for apartments without a mortgage ($)
Races - White alone (%)
Races - White alone (% change since 2000)
Races - Black alone (%)
Races - Black alone (% change since 2000)
Races - American Indian alone (%)
Races - American Indian alone (% change since 2000)
Races - Asian alone (%)
Races - Asian alone (% change since 2000)
Races - Hispanic (%)
Races - Hispanic (% change since 2000)
Races - Native Hawaiian and Other Pacific Islander alone (%)
Races - Native Hawaiian and Other Pacific Islander alone (% change since 2000)
Races - Two or more races (%)
Races - Two or more races (% change since 2000)
Races - Other race alone (%)
Races - Other race alone (% change since 2000)
Racial diversity
Unemployment (%)
Unemployment (% change since 2000)
Unemployment (%) - White
Unemployment (%) - Black or African American
Unemployment (%) - Asian
Unemployment (%) - Hispanic or Latino
Unemployment (%) - American Indian and Alaska Native
Unemployment (%) - Multirace
Unemployment (%) - Other Race
Population density (people per square mile)
Population - Males (%)
Population - Females (%)
Population - Males (%) - White
Population - Males (%) - Black or African American
Population - Males (%) - Asian
Population - Males (%) - Hispanic or Latino
Population - Males (%) - American Indian and Alaska Native
Population - Males (%) - Multirace
Population - Males (%) - Other Race
Population - Females (%) - White
Population - Females (%) - Black or African American
Population - Females (%) - Asian
Population - Females (%) - Hispanic or Latino
Population - Females (%) - American Indian and Alaska Native
Population - Females (%) - Multirace
Population - Females (%) - Other Race
Coronavirus confirmed cases (May 04, 2024)
Deaths caused by coronavirus (May 04, 2024)
Coronavirus confirmed cases (per 100k population) (May 04, 2024)
Deaths caused by coronavirus (per 100k population) (May 04, 2024)
Daily increase in number of cases (May 04, 2024)
Weekly increase in number of cases (May 04, 2024)
Cases doubled (in days) (May 04, 2024)
Hospitalized patients (Apr 18, 2022)
Negative test results (Apr 18, 2022)
Total test results (Apr 18, 2022)
COVID Vaccine doses distributed (per 100k population) (Sep 19, 2023)
COVID Vaccine doses administered (per 100k population) (Sep 19, 2023)
COVID Vaccine doses distributed (Sep 19, 2023)
COVID Vaccine doses administered (Sep 19, 2023)
Likely homosexual households (%)
Likely homosexual households (% change since 2000)
Likely homosexual households - Lesbian couples (%)
Likely homosexual households - Lesbian couples (% change since 2000)
Likely homosexual households - Gay men (%)
Likely homosexual households - Gay men (% change since 2000)
Cost of living index
Median gross rent ($)
Median contract rent ($)
Median monthly housing costs ($)
Median house or condo value ($)
Median house or condo value ($ change since 2000)
Mean house or condo value by units in structure - 1, detached ($)
Mean house or condo value by units in structure - 1, attached ($)
Mean house or condo value by units in structure - 2 ($)
Mean house or condo value by units in structure by units in structure - 3 or 4 ($)
Mean house or condo value by units in structure - 5 or more ($)
Mean house or condo value by units in structure - Boat, RV, van, etc. ($)
Mean house or condo value by units in structure - Mobile home ($)
Median house or condo value ($) - White
Median house or condo value ($) - Black or African American
Median house or condo value ($) - Asian
Median house or condo value ($) - Hispanic or Latino
Median house or condo value ($) - American Indian and Alaska Native
Median house or condo value ($) - Multirace
Median house or condo value ($) - Other Race
Median resident age
Resident age diversity
Median resident age - Males
Median resident age - Females
Median resident age - White
Median resident age - Black or African American
Median resident age - Asian
Median resident age - Hispanic or Latino
Median resident age - American Indian and Alaska Native
Median resident age - Multirace
Median resident age - Other Race
Median resident age - Males - White
Median resident age - Males - Black or African American
Median resident age - Males - Asian
Median resident age - Males - Hispanic or Latino
Median resident age - Males - American Indian and Alaska Native
Median resident age - Males - Multirace
Median resident age - Males - Other Race
Median resident age - Females - White
Median resident age - Females - Black or African American
Median resident age - Females - Asian
Median resident age - Females - Hispanic or Latino
Median resident age - Females - American Indian and Alaska Native
Median resident age - Females - Multirace
Median resident age - Females - Other Race
Commute - mean travel time to work (minutes)
Travel time to work - Less than 5 minutes (%)
Travel time to work - Less than 5 minutes (% change since 2000)
Travel time to work - 5 to 9 minutes (%)
Travel time to work - 5 to 9 minutes (% change since 2000)
Travel time to work - 10 to 19 minutes (%)
Travel time to work - 10 to 19 minutes (% change since 2000)
Travel time to work - 20 to 29 minutes (%)
Travel time to work - 20 to 29 minutes (% change since 2000)
Travel time to work - 30 to 39 minutes (%)
Travel time to work - 30 to 39 minutes (% change since 2000)
Travel time to work - 40 to 59 minutes (%)
Travel time to work - 40 to 59 minutes (% change since 2000)
Travel time to work - 60 to 89 minutes (%)
Travel time to work - 60 to 89 minutes (% change since 2000)
Travel time to work - 90 or more minutes (%)
Travel time to work - 90 or more minutes (% change since 2000)
Marital status - Never married (%)
Marital status - Now married (%)
Marital status - Separated (%)
Marital status - Widowed (%)
Marital status - Divorced (%)
Median family income ($)
Median family income (% change since 2000)
Median non-family income ($)
Median non-family income (% change since 2000)
Median per capita income ($)
Median per capita income (% change since 2000)
Median family income ($) - White
Median family income ($) - Black or African American
Median family income ($) - Asian
Median family income ($) - Hispanic or Latino
Median family income ($) - American Indian and Alaska Native
Median family income ($) - Multirace
Median family income ($) - Other Race
Median year house/condo built
Median year apartment built
Year house built - Built 2005 or later (%)
Year house built - Built 2000 to 2004 (%)
Year house built - Built 1990 to 1999 (%)
Year house built - Built 1980 to 1989 (%)
Year house built - Built 1970 to 1979 (%)
Year house built - Built 1960 to 1969 (%)
Year house built - Built 1950 to 1959 (%)
Year house built - Built 1940 to 1949 (%)
Year house built - Built 1939 or earlier (%)
Average household size
Household density (households per square mile)
Average household size - White
Average household size - Black or African American
Average household size - Asian
Average household size - Hispanic or Latino
Average household size - American Indian and Alaska Native
Average household size - Multirace
Average household size - Other Race
Occupied housing units (%)
Vacant housing units (%)
Owner occupied housing units (%)
Renter occupied housing units (%)
Vacancy status - For rent (%)
Vacancy status - For sale only (%)
Vacancy status - Rented or sold, not occupied (%)
Vacancy status - For seasonal, recreational, or occasional use (%)
Vacancy status - For migrant workers (%)
Vacancy status - Other vacant (%)
Residents with income below the poverty level (%)
Residents with income below 50% of the poverty level (%)
Children below poverty level (%)
Poor families by family type - Married-couple family (%)
Poor families by family type - Male, no wife present (%)
Poor families by family type - Female, no husband present (%)
Poverty status for native-born residents (%)
Poverty status for foreign-born residents (%)
Poverty among high school graduates not in families (%)
Poverty among people who did not graduate high school not in families (%)
Residents with income below the poverty level (%) - White
Residents with income below the poverty level (%) - Black or African American
Residents with income below the poverty level (%) - Asian
Residents with income below the poverty level (%) - Hispanic or Latino
Residents with income below the poverty level (%) - American Indian and Alaska Native
Residents with income below the poverty level (%) - Multirace
Residents with income below the poverty level (%) - Other Race
Air pollution - Air Quality Index (AQI)
Air pollution - CO
Air pollution - NO2
Air pollution - SO2
Air pollution - Ozone
Air pollution - PM10
Air pollution - PM25
Air pollution - Pb
Crime - Murders per 100,000 population
Crime - Rapes per 100,000 population
Crime - Robberies per 100,000 population
Crime - Assaults per 100,000 population
Crime - Burglaries per 100,000 population
Crime - Thefts per 100,000 population
Crime - Auto thefts per 100,000 population
Crime - Arson per 100,000 population
Crime - City-data.com crime index
Crime - Violent crime index
Crime - Property crime index
Crime - Murders per 100,000 population (5 year average)
Crime - Rapes per 100,000 population (5 year average)
Crime - Robberies per 100,000 population (5 year average)
Crime - Assaults per 100,000 population (5 year average)
Crime - Burglaries per 100,000 population (5 year average)
Crime - Thefts per 100,000 population (5 year average)
Crime - Auto thefts per 100,000 population (5 year average)
Crime - Arson per 100,000 population (5 year average)
Crime - City-data.com crime index (5 year average)
Crime - Violent crime index (5 year average)
Crime - Property crime index (5 year average)
1996 Presidential Elections Results (%) - Democratic Party (Clinton)
1996 Presidential Elections Results (%) - Republican Party (Dole)
1996 Presidential Elections Results (%) - Other
2000 Presidential Elections Results (%) - Democratic Party (Gore)
2000 Presidential Elections Results (%) - Republican Party (Bush)
2000 Presidential Elections Results (%) - Other
2004 Presidential Elections Results (%) - Democratic Party (Kerry)
2004 Presidential Elections Results (%) - Republican Party (Bush)
2004 Presidential Elections Results (%) - Other
2008 Presidential Elections Results (%) - Democratic Party (Obama)
2008 Presidential Elections Results (%) - Republican Party (McCain)
2008 Presidential Elections Results (%) - Other
2012 Presidential Elections Results (%) - Democratic Party (Obama)
2012 Presidential Elections Results (%) - Republican Party (Romney)
2012 Presidential Elections Results (%) - Other
2016 Presidential Elections Results (%) - Democratic Party (Clinton)
2016 Presidential Elections Results (%) - Republican Party (Trump)
2016 Presidential Elections Results (%) - Other
2020 Presidential Elections Results (%) - Democratic Party (Biden)
2020 Presidential Elections Results (%) - Republican Party (Trump)
2020 Presidential Elections Results (%) - Other
Ancestries Reported - Arab (%)
Ancestries Reported - Czech (%)
Ancestries Reported - Danish (%)
Ancestries Reported - Dutch (%)
Ancestries Reported - English (%)
Ancestries Reported - French (%)
Ancestries Reported - French Canadian (%)
Ancestries Reported - German (%)
Ancestries Reported - Greek (%)
Ancestries Reported - Hungarian (%)
Ancestries Reported - Irish (%)
Ancestries Reported - Italian (%)
Ancestries Reported - Lithuanian (%)
Ancestries Reported - Norwegian (%)
Ancestries Reported - Polish (%)
Ancestries Reported - Portuguese (%)
Ancestries Reported - Russian (%)
Ancestries Reported - Scotch-Irish (%)
Ancestries Reported - Scottish (%)
Ancestries Reported - Slovak (%)
Ancestries Reported - Subsaharan African (%)
Ancestries Reported - Swedish (%)
Ancestries Reported - Swiss (%)
Ancestries Reported - Ukrainian (%)
Ancestries Reported - United States (%)
Ancestries Reported - Welsh (%)
Ancestries Reported - West Indian (%)
Ancestries Reported - Other (%)
Educational Attainment - No schooling completed (%)
Educational Attainment - Less than high school (%)
Educational Attainment - High school or equivalent (%)
Educational Attainment - Less than 1 year of college (%)
Educational Attainment - 1 or more years of college (%)
Educational Attainment - Associate degree (%)
Educational Attainment - Bachelor's degree (%)
Educational Attainment - Master's degree (%)
Educational Attainment - Professional school degree (%)
Educational Attainment - Doctorate degree (%)
School Enrollment - Nursery, preschool (%)
School Enrollment - Kindergarten (%)
School Enrollment - Grade 1 to 4 (%)
School Enrollment - Grade 5 to 8 (%)
School Enrollment - Grade 9 to 12 (%)
School Enrollment - College undergrad (%)
School Enrollment - Graduate or professional (%)
School Enrollment - Not enrolled in school (%)
School enrollment - Public schools (%)
School enrollment - Private schools (%)
School enrollment - Not enrolled (%)
Median number of rooms in houses and condos
Median number of rooms in apartments
Housing units lacking complete plumbing facilities (%)
Housing units lacking complete kitchen facilities (%)
Density of houses
Urban houses (%)
Rural houses (%)
Households with people 60 years and over (%)
Households with people 65 years and over (%)
Households with people 75 years and over (%)
Households with one or more nonrelatives (%)
Households with no nonrelatives (%)
Population in households (%)
Family households (%)
Nonfamily households (%)
Population in families (%)
Family households with own children (%)
Median number of bedrooms in owner occupied houses
Mean number of bedrooms in owner occupied houses
Median number of bedrooms in renter occupied houses
Mean number of bedrooms in renter occupied houses
Median number of vehichles in owner occupied houses
Mean number of vehichles in owner occupied houses
Median number of vehichles in renter occupied houses
Mean number of vehichles in renter occupied houses
Mortgage status - with mortgage (%)
Mortgage status - with second mortgage (%)
Mortgage status - with home equity loan (%)
Mortgage status - with both second mortgage and home equity loan (%)
Mortgage status - without a mortgage (%)
Average family size
Average family size - White
Average family size - Black or African American
Average family size - Asian
Average family size - Hispanic or Latino
Average family size - American Indian and Alaska Native
Average family size - Multirace
Average family size - Other Race
Geographical mobility - Same house 1 year ago (%)
Geographical mobility - Moved within same county (%)
Geographical mobility - Moved from different county within same state (%)
Geographical mobility - Moved from different state (%)
Geographical mobility - Moved from abroad (%)
Place of birth - Born in state of residence (%)
Place of birth - Born in other state (%)
Place of birth - Native, outside of US (%)
Place of birth - Foreign born (%)
Housing units in structures - 1, detached (%)
Housing units in structures - 1, attached (%)
Housing units in structures - 2 (%)
Housing units in structures - 3 or 4 (%)
Housing units in structures - 5 to 9 (%)
Housing units in structures - 10 to 19 (%)
Housing units in structures - 20 to 49 (%)
Housing units in structures - 50 or more (%)
Housing units in structures - Mobile home (%)
Housing units in structures - Boat, RV, van, etc. (%)
House/condo owner moved in on average (years ago)
Renter moved in on average (years ago)
Year householder moved into unit - Moved in 1999 to March 2000 (%)
Year householder moved into unit - Moved in 1995 to 1998 (%)
Year householder moved into unit - Moved in 1990 to 1994 (%)
Year householder moved into unit - Moved in 1980 to 1989 (%)
Year householder moved into unit - Moved in 1970 to 1979 (%)
Year householder moved into unit - Moved in 1969 or earlier (%)
Means of transportation to work - Drove car alone (%)
Means of transportation to work - Carpooled (%)
Means of transportation to work - Public transportation (%)
Means of transportation to work - Bus or trolley bus (%)
Means of transportation to work - Streetcar or trolley car (%)
Means of transportation to work - Subway or elevated (%)
Means of transportation to work - Railroad (%)
Means of transportation to work - Ferryboat (%)
Means of transportation to work - Taxicab (%)
Means of transportation to work - Motorcycle (%)
Means of transportation to work - Bicycle (%)
Means of transportation to work - Walked (%)
Means of transportation to work - Other means (%)
Working at home (%)
Industry diversity
Most Common Industries - Agriculture, forestry, fishing and hunting, and mining (%)
Most Common Industries - Agriculture, forestry, fishing and hunting (%)
Most Common Industries - Mining, quarrying, and oil and gas extraction (%)
Most Common Industries - Construction (%)
Most Common Industries - Manufacturing (%)
Most Common Industries - Wholesale trade (%)
Most Common Industries - Retail trade (%)
Most Common Industries - Transportation and warehousing, and utilities (%)
Most Common Industries - Transportation and warehousing (%)
Most Common Industries - Utilities (%)
Most Common Industries - Information (%)
Most Common Industries - Finance and insurance, and real estate and rental and leasing (%)
Most Common Industries - Finance and insurance (%)
Most Common Industries - Real estate and rental and leasing (%)
Most Common Industries - Professional, scientific, and management, and administrative and waste management services (%)
Most Common Industries - Professional, scientific, and technical services (%)
Most Common Industries - Management of companies and enterprises (%)
Most Common Industries - Administrative and support and waste management services (%)
Most Common Industries - Educational services, and health care and social assistance (%)
Most Common Industries - Educational services (%)
Most Common Industries - Health care and social assistance (%)
Most Common Industries - Arts, entertainment, and recreation, and accommodation and food services (%)
Most Common Industries - Arts, entertainment, and recreation (%)
Most Common Industries - Accommodation and food services (%)
Most Common Industries - Other services, except public administration (%)
Most Common Industries - Public administration (%)
Occupation diversity
Most Common Occupations - Management, business, science, and arts occupations (%)
Most Common Occupations - Management, business, and financial occupations (%)
Most Common Occupations - Management occupations (%)
Most Common Occupations - Business and financial operations occupations (%)
Most Common Occupations - Computer, engineering, and science occupations (%)
Most Common Occupations - Computer and mathematical occupations (%)
Most Common Occupations - Architecture and engineering occupations (%)
Most Common Occupations - Life, physical, and social science occupations (%)
Most Common Occupations - Education, legal, community service, arts, and media occupations (%)
Most Common Occupations - Community and social service occupations (%)
Most Common Occupations - Legal occupations (%)
Most Common Occupations - Education, training, and library occupations (%)
Most Common Occupations - Arts, design, entertainment, sports, and media occupations (%)
Most Common Occupations - Healthcare practitioners and technical occupations (%)
Most Common Occupations - Health diagnosing and treating practitioners and other technical occupations (%)
Most Common Occupations - Health technologists and technicians (%)
Most Common Occupations - Service occupations (%)
Most Common Occupations - Healthcare support occupations (%)
Most Common Occupations - Protective service occupations (%)
Most Common Occupations - Fire fighting and prevention, and other protective service workers including supervisors (%)
Most Common Occupations - Law enforcement workers including supervisors (%)
Most Common Occupations - Food preparation and serving related occupations (%)
Most Common Occupations - Building and grounds cleaning and maintenance occupations (%)
Most Common Occupations - Personal care and service occupations (%)
Most Common Occupations - Sales and office occupations (%)
Most Common Occupations - Sales and related occupations (%)
Most Common Occupations - Office and administrative support occupations (%)
Most Common Occupations - Natural resources, construction, and maintenance occupations (%)
Most Common Occupations - Farming, fishing, and forestry occupations (%)
Most Common Occupations - Construction and extraction occupations (%)
Most Common Occupations - Installation, maintenance, and repair occupations (%)
Most Common Occupations - Production, transportation, and material moving occupations (%)
Most Common Occupations - Production occupations (%)
Most Common Occupations - Transportation occupations (%)
Most Common Occupations - Material moving occupations (%)
People in Group quarters - Institutionalized population (%)
People in Group quarters - Correctional institutions (%)
People in Group quarters - Federal prisons and detention centers (%)
People in Group quarters - Halfway houses (%)
People in Group quarters - Local jails and other confinement facilities (including police lockups) (%)
People in Group quarters - Military disciplinary barracks (%)
People in Group quarters - State prisons (%)
People in Group quarters - Other types of correctional institutions (%)
People in Group quarters - Nursing homes (%)
People in Group quarters - Hospitals/wards, hospices, and schools for the handicapped (%)
People in Group quarters - Hospitals/wards and hospices for chronically ill (%)
People in Group quarters - Hospices or homes for chronically ill (%)
People in Group quarters - Military hospitals or wards for chronically ill (%)
People in Group quarters - Other hospitals or wards for chronically ill (%)
People in Group quarters - Hospitals or wards for drug/alcohol abuse (%)
People in Group quarters - Mental (Psychiatric) hospitals or wards (%)
People in Group quarters - Schools, hospitals, or wards for the mentally retarded (%)
People in Group quarters - Schools, hospitals, or wards for the physically handicapped (%)
People in Group quarters - Institutions for the deaf (%)
People in Group quarters - Institutions for the blind (%)
People in Group quarters - Orthopedic wards and institutions for the physically handicapped (%)
People in Group quarters - Wards in general hospitals for patients who have no usual home elsewhere (%)
People in Group quarters - Wards in military hospitals for patients who have no usual home elsewhere (%)
People in Group quarters - Juvenile institutions (%)
People in Group quarters - Long-term care (%)
People in Group quarters - Homes for abused, dependent, and neglected children (%)
People in Group quarters - Residential treatment centers for emotionally disturbed children (%)
People in Group quarters - Training schools for juvenile delinquents (%)
People in Group quarters - Short-term care, detention or diagnostic centers for delinquent children (%)
People in Group quarters - Type of juvenile institution unknown (%)
People in Group quarters - Noninstitutionalized population (%)
People in Group quarters - College dormitories (includes college quarters off campus) (%)
People in Group quarters - Military quarters (%)
People in Group quarters - On base (%)
People in Group quarters - Barracks, unaccompanied personnel housing (UPH), (Enlisted/Officer), ;and similar group living quarters for military personnel (%)
People in Group quarters - Transient quarters for temporary residents (%)
People in Group quarters - Military ships (%)
People in Group quarters - Group homes (%)
People in Group quarters - Homes or halfway houses for drug/alcohol abuse (%)
People in Group quarters - Homes for the mentally ill (%)
People in Group quarters - Homes for the mentally retarded (%)
People in Group quarters - Homes for the physically handicapped (%)
People in Group quarters - Other group homes (%)
People in Group quarters - Religious group quarters (%)
People in Group quarters - Dormitories (%)
People in Group quarters - Agriculture workers' dormitories on farms (%)
People in Group quarters - Job Corps and vocational training facilities (%)
People in Group quarters - Other workers' dormitories (%)
People in Group quarters - Crews of maritime vessels (%)
People in Group quarters - Other nonhousehold living situations (%)
People in Group quarters - Other noninstitutional group quarters (%)
Residents speaking English at home (%)
Residents speaking English at home - Born in the United States (%)
Residents speaking English at home - Native, born elsewhere (%)
Residents speaking English at home - Foreign born (%)
Residents speaking Spanish at home (%)
Residents speaking Spanish at home - Born in the United States (%)
Residents speaking Spanish at home - Native, born elsewhere (%)
Residents speaking Spanish at home - Foreign born (%)
Residents speaking other language at home (%)
Residents speaking other language at home - Born in the United States (%)
Residents speaking other language at home - Native, born elsewhere (%)
Residents speaking other language at home - Foreign born (%)
Class of Workers - Employee of private company (%)
Class of Workers - Self-employed in own incorporated business (%)
Class of Workers - Private not-for-profit wage and salary workers (%)
Class of Workers - Local government workers (%)
Class of Workers - State government workers (%)
Class of Workers - Federal government workers (%)
Class of Workers - Self-employed workers in own not incorporated business and Unpaid family workers (%)
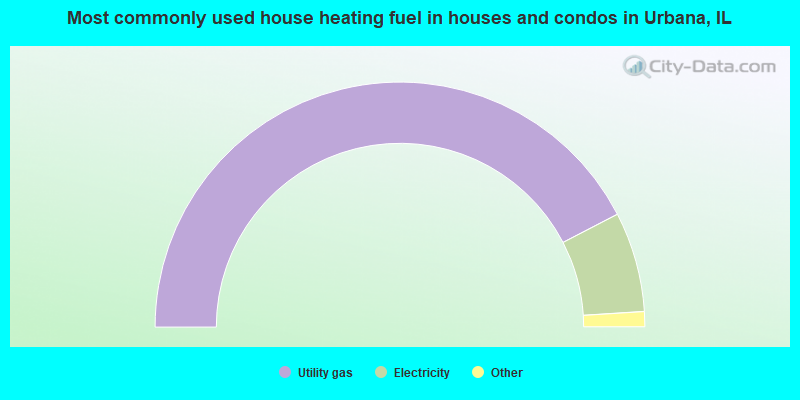
House heating fuel used in houses and condos - Utility gas (%)
House heating fuel used in houses and condos - Bottled, tank, or LP gas (%)
House heating fuel used in houses and condos - Electricity (%)
House heating fuel used in houses and condos - Fuel oil, kerosene, etc. (%)
House heating fuel used in houses and condos - Coal or coke (%)
House heating fuel used in houses and condos - Wood (%)
House heating fuel used in houses and condos - Solar energy (%)
House heating fuel used in houses and condos - Other fuel (%)
House heating fuel used in houses and condos - No fuel used (%)
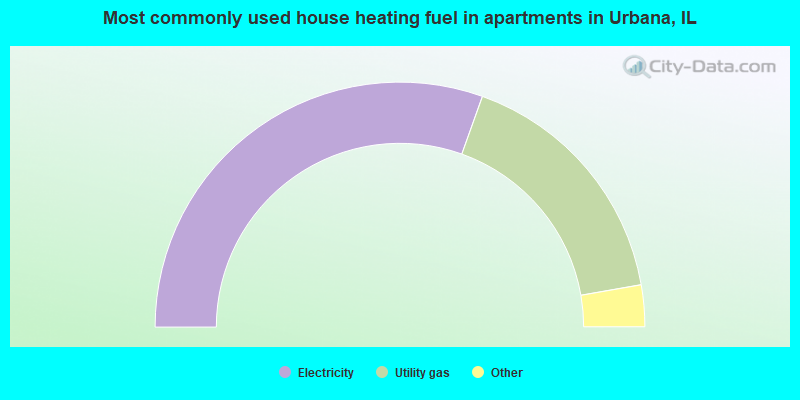
House heating fuel used in apartments - Utility gas (%)
House heating fuel used in apartments - Bottled, tank, or LP gas (%)
House heating fuel used in apartments - Electricity (%)
House heating fuel used in apartments - Fuel oil, kerosene, etc. (%)
House heating fuel used in apartments - Coal or coke (%)
House heating fuel used in apartments - Wood (%)
House heating fuel used in apartments - Solar energy (%)
House heating fuel used in apartments - Other fuel (%)
House heating fuel used in apartments - No fuel used (%)
Armed forces status - In Armed Forces (%)
Armed forces status - Civilian (%)
Armed forces status - Civilian - Veteran (%)
Armed forces status - Civilian - Nonveteran (%)
Fatal accidents locations in years 2005-2021
Fatal accidents locations in 2005
Fatal accidents locations in 2006
Fatal accidents locations in 2007
Fatal accidents locations in 2008
Fatal accidents locations in 2009
Fatal accidents locations in 2010
Fatal accidents locations in 2011
Fatal accidents locations in 2012
Fatal accidents locations in 2013
Fatal accidents locations in 2014
Fatal accidents locations in 2015
Fatal accidents locations in 2016
Fatal accidents locations in 2017
Fatal accidents locations in 2018
Fatal accidents locations in 2019
Fatal accidents locations in 2020
Fatal accidents locations in 2021
Alcohol use - People drinking some alcohol every month (%)
Alcohol use - People not drinking at all (%)
Alcohol use - Average days/month drinking alcohol
Alcohol use - Average drinks/week
Alcohol use - Average days/year people drink much
Audiometry - Average condition of hearing (%)
Audiometry - People that can hear a whisper from across a quiet room (%)
Audiometry - People that can hear normal voice from across a quiet room (%)
Audiometry - Ears ringing, roaring, buzzing (%)
Audiometry - Had a job exposure to loud noise (%)
Audiometry - Had off-work exposure to loud noise (%)
Blood Pressure & Cholesterol - Has high blood pressure (%)
Blood Pressure & Cholesterol - Checking blood pressure at home (%)
Blood Pressure & Cholesterol - Frequently checking blood cholesterol (%)
Blood Pressure & Cholesterol - Has high cholesterol level (%)
Consumer Behavior - Money monthly spent on food at supermarket/grocery store
Consumer Behavior - Money monthly spent on food at other stores
Consumer Behavior - Money monthly spent on eating out
Consumer Behavior - Money monthly spent on carryout/delivered foods
Consumer Behavior - Income spent on food at supermarket/grocery store (%)
Consumer Behavior - Income spent on food at other stores (%)
Consumer Behavior - Income spent on eating out (%)
Consumer Behavior - Income spent on carryout/delivered foods (%)
Current Health Status - General health condition (%)
Current Health Status - Blood donors (%)
Current Health Status - Has blood ever tested for HIV virus (%)
Current Health Status - Left-handed people (%)
Dermatology - People using sunscreen (%)
Diabetes - Diabetics (%)
Diabetes - Had a blood test for high blood sugar (%)
Diabetes - People taking insulin (%)
Diet Behavior & Nutrition - Diet health (%)
Diet Behavior & Nutrition - Milk product consumption (# of products/month)
Diet Behavior & Nutrition - Meals not home prepared (#/week)
Diet Behavior & Nutrition - Meals from fast food or pizza place (#/week)
Diet Behavior & Nutrition - Ready-to-eat foods (#/month)
Diet Behavior & Nutrition - Frozen meals/pizza (#/month)
Drug Use - People that ever used marijuana or hashish (%)
Drug Use - Ever used hard drugs (%)
Drug Use - Ever used any form of cocaine (%)
Drug Use - Ever used heroin (%)
Drug Use - Ever used methamphetamine (%)
Health Insurance - People covered by health insurance (%)
Kidney Conditions-Urology - Avg. # of times urinating at night
Medical Conditions - People with asthma (%)
Medical Conditions - People with anemia (%)
Medical Conditions - People with psoriasis (%)
Medical Conditions - People with overweight (%)
Medical Conditions - Elderly people having difficulties in thinking or remembering (%)
Medical Conditions - People who ever received blood transfusion (%)
Medical Conditions - People having trouble seeing even with glass/contacts (%)
Medical Conditions - People with arthritis (%)
Medical Conditions - People with gout (%)
Medical Conditions - People with congestive heart failure (%)
Medical Conditions - People with coronary heart disease (%)
Medical Conditions - People with angina pectoris (%)
Medical Conditions - People who ever had heart attack (%)
Medical Conditions - People who ever had stroke (%)
Medical Conditions - People with emphysema (%)
Medical Conditions - People with thyroid problem (%)
Medical Conditions - People with chronic bronchitis (%)
Medical Conditions - People with any liver condition (%)
Medical Conditions - People who ever had cancer or malignancy (%)
Mental Health - People who have little interest in doing things (%)
Mental Health - People feeling down, depressed, or hopeless (%)
Mental Health - People who have trouble sleeping or sleeping too much (%)
Mental Health - People feeling tired or having little energy (%)
Mental Health - People with poor appetite or overeating (%)
Mental Health - People feeling bad about themself (%)
Mental Health - People who have trouble concentrating on things (%)
Mental Health - People moving or speaking slowly or too fast (%)
Mental Health - People having thoughts they would be better off dead (%)
Oral Health - Average years since last visit a dentist
Oral Health - People embarrassed because of mouth (%)
Oral Health - People with gum disease (%)
Oral Health - General health of teeth and gums (%)
Oral Health - Average days a week using dental floss/device
Oral Health - Average days a week using mouthwash for dental problem
Oral Health - Average number of teeth
Pesticide Use - Households using pesticides to control insects (%)
Pesticide Use - Households using pesticides to kill weeds (%)
Physical Activity - People doing vigorous-intensity work activities (%)
Physical Activity - People doing moderate-intensity work activities (%)
Physical Activity - People walking or bicycling (%)
Physical Activity - People doing vigorous-intensity recreational activities (%)
Physical Activity - People doing moderate-intensity recreational activities (%)
Physical Activity - Average hours a day doing sedentary activities
Physical Activity - Average hours a day watching TV or videos
Physical Activity - Average hours a day using computer
Physical Functioning - People having limitations keeping them from working (%)
Physical Functioning - People limited in amount of work they can do (%)
Physical Functioning - People that need special equipment to walk (%)
Physical Functioning - People experiencing confusion/memory problems (%)
Physical Functioning - People requiring special healthcare equipment (%)
Prescription Medications - Average number of prescription medicines taking
Preventive Aspirin Use - Adults 40+ taking low-dose aspirin (%)
Reproductive Health - Vaginal deliveries (%)
Reproductive Health - Cesarean deliveries (%)
Reproductive Health - Deliveries resulted in a live birth (%)
Reproductive Health - Pregnancies resulted in a delivery (%)
Reproductive Health - Women breastfeeding newborns (%)
Reproductive Health - Women that had a hysterectomy (%)
Reproductive Health - Women that had both ovaries removed (%)
Reproductive Health - Women that have ever taken birth control pills (%)
Reproductive Health - Women taking birth control pills (%)
Reproductive Health - Women that have ever used Depo-Provera or injectables (%)
Reproductive Health - Women that have ever used female hormones (%)
Sexual Behavior - People 18+ that ever had sex (vaginal, anal, or oral) (%)
Sexual Behavior - Males 18+ that ever had vaginal sex with a woman (%)
Sexual Behavior - Males 18+ that ever performed oral sex on a woman (%)
Sexual Behavior - Males 18+ that ever had anal sex with a woman (%)
Sexual Behavior - Males 18+ that ever had any sex with a man (%)
Sexual Behavior - Females 18+ that ever had vaginal sex with a man (%)
Sexual Behavior - Females 18+ that ever performed oral sex on a man (%)
Sexual Behavior - Females 18+ that ever had anal sex with a man (%)
Sexual Behavior - Females 18+ that ever had any kind of sex with a woman (%)
Sexual Behavior - Average age people first had sex
Sexual Behavior - Average number of female sex partners in lifetime (males 18+)
Sexual Behavior - Average number of female vaginal sex partners in lifetime (males 18+)
Sexual Behavior - Average age people first performed oral sex on a woman (18+)
Sexual Behavior - Average number of woman performed oral sex on in lifetime (18+)
Sexual Behavior - Average number of male sex partners in lifetime (males 18+)
Sexual Behavior - Average number of male anal sex partners in lifetime (males 18+)
Sexual Behavior - Average age people first performed oral sex on a man (18+)
Sexual Behavior - Average number of male oral sex partners in lifetime (18+)
Sexual Behavior - People using protection when performing oral sex (%)
Sexual Behavior - Average number of times people have vaginal or anal sex a year
Sexual Behavior - People having sex without condom (%)
Sexual Behavior - Average number of male sex partners in lifetime (females 18+)
Sexual Behavior - Average number of male vaginal sex partners in lifetime (females 18+)
Sexual Behavior - Average number of female sex partners in lifetime (females 18+)
Sexual Behavior - Circumcised males 18+ (%)
Sleep Disorders - Average hours sleeping at night
Sleep Disorders - People that has trouble sleeping (%)
Smoking-Cigarette Use - People smoking cigarettes (%)
Taste & Smell - People 40+ having problems with smell (%)
Taste & Smell - People 40+ having problems with taste (%)
Taste & Smell - People 40+ that ever had wisdom teeth removed (%)
Taste & Smell - People 40+ that ever had tonsils teeth removed (%)
Taste & Smell - People 40+ that ever had a loss of consciousness because of a head injury (%)
Taste & Smell - People 40+ that ever had a broken nose or other serious injury to face or skull (%)
Taste & Smell - People 40+ that ever had two or more sinus infections (%)
Weight - Average height (inches)
Weight - Average weight (pounds)
Weight - Average BMI
Weight - People that are obese (%)
Weight - People that ever were obese (%)
Weight - People trying to lose weight (%)
Officers per 1,000 residents here:
1.37Illinois average:
3.04
Latest news from Urbana, IL collected exclusively by city-data.com from local newspapers, TV, and radio stations
Ancestries: German (9.2%), American (4.5%), Irish (2.8%), English (2.6%), Italian (2.3%), Polish (1.9%).
Current Local Time:
Incorporated on 06/30/1873
Land area: 10.5 square miles.
Population density: 3,666 people per square mile (average).
7,185 residents are foreign born (11.6% Asia , 2.3% Africa , 2.1% Latin America , 2.0% Europe ).
This city:
18.5%Illinois:
14.1%
Median real estate property taxes paid for housing units with mortgages in 2022: $4,407 (2.5%)Median real estate property taxes paid for housing units with no mortgage in 2022: $4,618 (2.6%)
Nearest city with pop. 50,000+: Champaign, IL
Nearest city with pop. 200,000+: Indianapolis, IN
Nearest city with pop. 1,000,000+: Chicago, IL
Nearest cities:
Latitude: 40.11 N, Longitude: 88.20 W
Daytime population change due to commuting: +12,381 (+32.0%)Workers who live and work in this city: 11,804 (62.4%)
Single-family new house construction building permits:
2022: 66 buildings , average cost: $219,1002021: 58 buildings , average cost: $246,7002020: 22 buildings , average cost: $185,8002019: 22 buildings , average cost: $217,2002018: 40 buildings , average cost: $176,6002017: 28 buildings , average cost: $178,6002016: 34 buildings , average cost: $159,9002015: 21 buildings , average cost: $194,5002014: 44 buildings , average cost: $181,7002013: 15 buildings , average cost: $159,0002012: 24 buildings , average cost: $233,8002011: 15 buildings , average cost: $156,8002010: 28 buildings , average cost: $177,6002009: 57 buildings , average cost: $115,9002008: 50 buildings , average cost: $148,1002007: 83 buildings , average cost: $125,7002006: 120 buildings , average cost: $131,6002005: 104 buildings , average cost: $133,4002004: 155 buildings , average cost: $116,9002003: 156 buildings , average cost: $96,1002002: 176 buildings , average cost: $109,4002001: 82 buildings , average cost: $102,0002000: 49 buildings , average cost: $120,6001999: 39 buildings , average cost: $125,1001998: 35 buildings , average cost: $124,6001997: 27 buildings , average cost: $122,100Unemployment in December 2023:
Most common industries in Urbana, IL (%)
Both Males Females
Educational services (40.0%)
Health care (7.3%)
Accommodation & food services (7.3%)
Professional, scientific, technical services (6.1%)
Public administration (2.9%)
Construction (2.4%)
Arts, entertainment, recreation (2.3%)
Educational services (41.9%)
Professional, scientific, technical services (7.4%)
Accommodation & food services (7.2%)
Construction (4.0%)
Public administration (3.1%)
Health care (3.1%)
Arts, entertainment, recreation (2.4%)
Educational services (38.0%)
Health care (11.9%)
Accommodation & food services (7.4%)
Professional, scientific, technical services (4.7%)
Social assistance (3.4%)
Finance & insurance (3.4%)
Public administration (2.7%)
Most common occupations in Urbana, IL (%)
Both Males Females
Postsecondary teachers (16.7%)
Computer specialists (5.9%)
Other office and administrative support workers, including supervisors (4.6%)
Life and physical scientists (3.5%)
Other management occupations, except farmers and farm managers (3.1%)
Retail sales workers, except cashiers (3.1%)
Information and record clerks, except customer service representatives (2.9%)
Postsecondary teachers (19.8%)
Computer specialists (8.4%)
Life and physical scientists (5.2%)
Other management occupations, except farmers and farm managers (3.4%)
Retail sales workers, except cashiers (3.3%)
Building and grounds cleaning and maintenance occupations (2.8%)
Other office and administrative support workers, including supervisors (2.6%)
Postsecondary teachers (13.2%)
Other office and administrative support workers, including supervisors (6.8%)
Secretaries and administrative assistants (4.4%)
Information and record clerks, except customer service representatives (4.3%)
Preschool, kindergarten, elementary, and middle school teachers (3.3%)
Waiters and waitresses (3.3%)
Computer specialists (3.1%)
Tornado activity:
Urbana-area historical tornado activity is near Illinois state average. It is 80% greater than the overall U.S. average.
On 4/19/1996, a category F3 (max. wind speeds 158-206 mph) tornado 2.4 miles away from the Urbana city center injured 12 people and caused $9 million in damages.
On 3/20/1976, a category F4 (max. wind speeds 207-260 mph) tornado 28.4 miles away from the city center injured 18 people and caused between $500,000 and $5,000,000 in damages.
Earthquake activity:
Urbana-area historical earthquake activity is significantly above Illinois state average. It is 109% greater than the overall U.S. average. On 4/18/2008 at 09:36:59, a magnitude 5.4 (5.1 MB, 4.8 MS, 5.4 MW, 5.2 MW, Class: Moderate, Intensity: VI - VII) earthquake occurred 115.9 miles away from Urbana center On 6/10/1987 at 23:48:54, a magnitude 5.1 (4.9 MB, 4.4 MS, 4.6 MS, 5.1 LG) earthquake occurred 90.7 miles away from Urbana center On 4/18/2008 at 09:36:59, a magnitude 5.2 (5.2 MW, Depth: 8.9 mi) earthquake occurred 115.9 miles away from Urbana center On 6/18/2002 at 17:37:15, a magnitude 5.0 (4.3 MB, 4.6 MW, 5.0 LG) earthquake occurred 148.6 miles away from Urbana center On 4/18/2008 at 15:14:16, a magnitude 4.8 (4.5 MB, 4.8 MW, 4.6 MW, Class: Light, Intensity: IV - V) earthquake occurred 114.6 miles away from the city center On 4/3/1974 at 23:05:02, a magnitude 4.7 (4.5 MB, 4.7 LG) earthquake occurred 105.1 miles away from the city center Magnitude types: regional Lg-wave magnitude (LG), body-wave magnitude (MB), surface-wave magnitude (MS), moment magnitude (MW) Natural disasters: The number of natural disasters in Champaign County (11) is smaller than the US average (15).Major Disasters (Presidential) Declared: 8Emergencies Declared: 2Storms: 8, Tornadoes: 5, Floods: 4, Hurricane: 1, Ice Storm: 1, Snow: 1, Wind: 1, Other: 1 (Note: some incidents may be assigned to more than one category). Main business address for: FIRST BUSEY CORP /NV/ STATE COMMERCIAL BANKS ).
Hospitals and medical centers in Urbana: PRESENCE COVENANT MEDICAL CENTER (Voluntary non-profit - Church, 1400 WEST PARK AVENUE) THE CARLE FOUNDATION HOSPITAL (Voluntary non-profit - Private, provides emergency services, 611 WEST PARK STREET) CARE CENTRE OF URBANA (907 NORTH LINCOLN)
CHAMPAIGN COUNTY NURSING HOME (500 SOUTH ART BARTELL DRIVE)
CLARK-LINDSEY VILLAGE (101 WEST WINDSOR ROAD)
MANORCARE AT URBANA (600 NORTH COLER AVENUE)
URBANA NURSING HOME (2006 S PHILO RD)
FMC - CHAMPAIGN - URBANA DIALYSIS CENTER (1405 W PARK STREET)
Airports and heliports located in Urbana: University Of Illinois-Willard Airport (CMI) Runways: , Commercial Ops: 92, Air Taxi Ops: 13,620, Itinerant Ops: 10,720, Local Ops: 29,868, Military Ops: 353)Frasca Field Airport (C16) Runways: , Air Taxi Ops: 1,500, Itinerant Ops: 4,000, Local Ops: 9,500)Day Aero-Place Airport (6IS0) Runways: Carle Hospital Heliport (IS96) County Emerg Svcs/Disaster Agcy Heliport (IS22) See details about Airports and heliports located in Urbana, IL Amtrak stations near Urbana: 2 miles: CHAMPAIGN-URBANA (CHAMPAIGN, 116 N. CHESTNUT ST.) Services: ticket office, partially wheelchair accessible, enclosed waiting area, public restrooms, public payphones, vending machines, call for car rental service, call for taxi service, intercity bus service, public transit connection.
15 miles: RANTOUL (RNATOUL, N. KENTUCKY ST.) Services: partially wheelchair accessible, enclosed waiting area, public restrooms, public payphones, free short-term parking, free long-term parking, call for taxi service.
Colleges/Universities in Urbana: Concept College of Cosmetology Full-time enrollment: 61; Location: 202 East University Street, suite H, I,& J; Private, for-profit; Website: conceptcollege.com)
University of Illinois University Administration Location: 364 Henry Administration Building, 506 S Wright Street; Public; Website: www.uillinois.edu; Offers Doctor's degree )
Colleges/universities with over 2000 students nearest to Urbana:
University of Illinois at Urbana-Champaign (about 2 miles; Champaign, IL ; Full-time enrollment: 47,528)
Parkland College (about 5 miles; Champaign, IL ; FT enrollment: 7,326)
Danville Area Community College (about 33 miles; Danville, IL ; FT enrollment: 2,229)
Richland Community College (about 40 miles; Decatur, IL ; FT enrollment: 2,434)
Eastern Illinois University (about 44 miles; Charleston, IL ; FT enrollment: 9,414)
Millikin University (about 45 miles; Decatur, IL ; FT enrollment: 2,419)
Lake Land College (about 48 miles; Mattoon, IL ; FT enrollment: 7,499)
Public high schools in Urbana:
Private high schools in Urbana: CIRCLE ACADEMY Students: 59, Location: 1204 N DIVISION AVE, Grades: 2-12)
CALVARY BAPTIST CHRISTIAN ACADEMY Students: 44, Location: 2106 E WINDSOR LN, Grades: KG-12)
KINGSWOOD SCHOOL Students: 10, Location: 2111 WILLOW RD, Grades: 3-12)
Public elementary/middle schools in Urbana: URBANA MIDDLE SCHOOL Students: 817, Location: 1201 S VINE ST, Grades: 6-8)LEAL ELEM SCHOOL Students: 379, Location: 312 W OREGON ST, Grades: KG-5)YANKEE RIDGE ELEM SCHOOL Students: 292, Location: 2102 S ANDERSON ST, Grades: KG-5)THOMAS PAINE ELEM SCHOOL Students: 276, Location: 1801 JAMES CHERRY DR, Grades: KG-5)M L KING JR ELEM SCHOOL Students: 271, Location: 1108 FAIRVIEW AVE, Grades: KG-5)WILEY ELEMENTARY SCHOOL Students: 256, Location: 1602 S ANDERSON ST, Grades: KG-5)PRAIRIE ELEM SCHOOL Location: 2102 E WASHINGTON ST, Grades: KG-5)
Private elementary/middle schools in Urbana: CANAAN ACADEMY Students: 47, Location: 207 N CENTRAL AVE, Grades: PK-5)
CAMPUS MIDDLE SCHOOL FOR GIRLS Students: 29, Location: 1203 W GREEN ST, Grades: 6-8, Girls only )
See full list of schools located in Urbana Library in Urbana: URBANA FREE LIBRARY Operating income: $2,910,787; Location: 210 WEST GREEN STREET; 246,444 books ; 23,685 audio materials ; 17,434 video materials ; 24 local licensed databases ; 20 state licensed databases ; 5 other licensed databases ; 1,079 print serial subscriptions ; 103 electronic serial subscriptions )
Notable locations in Urbana: (A) , Frasca Field Industrial Park (B) , North Lincoln Industrial Park (C) , Illinois Field (D) , Wood Engineering Laboratory (E) , Wardall Hall (F) , Turner Hall (G) , Trelease Hall (H) , Townsend Hall (I) , Temple Hoyne-Buell Hall (J) , Talbot Laboratory (K) , Smith Hall (L) , Saunders Hall (M) , Roger Adams Laboratory (N) , Oglesby Hall (O) , Noyes Laboratory (P) , Newmark Laboratory (Q) , Mumford Hall (R) , Morrill Hall (S) , Madigan Laboratory (T) . Display/hide their locations on the map
Main business address in Urbana: (A) . Display/hide its location on the map
Cemeteries: (1) , East Lawn Cemetery (2) . Display/hide their locations on the map
Parks in Urbana include: (1) , Carle Park (2) , Wheat Field (3) , Prairie Park (4) , Patterson Parklet (5) , King Park (6) , Victory Park (7) , Woodland Park (8) , Lea Park (9) . Display/hide their locations on the map
Tourist attractions:
Hotels:
Birthplace of: Dan Graham - Conceptual artist, Roger Ebert - Film critic, Ward Churchill - Political activist, Jennie Garth - Actress, Nina Paley - Artist, Otto J. M. Smith - Professor of electrical engineering, Ella Masar - Association footballer, Eugie Foster - Short story writer, Jonathan Kuck - Speed skater, Larry Allen Abshier - Soldier.
Champaign County has a predicted average indoor radon screening level greater than 4 pCi/L (pico curies per liter) - Highest Potential Drinking water stations with addresses in Urbana and their reported violations in the past:
COUNTRY VIEW ESTS MHP (Population served: 97, Groundwater):
Past monitoring violations:
One regular monitoring violation
Drinking water stations with addresses in Urbana that have no violations reported:
EHLERS MHP (Population served: 112, Primary Water Source Type: Groundwater)
Average household size: This city:
2.0 peopleIllinois:
2.6 people
Percentage of family households: This city:
37.3%Whole state:
65.8%
Percentage of households with unmarried partners: This city:
5.5%Whole state:
6.3%
Likely homosexual households (counted as self-reported same-sex unmarried-partner households)
Lesbian couples: 0.3% of all households Gay men: 0.3% of all households
People in group quarters in Urbana in 2010:
6,217 people in college/university student housing
339 people in nursing facilities/skilled-nursing facilities
235 people in local jails and other municipal confinement facilities
143 people in hospitals with patients who have no usual home elsewhere
39 people in residential treatment centers for juveniles (non-correctional)
24 people in other noninstitutional facilities
21 people in group homes intended for adults
15 people in group homes for juveniles (non-correctional)
10 people in correctional facilities intended for juveniles
7 people in residential treatment centers for adults
People in group quarters in Urbana in 2000:
5,070 people in college dormitories (includes college quarters off campus)
400 people in nursing homes
107 people in state prisons
106 people in local jails and other confinement facilities (including police lockups)
34 people in other noninstitutional group quarters
8 people in homes or halfway houses for drug/alcohol abuse
5 people in other workers' dormitories
4 people in wards in general hospitals for patients who have no usual home elsewhere
Banks with most branches in Urbana (2011 data):
Busey Bank: Clark-Lindsey Village Branch, Canterbury Ridge Branch, Main Street Urbana Branch, Pines Branch. Info updated 2010/01/25: Bank assets: $3,345.6 mil, Deposits: $2,767.4 mil, headquarters in Champaign, IL, positive income , Commercial Lending Specialization, 49 total offices , Holding Company: First Busey Corporation
First Financial Bank, National Association: North Broadway Branch at 410 North Broadway, branch established on 2007/11/05; Philo Road Branch at 2510 South Philo Road, branch established on 2007/11/05. Info updated 2012/01/04: Bank assets: $2,852.7 mil, Deposits: $2,227.7 mil, headquarters in Terre Haute, IN, positive income , Commercial Lending Specialization, 66 total offices , Holding Company: First Financial Corporation
Heartland Bank and Trust Company: Philo Road Branch at 1812 South Philo Road, branch established on 2009/05/11; Vine Street Branch at 602 South Vine Street, branch established on 2007/10/16. Info updated 2011/08/08: Bank assets: $1,943.8 mil, Deposits: $1,632.9 mil, headquarters in Bloomington, IL, positive income , Commercial Lending Specialization, 49 total offices , Holding Company: Heartland Bancorp, Inc.
FIRST MID-ILLINOIS BANK & TRUST, NATIONAL ASSOCIATION: Urbana Branch at 601 South Vine, branch established on 1887/01/01. Info updated 2010/09/16: Bank assets: $1,492.8 mil, Deposits: $1,192.9 mil, headquarters in Mattoon, IL, positive income , Commercial Lending Specialization, 37 total offices , Holding Company: First Mid-Illinois Bancshares, Inc.
CIBM Bank: Urbana Branch at 1514 North Cunningham, branch established on 1994/04/01. Info updated 2010/08/18: Bank assets: $500.2 mil, Deposits: $431.1 mil, headquarters in Champaign, IL, negative income in the last year , Commercial Lending Specialization, 14 total offices , Holding Company: Cib Marine Bancshares, Inc.
First Federal Savings Bank of Champaign Urbana: Urbana Branch at 301 W. Springfield Avenue, branch established on 1990/03/01. Info updated 2011/07/21: Bank assets: $160.2 mil, Deposits: $137.9 mil, headquarters in Champaign, IL, positive income , Commercial Lending Specialization, 3 total offices
JPMorgan Chase Bank, National Association: Urbana Downtown Branch at 405 North Broadway, branch established on 1986/08/11. Info updated 2011/11/10: Bank assets: $1,811,678.0 mil, Deposits: $1,190,738.0 mil, headquarters in Columbus, OH, positive income , International Specialization, 5577 total offices , Holding Company: Jpmorgan Chase & Co.
Woodforest National Bank: Urbana Illinois Branch at 100 South High Cross Road, branch established on 2007/07/28. Info updated 2011/05/10: Bank assets: $3,488.9 mil, Deposits: $3,097.6 mil, headquarters in Houston, TX, positive income , Commercial Lending Specialization, 766 total offices , Holding Company: Woodforest Financial Group Employee Stock Ownership Plan (With 401(K) Provisions)
PNC Bank, National Association: Urbana Branch at 507 South Broadway, branch established on 1888/01/01. Info updated 2012/03/20: Bank assets: $263,309.6 mil, Deposits: $197,343.0 mil, headquarters in Wilmington, DE, positive income , Commercial Lending Specialization, 3085 total offices , Holding Company: Pnc Financial Services Group, Inc., The
For population 15 years and over in Urbana:
Never married: 61.8%Now married: 28.8%Separated: 0.7%Widowed: 3.5%Divorced: 5.1% For population 25 years and over in Urbana:
High school or higher: 95.9%Bachelor's degree or higher: 58.4%Graduate or professional degree: 35.0%Unemployed: 6.5%Mean travel time to work (commute): 11.3 minutes
Education Gini index (Inequality in education) Here:
12.1Illinois average:
12.5
Religion statistics for Urbana, IL (based on Champaign County data)
Religion Adherents Congregations Evangelical Protestant 28,618 111 Mainline Protestant 16,652 54 Catholic 15,215 17 Other 6,441 20 Black Protestant 1,451 7 Orthodox 595 2 None 132,109 -
Source: Clifford Grammich, Kirk Hadaway, Richard Houseal, Dale E.Jones, Alexei Krindatch, Richie Stanley and Richard H.Taylor. 2012. 2010 U.S.Religion Census: Religious Congregations & Membership Study. Association of Statisticians of American Religious Bodies. Jones, Dale E., et al. 2002. Congregations and Membership in the United States 2000. Nashville, TN: Glenmary Research Center. Graphs represent county-level data
Food Environment Statistics: Number of grocery stores : 33Here :
1.71 / 10,000 pop.Illinois :
2.24 / 10,000 pop.
Number of supercenters and club stores : 3This county :
0.16 / 10,000 pop.State :
0.08 / 10,000 pop.
Number of convenience stores (no gas) : 8Champaign County :
0.41 / 10,000 pop.State :
0.75 / 10,000 pop.
Number of convenience stores (with gas) : 67This county :
3.47 / 10,000 pop.Illinois :
2.61 / 10,000 pop.
Number of full-service restaurants : 154Champaign County :
7.98 / 10,000 pop.Illinois :
6.86 / 10,000 pop.
Adult diabetes rate : Champaign County :
7.9%Illinois :
8.3%
Low-income preschool obesity rate : Health and Nutrition:
Average overall health of teeth and gums : This city:
56.6%State:
47.2%
People feeling badly about themselves : Urbana:
16.6%Illinois:
20.5%
People not drinking alcohol at all : Average hours sleeping at night : General health condition : This city:
63.7%State:
56.4%
Average condition of hearing : Urbana:
84.2%Illinois:
79.9%
More about Health and Nutrition of Urbana, IL Residents
Local government employment and payroll (March 2022)
Function
Full-time employees
Monthly full-time payroll
Average yearly full-time wage
Part-time employees
Monthly part-time payroll
Firefighters
59 $380,691 $77,429 0 $0 Police Protection - Officers
58 $491,826 $101,757 0 $0 Streets and Highways
28 $170,254 $72,966 2 $5,077 Other and Unallocable
24 $109,410 $54,705 5 $6,625 Financial Administration
17 $111,950 $79,024 4 $7,081 Other Government Administration
14 $95,073 $81,491 0 $0 Police - Other
13 $61,659 $56,916 0 $0 Housing and Community Development (Local)
8 $43,812 $65,718 2 $3,386 Fire - Other
7 $61,449 $105,341 0 $0 Natural Resources
6 $29,922 $59,844 0 $0 Sewerage
4 $20,786 $62,358 0 $0 Solid Waste Management
2 $12,599 $75,594 0 $0 Judicial and Legal
2 $14,338 $86,028 1 $2,100 Health
1 $4,947 $59,364 0 $0
Totals for Government
243 $1,608,714 $79,443 14 $24,269
Urbana government finances - Expenditure in 2021 (per resident):
Construction - Central Staff Services: $10,222,000 ($265.73)
Parking Facilities: $674,000 ($17.52)Regular Highways: $562,000 ($14.61)Current Operations - Police Protection: $10,735,000 ($279.06)
Local Fire Protection: $8,888,000 ($231.05)Regular Highways: $6,751,000 ($175.50)Housing and Community Development: $4,537,000 ($117.94)Libraries: $4,305,000 ($111.91)Central Staff Services: $2,839,000 ($73.80)Financial Administration: $2,028,000 ($52.72)Parking Facilities: $352,000 ($9.15)General - Other: $166,000 ($4.32)General - Interest on Debt: $50,000 ($1.30)
Intergovernmental to Local - Other - General - Other: $223,000 ($5.80)
Other Capital Outlay - Central Staff Services: $92,065,000 ($2393.29)
Libraries: $8,226,000 ($213.84)Parking Facilities: $5,047,000 ($131.20)Total Salaries and Wages: $19,214,000 ($499.48)
Urbana government finances - Revenue in 2021 (per resident):
Charges - Other: $5,946,000 ($154.57)
Solid Waste Management: $1,468,000 ($38.16)Parking Facilities: $983,000 ($25.55)Housing and Community Development: $272,000 ($7.07)Parks and Recreation: $106,000 ($2.76)Federal Intergovernmental - Housing and Community Development: $2,023,000 ($52.59)
Other: $1,773,000 ($46.09)Local Intergovernmental - Other: $748,000 ($19.44)
Miscellaneous - General Revenue - Other: $2,283,000 ($59.35)
Fines and Forfeits: $349,000 ($9.07)Interest Earnings: $62,000 ($1.61)State Intergovernmental - General Local Government Support: $14,356,000 ($373.19)
Highways: $3,025,000 ($78.64)Housing and Community Development: $115,000 ($2.99)Other: $81,000 ($2.11)Tax - Property: $12,407,000 ($322.53)
General Sales and Gross Receipts: $7,144,000 ($185.71)Public Utilities Sales: $3,187,000 ($82.85)Other Selective Sales: $2,256,000 ($58.65)Other License: $958,000 ($24.90)
Urbana government finances - Debt in 2021 (per resident):
Long Term Debt - Beginning Outstanding - Unspecified Public Purpose: $3,265,000 ($84.88)
Outstanding Unspecified Public Purpose: $2,063,000 ($53.63)Retired Unspecified Public Purpose: $1,203,000 ($31.27)Beginning Outstanding - Public Debt for Private Purpose: $926,000 ($24.07)Retired Nonguaranteed - Public Debt for Private Purpose: $926,000 ($24.07)
Urbana government finances - Cash and Securities in 2021 (per resident):
Other Funds - Cash and Securities: $62,112,000 ($1614.64)
Businesses in Urbana, IL
Name Count Name Count
ALDI 1 Mazda 1 Advance Auto Parts 1 McDonald's 2 Arby's 1 Meijer 1 AutoZone 1 Motel 6 1 Baskin-Robbins 1 New Balance 1 Blockbuster 1 Nike 1 Burger King 1 Papa John's Pizza 1 CVS 1 Penske 1 Chick-Fil-A 1 Quiznos 1 Circle K 6 RadioShack 1 Comfort Suites 1 Ramada 1 Cracker Barrel 1 Ryder Rental & Truck Leasing 1 Curves 1 SAS Shoes 1 DHL 1 Sleep Inn 1 Dairy Queen 1 Sprint Nextel 2 Domino's Pizza 1 Starbucks 1 Dunkin Donuts 1 Steak 'n Shake 1 FedEx 5 Subway 5 H&R Block 1 Super 8 1 Hilton 1 T-Mobile 1 Holiday Inn 2 Taco Bell 1 Hyundai 1 Toyota 1 Jamba Juice 1 U-Haul 4 Jimmy Jazz 1 UPS 11 Jimmy John's 2 Verizon Wireless 1 Jones New York 1 Volkswagen 1 KFC 1 Walgreens 2 Lane Furniture 1 Walmart 1 Little Caesars Pizza 1
Strongest AM radio stations in Urbana:
WILL (580 AM; 5 kW; URBANA, IL; Owner: UNIV. OF ILLINOIS BOARD OF TRUSTEES)
WDWS (1400 AM; 1 kW; CHAMPAIGN, IL; Owner: D.W.S., INC.)
WBCP (1580 AM; 0 kW; URBANA, IL)
WLS (890 AM; 50 kW; CHICAGO, IL; Owner: WLS, INC.)
WIBC (1070 AM; 50 kW; INDIANAPOLIS, IN; Owner: EMMIS RADIO LICENSE CORPORATION)
WSCR (670 AM; 50 kW; CHICAGO, IL; Owner: INFINITY BROADCASTING OPERATIONS, INC.)
WYLL (1160 AM; 50 kW; CHICAGO, IL; Owner: SCA LICENSE CORPORATION)
WGN (720 AM; 50 kW; CHICAGO, IL; Owner: WGN CONTINENTAL BROADCASTING CO.)
WBBM (780 AM; 50 kW; CHICAGO, IL; Owner: INFINITY BROADCASTING OPERATIONS, INC.)
WMVP (1000 AM; 50 kW; CHICAGO, IL; Owner: ABC, INC.)
KXEN (1010 AM; 50 kW; FESTUS-ST. LOUIS, MO; Owner: BDJ RADIO ENTERPRISES, LLC)
WLBH (1170 AM; daytime; 5 kW; MATTOON, IL; Owner: MATTOON BROADCASTING COMPANY)
KMOX (1120 AM; 50 kW; ST. LOUIS, MO; Owner: INFINITY BROADCASTING OPERATIONS, INC.)
Strongest FM radio stations in Urbana:
WPGU (107.1 FM; URBANA, IL; Owner: ILLINI MEDIA COMPANY)
WHMS-FM (97.5 FM; CHAMPAIGN, IL; Owner: D.W.S., INC.)
WLRW (94.5 FM; CHAMPAIGN, IL; Owner: SAGA COMMUNICATIONS OF ILLINOIS, LLC)
WBGL (91.7 FM; CHAMPAIGN, IL; Owner: ILLINOIS BIBLE INSTITUTE,INC)
WPCD (88.7 FM; CHAMPAIGN, IL; Owner: PARKLAND COLLEGE)
WKIO (92.5 FM; URBANA, IL; Owner: SAGA COMMUNICATIONS OF ILLINOIS, LLC)
WIXY (100.3 FM; CHAMPAIGN, IL; Owner: SAGA COMMUNICATIONS OF ILLINOIS, LLC)
W266AF (101.1 FM; URBANA, IL; Owner: THE BD OF TRUSTEES OF UNIV. OF IL)
WGKC (105.9 FM; MAHOMET, IL; Owner: AAA ENTERTAINMENT LICENSING LLC)
WQQB (96.1 FM; RANTOUL, IL; Owner: AAA ENTERTAINMENT LICENSING LLC)
WEVX (95.3 FM; RANTOUL, IL; Owner: AAA ENTERTAINMENT LICENSING LLC)
WEFT (90.1 FM; CHAMPAIGN, IL; Owner: WEFT/PRAIRIE AIR, INC.)
WGNJ (89.3 FM; ST. JOSEPH, IL; Owner: GOOD NEWS RADIO, INC.)
WILL-FM (90.9 FM; URBANA, IL; Owner: UNIV. OF ILLINOIS BOARD OF TRUSTEES)
WEBX (93.5 FM; TUSCOLA, IL; Owner: AAA ENTERTAINMENT LICENSING LLC)
WXLS (99.1 FM; DANVILLE, IL; Owner: I.A.I. BROADCASTING, INC.)
WGNN (102.5 FM; FISHER, IL; Owner: GOOD NEWS RADIO, INC)
WWHP (98.3 FM; FARMER CITY, IL; Owner: WMS1, INC.)
WCZQ (105.5 FM; MONTICELLO, IL; Owner: NM LICENSING, LLC)
WPXN (104.9 FM; PAXTON, IL; Owner: PAXTON BROADCASTING CORPORATION)
TV broadcast stations around Urbana:
W32CM (Channel 32; CHAMPAIGN, IL; Owner: VENTANA TELEVISION, INC.)
WBXC-CA (Channel 46; CHAMPAIGN/URBANA, IL; Owner: THE BOX WORLDWIDE LLC)
W52BR (Channel 52; CHAMPAIGN-URBANA, IL; Owner: MARCIA COHEN)
WCIA (Channel 3; CHAMPAIGN, IL; Owner: NEXSTAR BROADCASTING OF CHAMPAIGN, L.L.C.)
W58DA (Channel 58; CHAMPAIGN, IL; Owner: TRINITY BROADCASTING NETWORK)
W07DD (Channel 7; CHAMPAIGN, IL; Owner: THREE ANGELS BROADCASTING NETWORK)
WICD (Channel 15; CHAMPAIGN, IL; Owner: WICD LICENSEE, LLC)
WILL-TV (Channel 12; URBANA, IL; Owner: UNIV. OF ILLINOIS BD. OF TRUSTEES)
WBUI (Channel 23; DECATUR, IL; Owner: ACME TV LICENSES OF ILLINOIS, LLC)
W34CD (Channel 34; QUINCY, IL; Owner: MS COMMUNICATIONS, LLC)
WAND (Channel 17; DECATUR, IL; Owner: WAND(TV) PARTNERSHIP)
WCCU (Channel 27; URBANA, IL; Owner: URBANA-CHAMPAIGN BROADCASTING PARTNERS)
National Bridge Inventory (NBI) Statistics 56 Number of bridges476ft / 145m Total length $2,093,000 Total costs637,375 Total average daily traffic118,614 Total average daily truck traffic
New bridges - historical statistics
5 1900-1909 2 1930-1939 9 1950-1959 13 1960-1969 7 1970-1979 8 1980-1989 3 1990-1999 3 2000-2009 6 2010-2019
See full National Bridge Inventory statistics for Urbana, IL
Home Mortgage Disclosure Act Aggregated Statistics For Year 2009(Based on 4 full and 6 partial tracts) A) FHA, FSA/RHS & VA B) Conventional C) Refinancings D) Home Improvement Loans E) Loans on Dwellings For 5+ Families F) Non-occupant Loans on G) Loans On Manufactured Number Average Value Number Average Value Number Average Value Number Average Value Number Average Value Number Average Value Number Average Value
LOANS ORIGINATED 38 $118,379 122 $108,360 308 $144,091 18 $44,206 21 $682,429 82 $123,304 2 $16,645 APPLICATIONS APPROVED, NOT ACCEPTED 1 $78,020 9 $105,908 30 $137,934 1 $34,610 0 $0 5 $115,828 1 $36,390 APPLICATIONS DENIED 3 $109,437 14 $84,144 42 $129,416 8 $64,188 0 $0 14 $109,821 3 $36,023 APPLICATIONS WITHDRAWN 3 $95,570 9 $133,523 34 $135,614 1 $94,210 0 $0 4 $144,762 1 $29,280 FILES CLOSED FOR INCOMPLETENESS 1 $187,740 2 $80,300 8 $131,406 2 $19,100 0 $0 1 $223,020 0 $0
Aggregated Statistics For Year 2008(Based on 4 full and 6 partial tracts) A) FHA, FSA/RHS & VA B) Conventional C) Refinancings D) Home Improvement Loans E) Loans on Dwellings For 5+ Families F) Non-occupant Loans on G) Loans On Manufactured Number Average Value Number Average Value Number Average Value Number Average Value Number Average Value Number Average Value Number Average Value
LOANS ORIGINATED 27 $115,869 178 $118,289 134 $130,629 34 $37,323 30 $718,520 111 $121,634 4 $31,065 APPLICATIONS APPROVED, NOT ACCEPTED 1 $82,850 10 $122,019 16 $114,166 3 $30,057 2 $1,377,470 3 $181,217 1 $57,190 APPLICATIONS DENIED 6 $104,348 16 $83,474 40 $123,693 14 $52,610 2 $477,800 15 $132,937 3 $38,590 APPLICATIONS WITHDRAWN 3 $106,543 10 $127,927 18 $139,649 3 $122,453 0 $0 7 $149,143 0 $0 FILES CLOSED FOR INCOMPLETENESS 0 $0 0 $0 2 $153,685 0 $0 0 $0 1 $180,000 0 $0
Aggregated Statistics For Year 2007(Based on 3 full and 6 partial tracts) A) FHA, FSA/RHS & VA B) Conventional C) Refinancings D) Home Improvement Loans E) Loans on Dwellings For 5+ Families F) Non-occupant Loans on G) Loans On Manufactured Number Average Value Number Average Value Number Average Value Number Average Value Number Average Value Number Average Value Number Average Value
LOANS ORIGINATED 8 $124,571 248 $118,446 128 $104,861 42 $46,226 13 $1,438,066 104 $115,506 4 $47,260 APPLICATIONS APPROVED, NOT ACCEPTED 0 $0 17 $116,738 14 $103,503 3 $39,133 0 $0 8 $94,322 3 $55,067 APPLICATIONS DENIED 3 $121,643 25 $101,758 62 $116,646 21 $58,000 0 $0 14 $117,669 4 $54,828 APPLICATIONS WITHDRAWN 1 $71,090 14 $140,511 27 $104,800 3 $66,917 0 $0 4 $89,595 0 $0 FILES CLOSED FOR INCOMPLETENESS 0 $0 5 $89,462 8 $111,538 1 $269,380 0 $0 1 $256,940 0 $0
Aggregated Statistics For Year 2006(Based on 4 full and 6 partial tracts) A) FHA, FSA/RHS & VA B) Conventional C) Refinancings D) Home Improvement Loans E) Loans on Dwellings For 5+ Families F) Non-occupant Loans on G) Loans On Manufactured Number Average Value Number Average Value Number Average Value Number Average Value Number Average Value Number Average Value Number Average Value
LOANS ORIGINATED 18 $121,676 339 $105,132 139 $91,727 53 $45,945 30 $1,827,279 162 $92,825 6 $45,528 APPLICATIONS APPROVED, NOT ACCEPTED 2 $114,490 44 $88,740 23 $95,015 3 $30,273 0 $0 27 $87,353 5 $55,454 APPLICATIONS DENIED 0 $0 64 $97,850 76 $107,531 23 $79,414 1 $316,290 64 $92,500 4 $33,450 APPLICATIONS WITHDRAWN 1 $77,710 39 $111,269 46 $121,727 3 $154,067 2 $382,575 21 $104,696 1 $70,720 FILES CLOSED FOR INCOMPLETENESS 0 $0 4 $75,288 7 $111,473 1 $42,840 0 $0 1 $95,890 0 $0
Aggregated Statistics For Year 2005(Based on 4 full and 6 partial tracts) A) FHA, FSA/RHS & VA B) Conventional C) Refinancings D) Home Improvement Loans E) Loans on Dwellings For 5+ Families F) Non-occupant Loans on G) Loans On Manufactured Number Average Value Number Average Value Number Average Value Number Average Value Number Average Value Number Average Value Number Average Value
LOANS ORIGINATED 18 $110,043 272 $105,216 161 $112,503 48 $42,546 9 $559,227 96 $110,161 8 $35,130 APPLICATIONS APPROVED, NOT ACCEPTED 2 $75,225 22 $90,045 23 $92,570 3 $62,603 0 $0 9 $80,918 2 $38,150 APPLICATIONS DENIED 2 $41,050 37 $73,871 78 $85,277 13 $38,254 0 $0 10 $64,315 10 $45,087 APPLICATIONS WITHDRAWN 1 $96,660 19 $108,535 39 $108,351 6 $144,733 2 $1,779,930 4 $108,002 0 $0 FILES CLOSED FOR INCOMPLETENESS 0 $0 5 $105,162 10 $90,346 0 $0 0 $0 2 $56,315 0 $0
Aggregated Statistics For Year 2004(Based on 4 full and 6 partial tracts) A) FHA, FSA/RHS & VA B) Conventional C) Refinancings D) Home Improvement Loans E) Loans on Dwellings For 5+ Families F) Non-occupant Loans on G) Loans On Manufactured Number Average Value Number Average Value Number Average Value Number Average Value Number Average Value Number Average Value Number Average Value
LOANS ORIGINATED 27 $97,553 241 $106,381 186 $95,096 44 $45,062 37 $869,597 92 $90,703 6 $33,460 APPLICATIONS APPROVED, NOT ACCEPTED 2 $133,185 20 $83,521 20 $79,186 2 $19,415 0 $0 3 $82,990 7 $28,203 APPLICATIONS DENIED 1 $101,640 31 $90,725 74 $82,123 23 $23,144 0 $0 7 $73,489 11 $35,105 APPLICATIONS WITHDRAWN 1 $75,870 15 $113,183 35 $92,593 2 $59,770 0 $0 1 $249,570 0 $0 FILES CLOSED FOR INCOMPLETENESS 0 $0 2 $154,010 12 $117,141 1 $28,540 0 $0 0 $0 0 $0
Aggregated Statistics For Year 2003(Based on 4 full and 6 partial tracts) A) FHA, FSA/RHS & VA B) Conventional C) Refinancings D) Home Improvement Loans E) Loans on Dwellings For 5+ Families F) Non-occupant Loans on Number Average Value Number Average Value Number Average Value Number Average Value Number Average Value Number Average Value
LOANS ORIGINATED 24 $97,475 225 $98,523 549 $95,924 32 $28,791 12 $1,417,235 116 $74,740 APPLICATIONS APPROVED, NOT ACCEPTED 0 $0 10 $97,702 39 $94,848 3 $40,807 0 $0 5 $109,328 APPLICATIONS DENIED 3 $75,990 18 $84,039 93 $87,269 15 $26,211 1 $232,170 7 $70,554 APPLICATIONS WITHDRAWN 0 $0 16 $89,521 40 $92,690 3 $50,023 0 $0 10 $69,192 FILES CLOSED FOR INCOMPLETENESS 0 $0 5 $84,960 8 $77,206 0 $0 0 $0 2 $21,645
Aggregated Statistics For Year 2002(Based on 4 full and 6 partial tracts) A) FHA, FSA/RHS & VA B) Conventional C) Refinancings D) Home Improvement Loans E) Loans on Dwellings For 5+ Families F) Non-occupant Loans on Number Average Value Number Average Value Number Average Value Number Average Value Number Average Value Number Average Value
LOANS ORIGINATED 31 $85,884 208 $92,659 372 $93,788 50 $31,290 20 $696,520 96 $75,917 APPLICATIONS APPROVED, NOT ACCEPTED 2 $55,075 15 $84,618 27 $67,868 1 $19,250 0 $0 2 $100,360 APPLICATIONS DENIED 2 $62,280 21 $43,679 57 $80,895 17 $20,734 0 $0 7 $59,541 APPLICATIONS WITHDRAWN 2 $76,840 9 $70,071 33 $77,459 4 $51,918 0 $0 4 $55,492 FILES CLOSED FOR INCOMPLETENESS 0 $0 2 $69,965 9 $100,674 3 $56,363 0 $0 2 $52,250
Aggregated Statistics For Year 2001(Based on 4 full and 6 partial tracts) A) FHA, FSA/RHS & VA B) Conventional C) Refinancings D) Home Improvement Loans E) Loans on Dwellings For 5+ Families F) Non-occupant Loans on Number Average Value Number Average Value Number Average Value Number Average Value Number Average Value Number Average Value
LOANS ORIGINATED 23 $80,359 179 $88,569 267 $94,541 59 $32,832 20 $407,087 63 $75,649 APPLICATIONS APPROVED, NOT ACCEPTED 1 $59,060 9 $59,663 23 $63,627 6 $24,468 0 $0 2 $41,865 APPLICATIONS DENIED 2 $69,075 28 $53,097 80 $54,466 18 $13,913 0 $0 5 $62,232 APPLICATIONS WITHDRAWN 4 $74,560 8 $81,501 36 $71,159 4 $14,310 0 $0 4 $53,555 FILES CLOSED FOR INCOMPLETENESS 0 $0 0 $0 7 $89,966 1 $38,880 0 $0 0 $0
Aggregated Statistics For Year 2000(Based on 4 full and 6 partial tracts) A) FHA, FSA/RHS & VA B) Conventional C) Refinancings D) Home Improvement Loans E) Loans on Dwellings For 5+ Families F) Non-occupant Loans on Number Average Value Number Average Value Number Average Value Number Average Value Number Average Value Number Average Value
LOANS ORIGINATED 25 $74,798 191 $82,716 71 $78,672 46 $16,285 14 $590,007 43 $65,416 APPLICATIONS APPROVED, NOT ACCEPTED 2 $70,695 10 $47,649 15 $49,888 6 $16,240 0 $0 3 $31,767 APPLICATIONS DENIED 1 $91,120 37 $32,874 46 $49,746 17 $19,165 2 $2,599,565 2 $31,380 APPLICATIONS WITHDRAWN 2 $70,155 9 $73,197 34 $53,916 7 $29,591 1 $94,000 5 $69,580 FILES CLOSED FOR INCOMPLETENESS 0 $0 1 $28,930 3 $83,520 1 $16,960 0 $0 1 $55,220
Aggregated Statistics For Year 1999(Based on 4 full and 6 partial tracts) A) FHA, FSA/RHS & VA B) Conventional C) Refinancings D) Home Improvement Loans E) Loans on Dwellings For 5+ Families F) Non-occupant Loans on Number Average Value Number Average Value Number Average Value Number Average Value Number Average Value Number Average Value
LOANS ORIGINATED 45 $70,059 167 $80,314 189 $75,597 78 $11,503 15 $346,326 59 $65,319 APPLICATIONS APPROVED, NOT ACCEPTED 2 $125,805 15 $53,254 29 $52,426 5 $12,432 1 $71,430 1 $66,910 APPLICATIONS DENIED 3 $50,077 41 $39,303 69 $53,626 25 $12,906 0 $0 14 $46,303 APPLICATIONS WITHDRAWN 1 $86,130 12 $72,902 39 $46,140 11 $22,060 0 $0 8 $50,068 FILES CLOSED FOR INCOMPLETENESS 2 $41,500 2 $85,795 15 $61,743 0 $0 0 $0 0 $0
Detailed mortgage data for all 10 tracts in Urbana, IL
Private Mortgage Insurance Companies Aggregated Statistics For Year 2009(Based on 2 full and 5 partial tracts) A) Conventional B) Refinancings C) Non-occupant Loans on Number Average Value Number Average Value Number Average Value
LOANS ORIGINATED 16 $123,448 13 $136,721 1 $52,370 APPLICATIONS APPROVED, NOT ACCEPTED 2 $179,075 3 $131,700 0 $0 APPLICATIONS DENIED 1 $82,340 2 $101,390 0 $0 APPLICATIONS WITHDRAWN 0 $0 0 $0 0 $0 FILES CLOSED FOR INCOMPLETENESS 0 $0 0 $0 0 $0
Aggregated Statistics For Year 2008(Based on 2 full and 5 partial tracts) A) Conventional B) Refinancings C) Non-occupant Loans on Number Average Value Number Average Value Number Average Value
LOANS ORIGINATED 32 $122,350 11 $153,000 9 $93,540 APPLICATIONS APPROVED, NOT ACCEPTED 6 $143,348 3 $148,280 2 $77,895 APPLICATIONS DENIED 6 $130,463 2 $115,565 2 $73,705 APPLICATIONS WITHDRAWN 5 $137,616 1 $70,980 3 $95,000 FILES CLOSED FOR INCOMPLETENESS 0 $0 0 $0 0 $0
Aggregated Statistics For Year 2007(Based on 2 full and 6 partial tracts) A) Conventional B) Refinancings C) Non-occupant Loans on Number Average Value Number Average Value Number Average Value
LOANS ORIGINATED 50 $112,095 10 $126,678 5 $87,446 APPLICATIONS APPROVED, NOT ACCEPTED 7 $137,389 1 $139,410 2 $175,130 APPLICATIONS DENIED 2 $129,325 0 $0 2 $115,270 APPLICATIONS WITHDRAWN 1 $179,860 0 $0 0 $0 FILES CLOSED FOR INCOMPLETENESS 0 $0 0 $0 0 $0
Aggregated Statistics For Year 2006(Based on 3 full and 6 partial tracts) A) Conventional B) Refinancings C) Non-occupant Loans on Number Average Value Number Average Value Number Average Value
LOANS ORIGINATED 30 $110,452 7 $130,070 4 $151,340 APPLICATIONS APPROVED, NOT ACCEPTED 6 $133,895 3 $96,273 2 $85,215 APPLICATIONS DENIED 9 $145,803 0 $0 9 $145,803 APPLICATIONS WITHDRAWN 3 $88,653 0 $0 2 $85,510 FILES CLOSED FOR INCOMPLETENESS 1 $166,000 0 $0 0 $0
Aggregated Statistics For Year 2005(Based on 2 full and 5 partial tracts) A) Conventional B) Refinancings C) Non-occupant Loans on Number Average Value Number Average Value Number Average Value
LOANS ORIGINATED 41 $117,675 9 $115,120 4 $67,218 APPLICATIONS APPROVED, NOT ACCEPTED 6 $106,573 3 $112,880 1 $75,000 APPLICATIONS DENIED 1 $63,900 0 $0 1 $44,040 APPLICATIONS WITHDRAWN 2 $75,855 0 $0 0 $0 FILES CLOSED FOR INCOMPLETENESS 0 $0 0 $0 0 $0
Aggregated Statistics For Year 2004(Based on 2 full and 5 partial tracts) A) Conventional B) Refinancings C) Non-occupant Loans on Number Average Value Number Average Value Number Average Value
LOANS ORIGINATED 49 $107,504 12 $105,259 11 $81,736 APPLICATIONS APPROVED, NOT ACCEPTED 7 $107,260 3 $133,610 1 $87,720 APPLICATIONS DENIED 1 $44,060 0 $0 0 $0 APPLICATIONS WITHDRAWN 2 $81,600 2 $66,345 1 $103,060 FILES CLOSED FOR INCOMPLETENESS 0 $0 0 $0 0 $0
Aggregated Statistics For Year 2003(Based on 4 full and 5 partial tracts) A) Conventional B) Refinancings C) Non-occupant Loans on Number Average Value Number Average Value Number Average Value
LOANS ORIGINATED 49 $109,150 27 $111,656 13 $87,114 APPLICATIONS APPROVED, NOT ACCEPTED 9 $100,070 7 $92,849 2 $50,970 APPLICATIONS DENIED 0 $0 0 $0 0 $0 APPLICATIONS WITHDRAWN 2 $119,095 2 $75,880 2 $58,115 FILES CLOSED FOR INCOMPLETENESS 0 $0 0 $0 0 $0
Aggregated Statistics For Year 2002(Based on 3 full and 6 partial tracts) A) Conventional B) Refinancings C) Non-occupant Loans on Number Average Value Number Average Value Number Average Value
LOANS ORIGINATED 56 $96,111 22 $108,510 15 $81,305 APPLICATIONS APPROVED, NOT ACCEPTED 10 $87,775 3 $133,587 1 $35,370 APPLICATIONS DENIED 0 $0 0 $0 0 $0 APPLICATIONS WITHDRAWN 1 $97,280 2 $116,675 1 $21,120 FILES CLOSED FOR INCOMPLETENESS 0 $0 0 $0 0 $0
Aggregated Statistics For Year 2001(Based on 3 full and 5 partial tracts) A) Conventional B) Refinancings C) Non-occupant Loans on Number Average Value Number Average Value Number Average Value
LOANS ORIGINATED 45 $99,733 14 $97,079 10 $64,108 APPLICATIONS APPROVED, NOT ACCEPTED 8 $77,336 6 $109,983 2 $64,810 APPLICATIONS DENIED 1 $43,010 2 $128,870 1 $47,370 APPLICATIONS WITHDRAWN 1 $46,280 0 $0 1 $39,640 FILES CLOSED FOR INCOMPLETENESS 0 $0 0 $0 0 $0
Aggregated Statistics For Year 2000(Based on 3 full and 5 partial tracts) A) Conventional B) Refinancings C) Non-occupant Loans on Number Average Value Number Average Value Number Average Value
LOANS ORIGINATED 36 $84,636 5 $94,126 9 $76,756 APPLICATIONS APPROVED, NOT ACCEPTED 3 $120,910 2 $54,235 1 $66,000 APPLICATIONS DENIED 1 $23,160 1 $74,930 0 $0 APPLICATIONS WITHDRAWN 1 $55,410 0 $0 0 $0 FILES CLOSED FOR INCOMPLETENESS 0 $0 0 $0 0 $0
Aggregated Statistics For Year 1999(Based on 4 full and 6 partial tracts) A) Conventional B) Refinancings C) Non-occupant Loans on Number Average Value Number Average Value Number Average Value
LOANS ORIGINATED 44 $81,028 11 $88,385 6 $50,713 APPLICATIONS APPROVED, NOT ACCEPTED 5 $99,516 4 $77,052 0 $0 APPLICATIONS DENIED 3 $63,507 1 $183,390 2 $58,675 APPLICATIONS WITHDRAWN 1 $123,690 2 $60,895 0 $0 FILES CLOSED FOR INCOMPLETENESS 0 $0 0 $0 0 $0
Fire-safe hotels and motels in Urbana, Illinois:
Shurts House Bed & Breakfast, 710 W Oregon St, Urbana, Illinois 61801 Phone: (217) 367-8793
Motel 6 Urbana, 1906 N Cunningham Ave, Urbana, Illinois 61801 Phone: (217) 344-1082
Eastland Suites Hotel & Conference Center, 1907 N Cunningham Ave, Urbana, Illinois 61802 Phone: (217) 367-8331, Fax: (217) 384-3370
Ramada Ltd., 902 W Killarney St, Urbana, Illinois 61801 Phone: (217) 328-4400, Fax: (217) 328-6623
Wyndham Garden Urbana Champaign, 1001 W Killarney St, Urbana, Illinois 61801 Phone: (217) 328-7900, Fax: (217) 328-7941
Sleep Inn, 1908 N Lincoln, Urbana, Illinois 61801 Phone: (217) 367-6000, Fax: (217) 367-6000
Holiday Inn Express & Suites, 1003 Killarney St, Urbana, Illinois 61801 Phone: (217) 328-0328, Fax: (217) 328-7941
Historic Lincoln Hotel & Conference Center, 209 S Broadway, Urbana, Illinois 61801 Phone: (217) 384-8800, Fax: (217) 384-9001
2 other hotels and motels
All 10 fire-safe hotels and motels in Urbana, Illinois
Most common first names in Urbana, IL among deceased individuals Name Count Lived (average)
Mary 222 80.4 years John 193 75.4 years William 167 76.3 years Robert 158 71.8 years Charles 136 74.4 years James 126 73.6 years Ruth 113 81.7 years Helen 112 79.8 years Dorothy 99 80.4 years George 81 74.5 years
Most common last names in Urbana, IL among deceased individuals Last name Count Lived (average)
Smith 120 77.6 years Johnson 88 73.0 years Miller 70 75.2 years Wilson 60 77.3 years Williams 54 70.6 years Anderson 54 76.9 years Brown 52 77.2 years Jones 48 75.4 years Davis 40 76.7 years Taylor 39 75.4 years
Urbana compared to Illinois state average:
Median household income below state average. Unemployed percentage below state average. Hispanic race population percentage below state average. Median age significantly below state average. Renting percentage above state average. Length of stay since moving in significantly above state average. Number of rooms per house below state average. Number of college students significantly above state average. Percentage of population with a bachelor's degree or higher above state average.
#8 on the list of "Top 101 cities with the most recent year of entry for the foreign-born population (2,000+ people)+"
#8 on the list of "Top 101 cities where the highest percentage of females (15+ years) which never married (with at least 10,000 females in this group)"
#13 on the list of "Top 101 cities with largest percentage of males in occupations: education, training, and library occupations (population 5,000+)"
#13 on the list of "Top 101 cities where the highest percentage of males (15+ years) which never married (with at least 10,000 males in this group)"
#16 on the list of "Top 101 cities with largest percentage of males in industries: educational services (population 5,000+)"
#23 on the list of "Top 101 cities with largest percentage of females in industries: educational services (population 5,000+)"
#30 on the list of "Top 101 cities with the lowest percentage of family households, population 10,000+"
#55 on the list of "Top 101 cities with largest percentage of males in occupations: life, physical, and social science occupations (population 5,000+)"
#59 on the list of "Top 101 cities with the least people living the same house as 1 year ago (population 5,000+))"
#70 on the list of "Top 101 cities with the most residents born in China, excluding Hong Kong and Taiwan (population 500+)"
#72 on the list of "Top 101 cities where the highest percentage of males (15+ years) which never married (with at least 1,000 males in this group)"
#78 on the list of "Top 101 cities where the highest percentage of females (15+ years) which never married (with at least 1,000 females in this group)"
#81 on the list of "Top 101 cities with largest percentage of females in occupations: education, training, and library occupations (population 5,000+)"
#82 on the list of "Top 101 cities with the lowest percentage of family households, population 1,000+"
#83 on the list of "Top 101 cities with the most residents born in China (population 500+)"
#90 on the list of "Top 101 cities with the most people taking a bus, a trolley bus, a streetcar, or a trolley car to work (population 5,000+)"
#37 on the list of "Top 101 counties with the largest number of people moving out compared to moving in (pop. 50,000+)"
#49 on the list of "Top 101 counties with highest percentage of residents voting for 3rd party candidates in the 2012 Presidential Election (pop. 50,000+)"
#58 on the list of "Top 101 counties with the largest decrease in the number of deaths per 1000 residents 2000-2006 to 2007-2013 (pop. 50,000+)"
#79 on the list of "Top 101 counties with the highest percentage of residents relocating to foreign countries in 2011 (pop. 50,000+)"
#80 on the list of "Top 101 counties with the lowest number of deaths per 1000 residents 2007-2013 (pop. 50,000+)"
Top Patent Applicants
Allie K. Watfa (56)
Hossein Bagheri (28)
Gary Durack (25)
Nick Holonyak, Jr. (20)
Mark Watson (19)
Paris Smaragdis (19)
Jeremy T. Hatcher (18)
Anupam Seth (15)
Aleksandar Jovicic (12)
Munir H. Nayfeh (12)
Total of 1241 patent applications in 2008-2024.


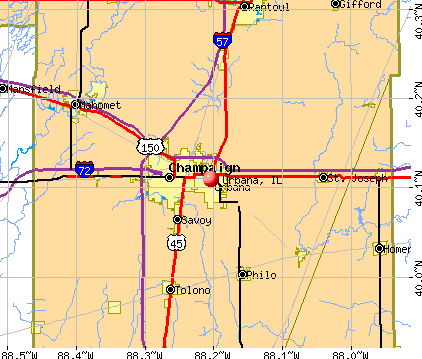


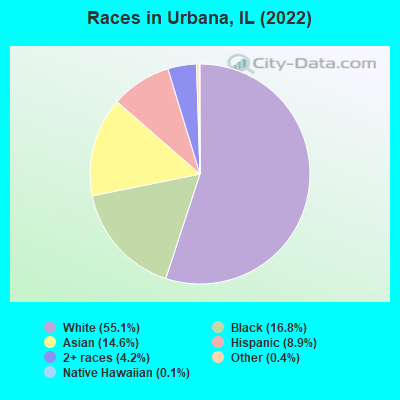
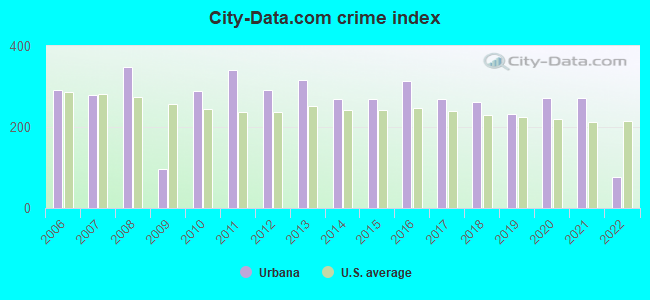
 Recent articles from our blog. Our writers, many of them Ph.D. graduates or candidates, create easy-to-read articles on a wide variety of topics.

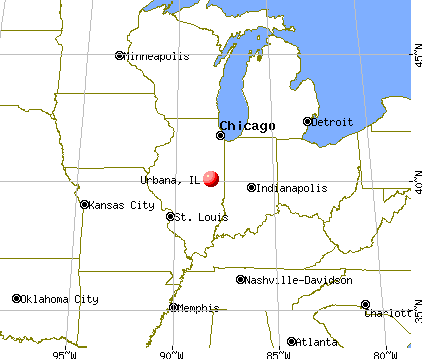
 (3.0 miles
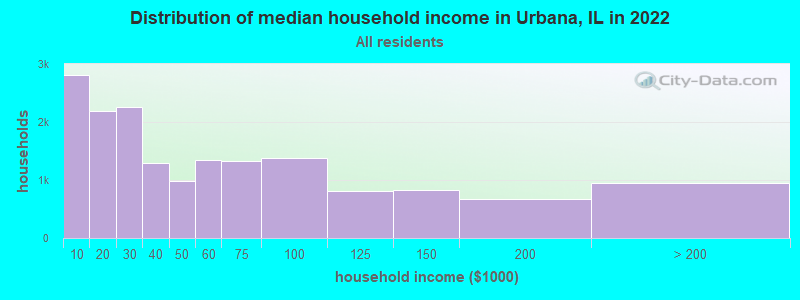
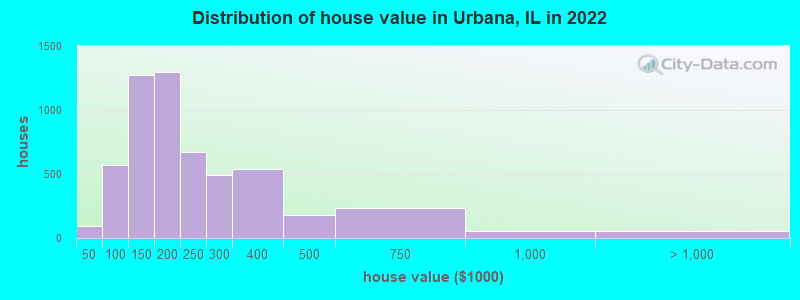
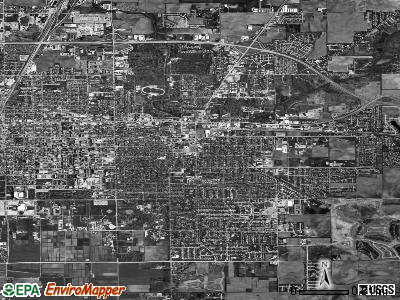
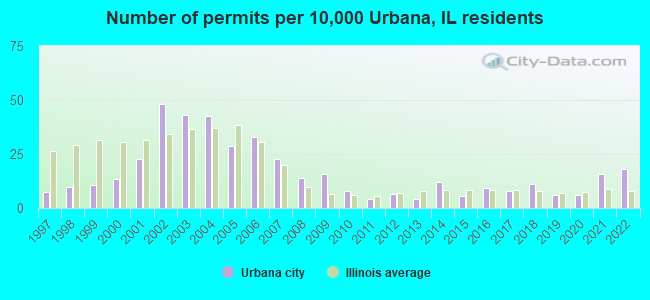
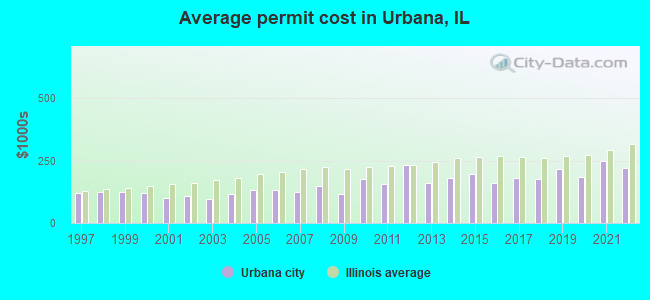
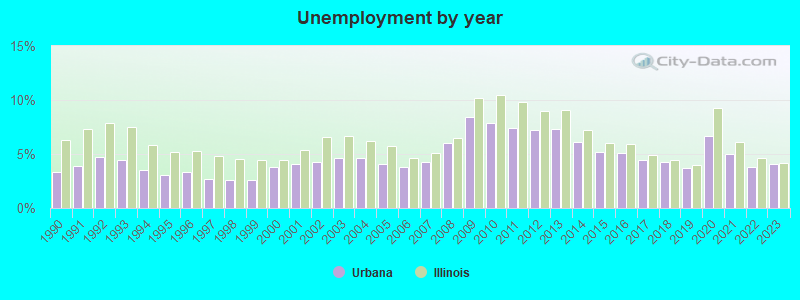
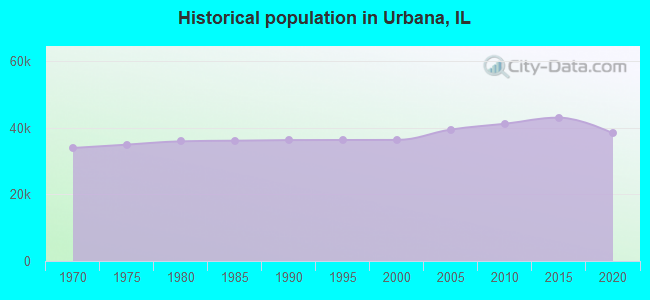
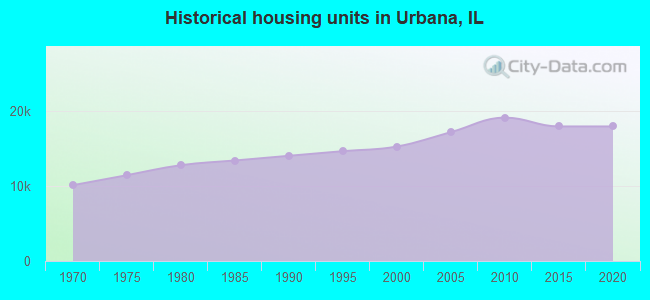
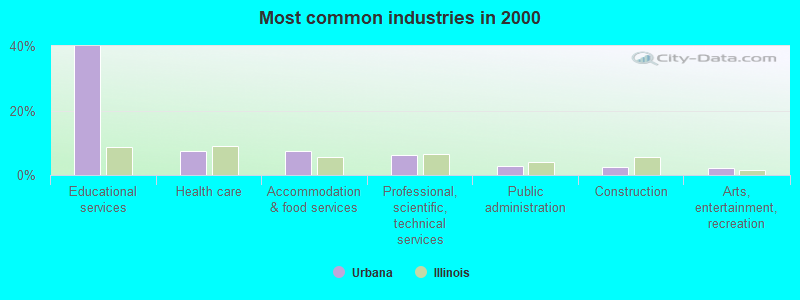
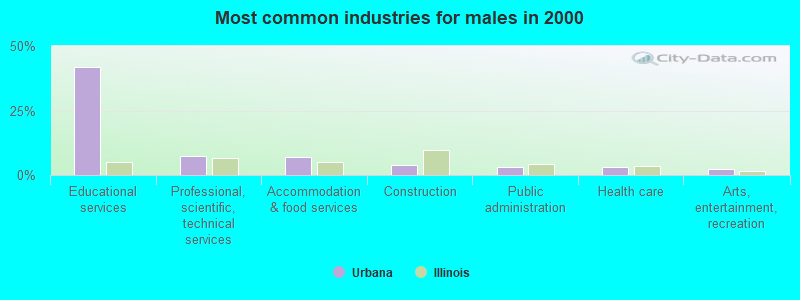
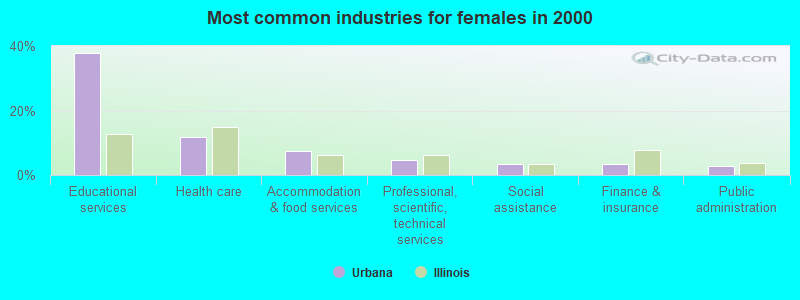
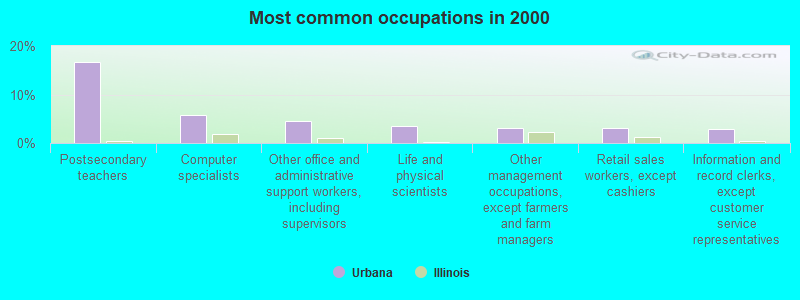
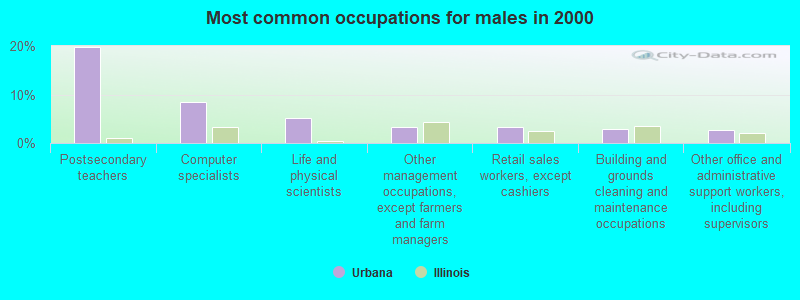
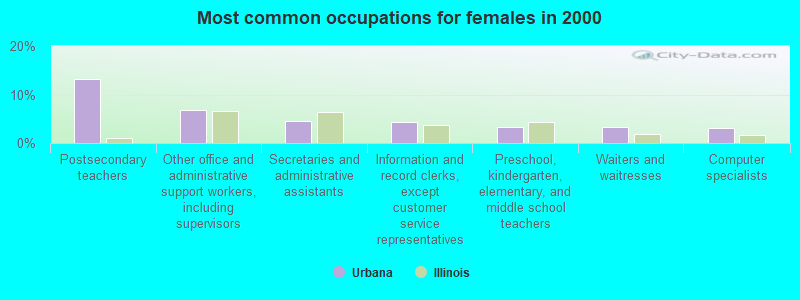
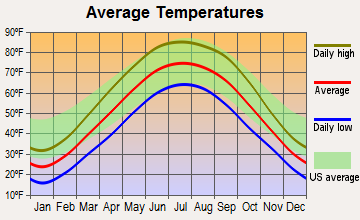
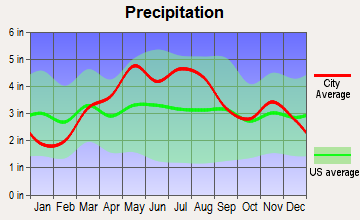
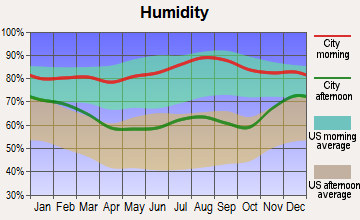
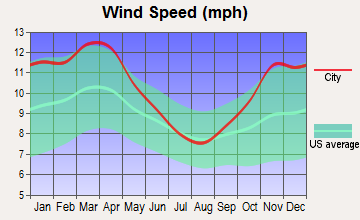
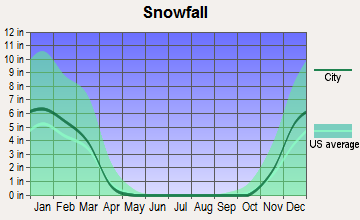
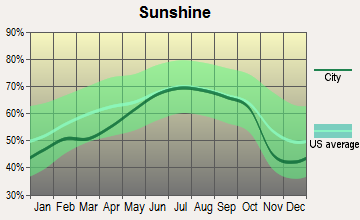
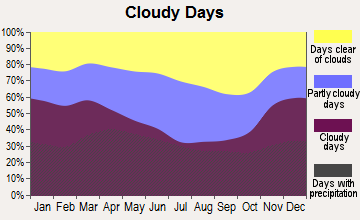

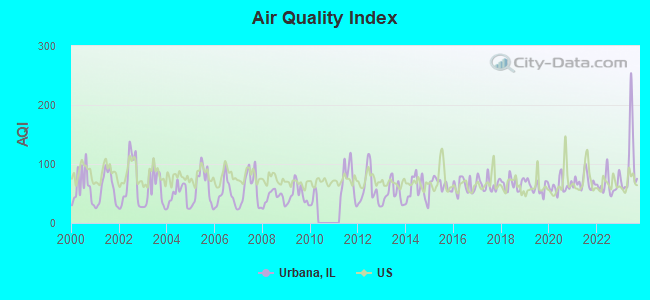
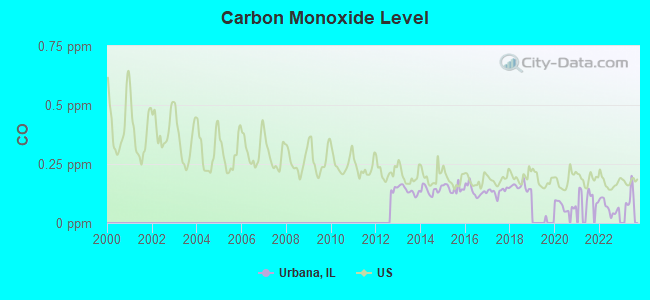
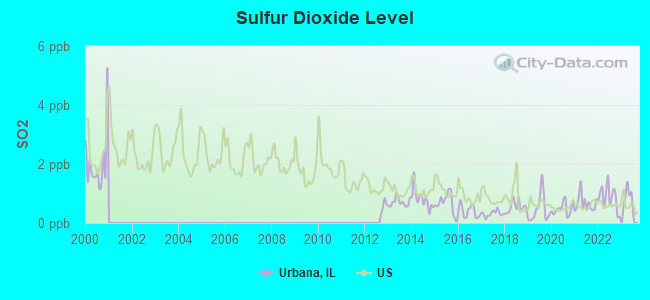
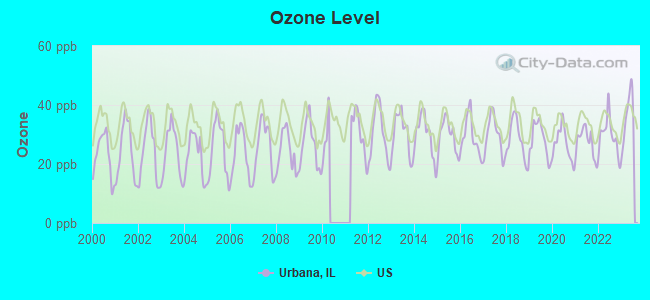
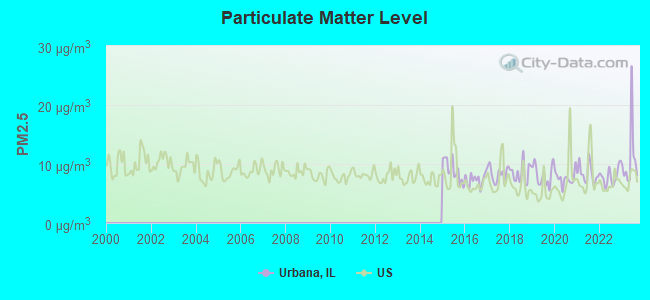
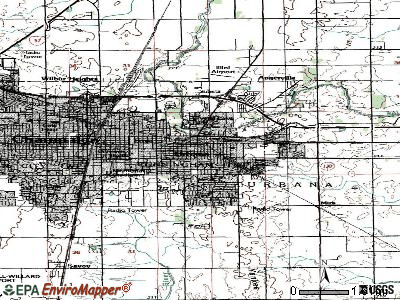
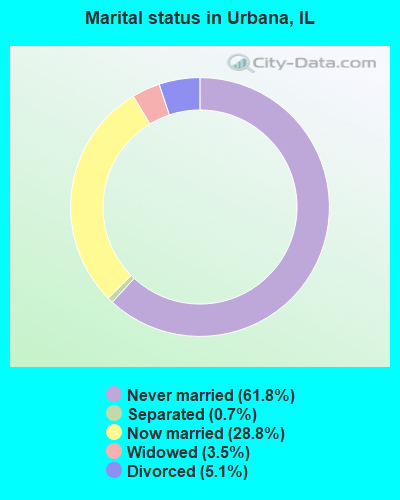
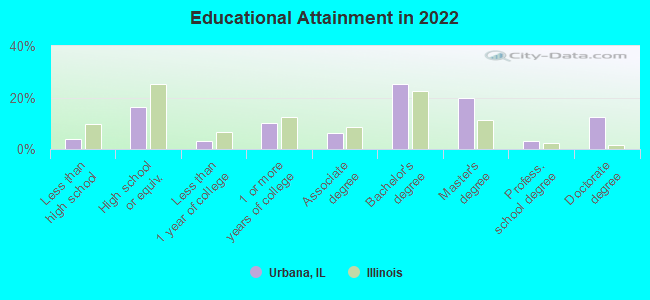
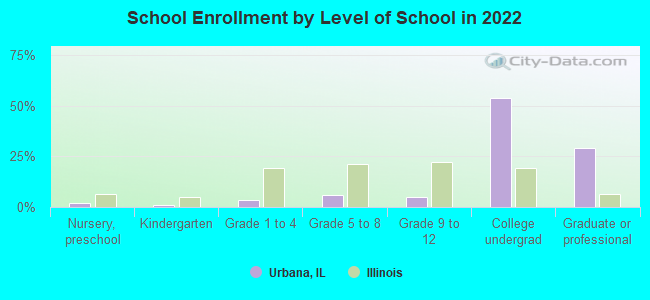
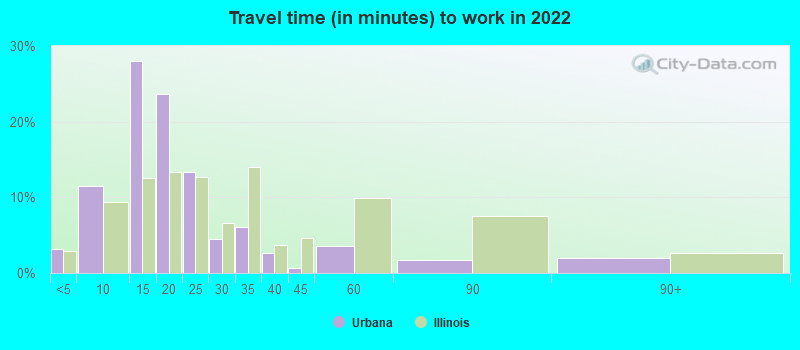
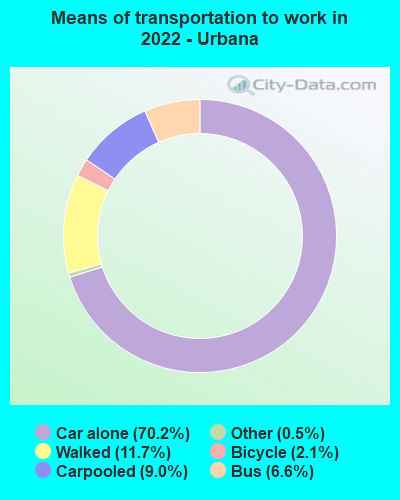
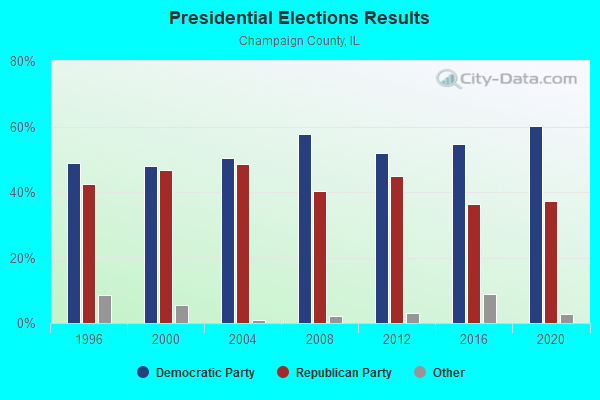
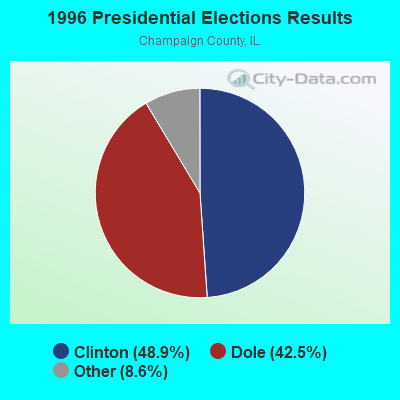
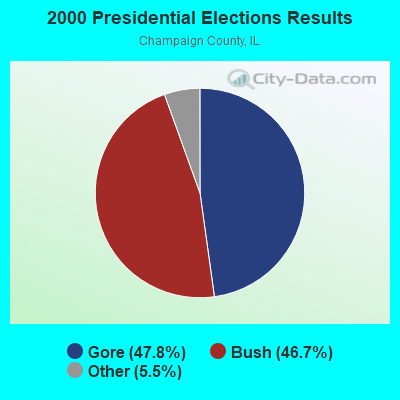
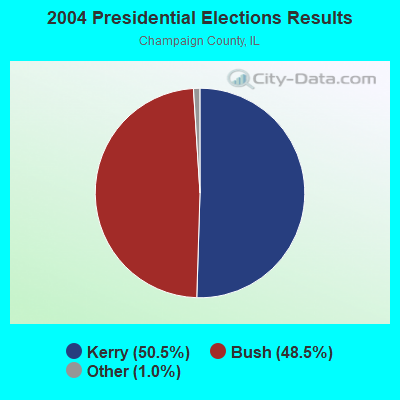
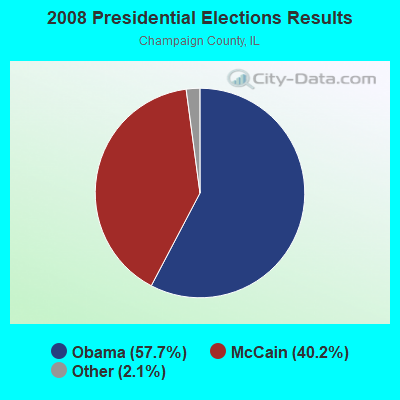
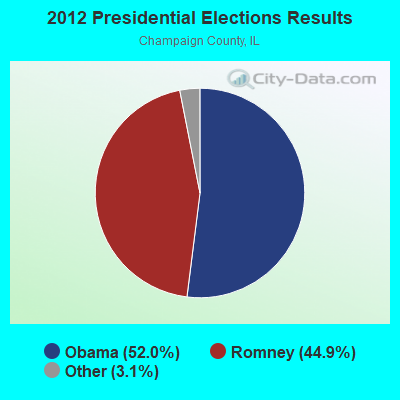
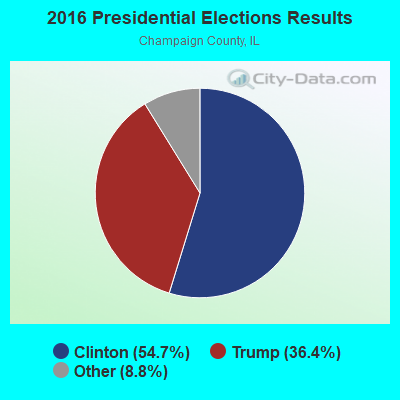
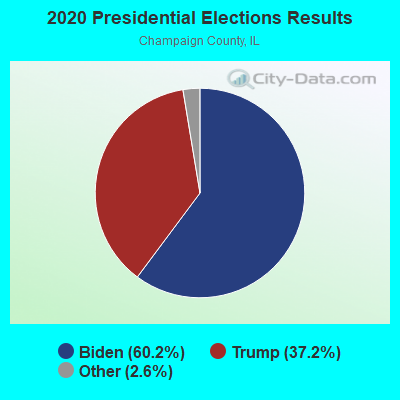
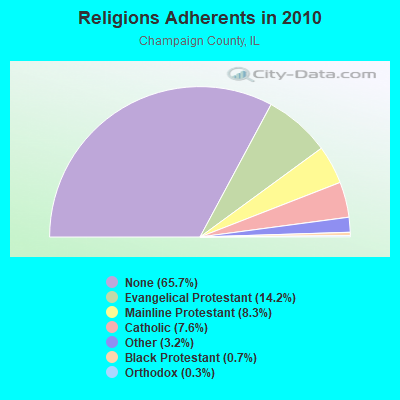
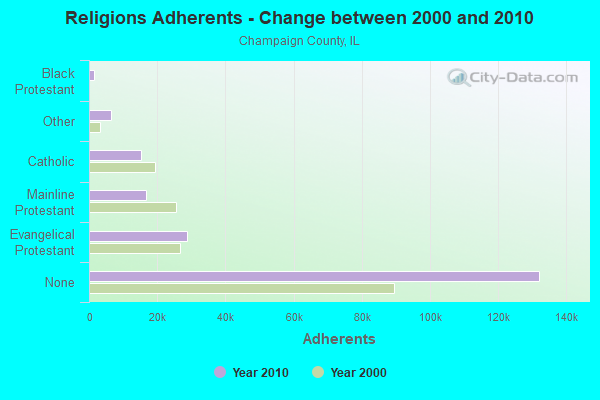
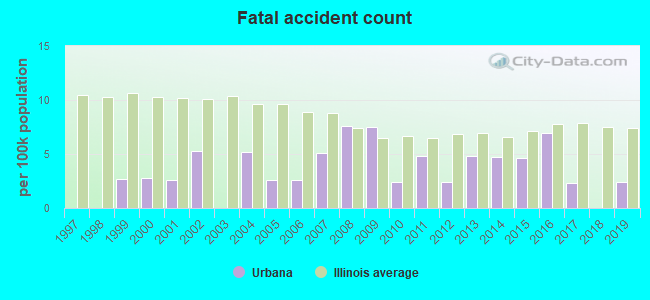
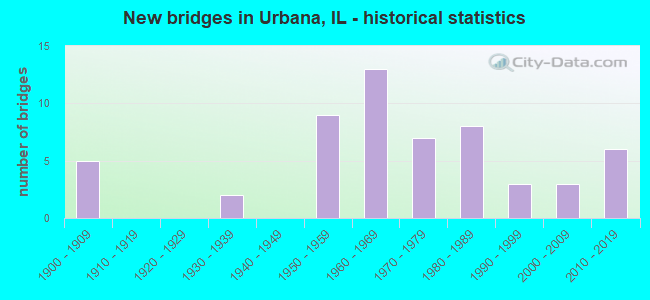
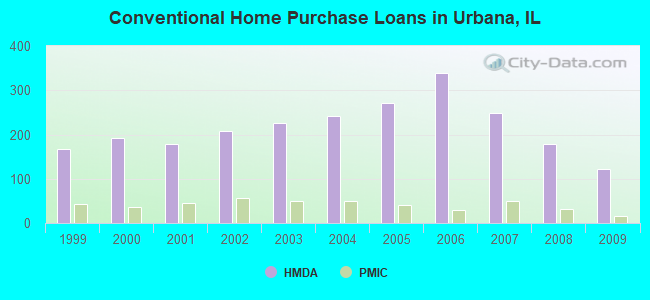
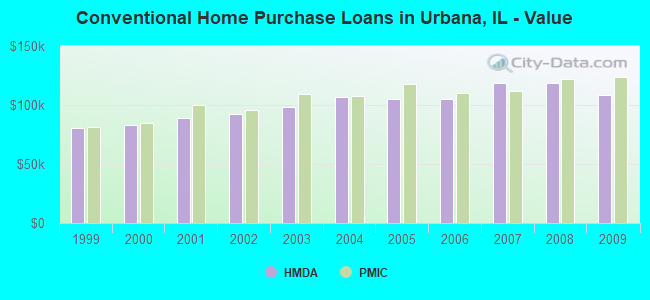
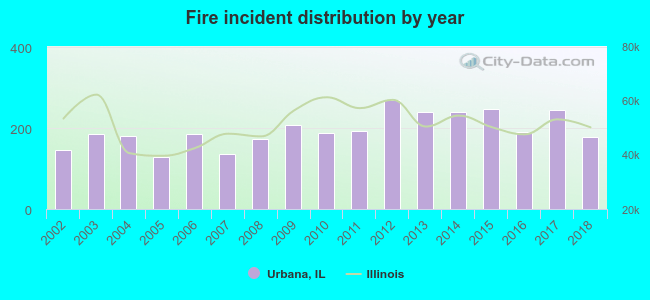 According to the data from the years 2002 - 2018 the average number of fire incidents per year is 196. The highest number of fire incidents - 269 took place in 2012, and the least - 128 in 2005. The data has a growing trend.
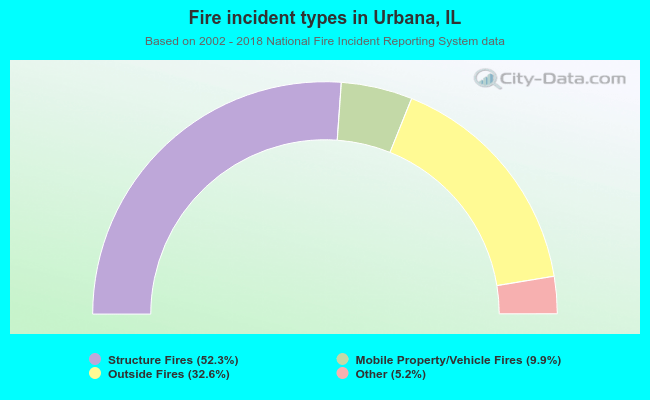 When looking into fire subcategories, the most reports belonged to: Structure Fires (52.3%), and Outside Fires (32.6%).