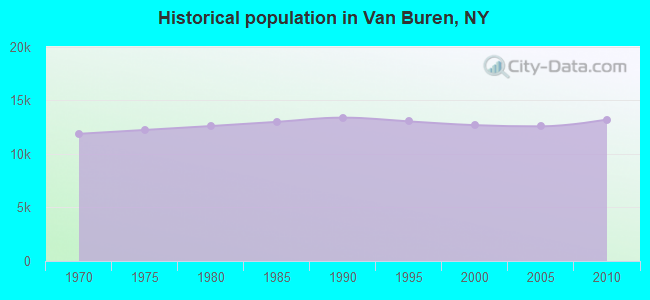
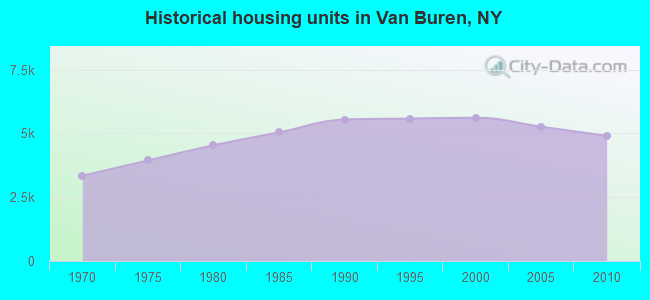
Van Buren, New York
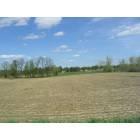
Van Buren: Suburban Syracuse on a country road in Van Buren
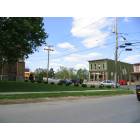
Van Buren: Suburban Syracuse in Van Buren
- add
your
Submit your own pictures of this town and show them to the world
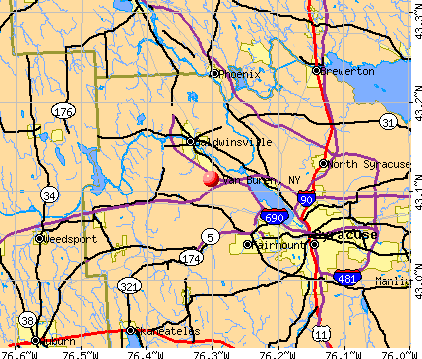
- OSM Map
- General Map
- Google Map
- MSN Map
Population change since 2000: +4.1%
 |
| Males: 6,420 | |
| Females: 6,765 |
| Median resident age: | 43.6 years |
| New York median age: | 40.7 years |
Zip codes: 13027.
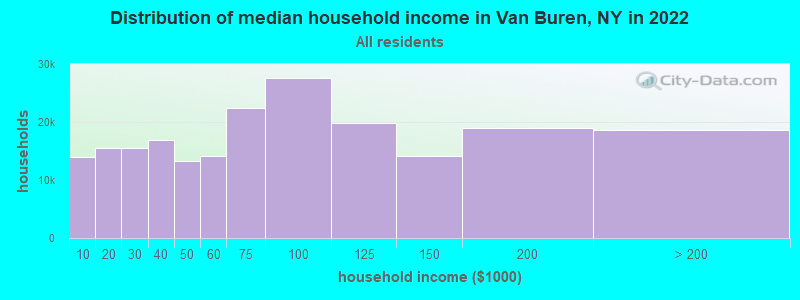
| Van Buren: | $74,714 |
| NY: | $79,557 |
Estimated per capita income in 2022: $39,177 (it was $20,997 in 2000)
Van Buren town income, earnings, and wages data
Estimated median house or condo value in 2022: $159,539 (it was $74,300 in 2000)
| Van Buren: | $159,539 |
| NY: | $400,400 |
Mean prices in 2022: all housing units: $214,284; detached houses: $217,899; townhouses or other attached units: $207,408; in 2-unit structures: $163,770; in 3-to-4-unit structures: $75,948; in 5-or-more-unit structures: $207,108; mobile homes: $52,861
Detailed information about poverty and poor residents in Van Buren, NY


- 12,47094.6%White alone
- 2331.8%Hispanic
- 1891.4%Two or more races
- 1391.1%Black alone
- 920.7%Asian alone
- 530.4%American Indian alone
- 70.05%Other race alone
- 20.02%Native Hawaiian and Other
Pacific Islander alone
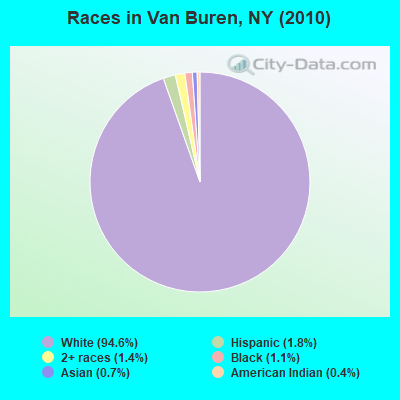
Races in Van Buren detailed stats: ancestries, foreign born residents, place of birth
 Recent articles from our blog. Our writers, many of them Ph.D. graduates or candidates, create easy-to-read articles on a wide variety of topics.


Latest news from Van Buren, NY collected exclusively by city-data.com from local newspapers, TV, and radio stations
Ancestries: German (21.5%), Irish (21.0%), English (16.7%), Italian (14.1%), French (8.8%), Polish (7.3%).
Current Local Time: EST time zone
Elevation: 500 feet
Land area: 35.6 square miles.
Population density: 371 people per square mile (very low).
285 residents are foreign born (0.9% Europe, 0.6% North America, 0.6% Asia).
| This town: | 2.2% |
| New York: | 20.4% |
| Van Buren town: | 2.7% ($2,008) |
| New York: | 1.9% ($2,847) |
Nearest city with pop. 50,000+: Clay, NY  (7.7 miles , pop. 58,805).
Nearest city with pop. 200,000+: Rochester, NY (64.2 miles , pop. 219,773).
Nearest city with pop. 1,000,000+: Bronx, NY (202.2 miles , pop. 1,332,650).
Nearest cities:
), ), )Latitude: 43.12 N, Longitude: 76.34 W
Area code commonly used in this area: 315

Van Buren, New York accommodation & food services, waste management - Economy and Business Data
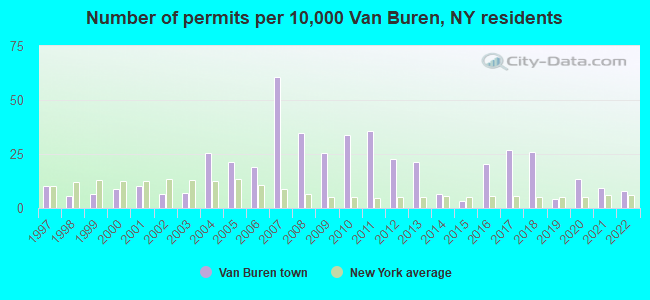
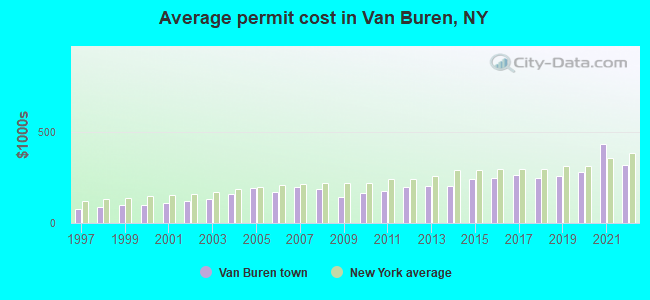
Single-family new house construction building permits:
- 2022: 10 buildings, average cost: $315,800
- 2021: 12 buildings, average cost: $431,600
- 2020: 17 buildings, average cost: $279,300
- 2019: 5 buildings, average cost: $256,000
- 2018: 33 buildings, average cost: $244,900
- 2017: 34 buildings, average cost: $263,100
- 2016: 26 buildings, average cost: $244,800
- 2015: 4 buildings, average cost: $241,000
- 2014: 8 buildings, average cost: $200,700
- 2013: 27 buildings, average cost: $202,400
- 2012: 29 buildings, average cost: $195,200
- 2011: 45 buildings, average cost: $176,900
- 2010: 43 buildings, average cost: $166,200
- 2009: 32 buildings, average cost: $143,600
- 2008: 44 buildings, average cost: $183,800
- 2007: 77 buildings, average cost: $196,300
- 2006: 24 buildings, average cost: $170,700
- 2005: 27 buildings, average cost: $191,300
- 2004: 32 buildings, average cost: $158,300
- 2003: 9 buildings, average cost: $131,200
- 2002: 8 buildings, average cost: $122,600
- 2001: 13 buildings, average cost: $111,100
- 2000: 11 buildings, average cost: $99,200
- 1999: 8 buildings, average cost: $97,700
- 1998: 7 buildings, average cost: $84,700
- 1997: 13 buildings, average cost: $78,100
| Here: | 3.9% |
| New York: | 4.4% |
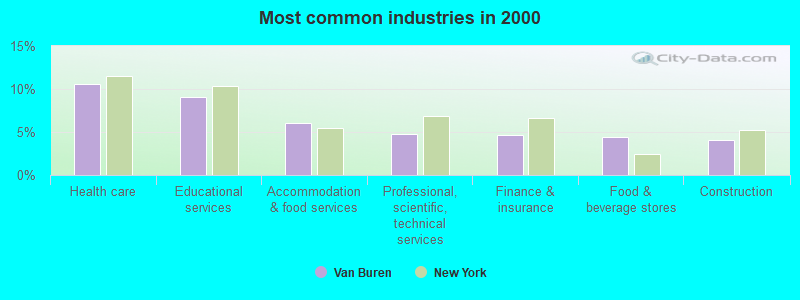
- Health care (10.6%)
- Educational services (9.0%)
- Accommodation & food services (6.0%)
- Professional, scientific, technical services (4.7%)
- Finance & insurance (4.6%)
- Food & beverage stores (4.4%)
- Construction (4.1%)
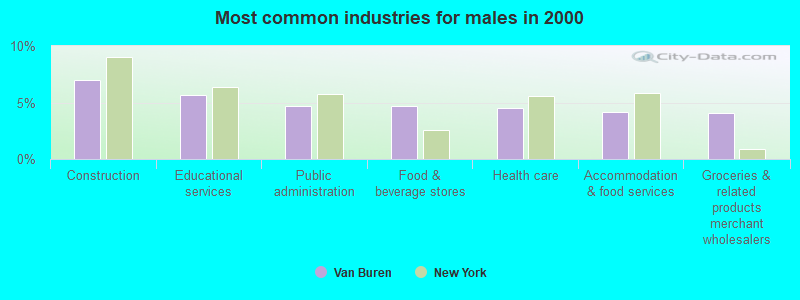
- Construction (7.0%)
- Educational services (5.7%)
- Public administration (4.7%)
- Food & beverage stores (4.7%)
- Health care (4.5%)
- Accommodation & food services (4.2%)
- Groceries & related products merchant wholesalers (4.0%)
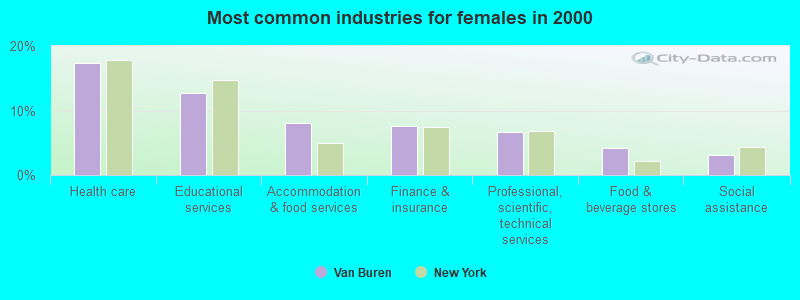
- Health care (17.4%)
- Educational services (12.8%)
- Accommodation & food services (8.1%)
- Finance & insurance (7.6%)
- Professional, scientific, technical services (6.7%)
- Food & beverage stores (4.2%)
- Social assistance (3.1%)
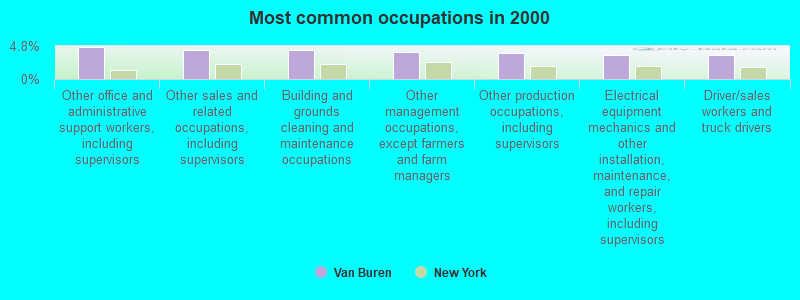
- Other office and administrative support workers, including supervisors (4.6%)
- Other sales and related occupations, including supervisors (4.2%)
- Building and grounds cleaning and maintenance occupations (4.2%)
- Other management occupations, except farmers and farm managers (3.9%)
- Other production occupations, including supervisors (3.8%)
- Electrical equipment mechanics and other installation, maintenance, and repair workers, including supervisors (3.5%)
- Driver/sales workers and truck drivers (3.5%)
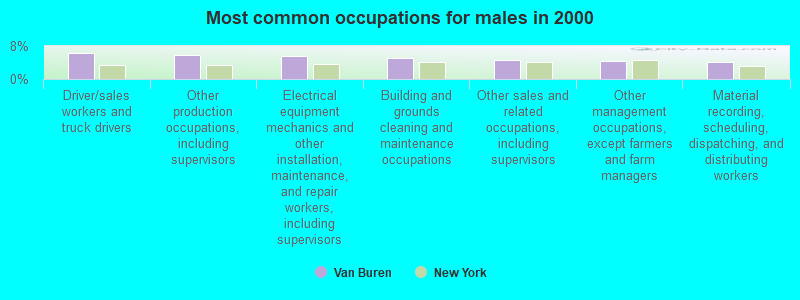
- Driver/sales workers and truck drivers (6.2%)
- Other production occupations, including supervisors (5.8%)
- Electrical equipment mechanics and other installation, maintenance, and repair workers, including supervisors (5.5%)
- Building and grounds cleaning and maintenance occupations (5.2%)
- Other sales and related occupations, including supervisors (4.7%)
- Other management occupations, except farmers and farm managers (4.3%)
- Material recording, scheduling, dispatching, and distributing workers (4.1%)
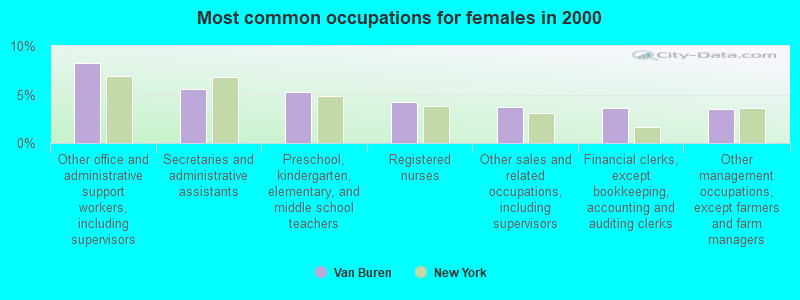
- Other office and administrative support workers, including supervisors (8.2%)
- Secretaries and administrative assistants (5.6%)
- Preschool, kindergarten, elementary, and middle school teachers (5.3%)
- Registered nurses (4.2%)
- Other sales and related occupations, including supervisors (3.7%)
- Financial clerks, except bookkeeping, accounting and auditing clerks (3.6%)
- Other management occupations, except farmers and farm managers (3.5%)
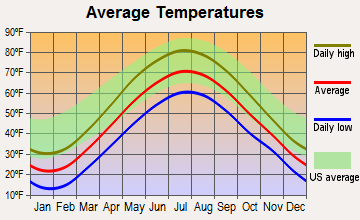
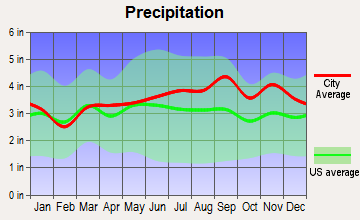
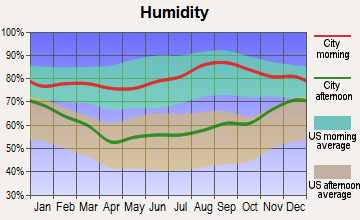
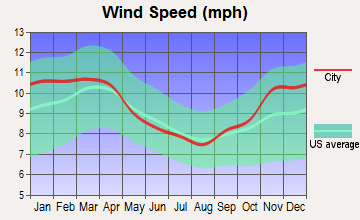
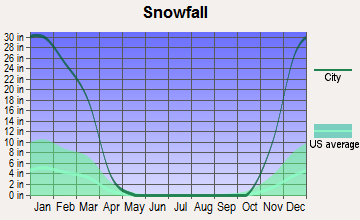
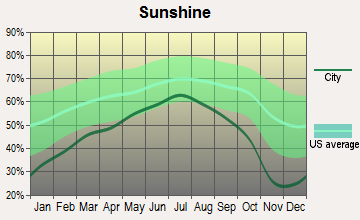
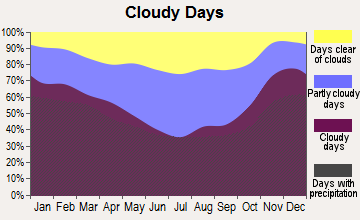
Average climate in Van Buren, New York
Based on data reported by over 4,000 weather stations
(lower is better)
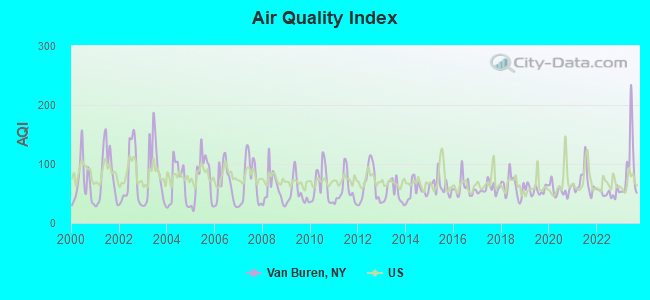
Air Quality Index (AQI) level in 2023 was 92.7. This is worse than average.
| City: | 92.7 |
| U.S.: | 72.6 |
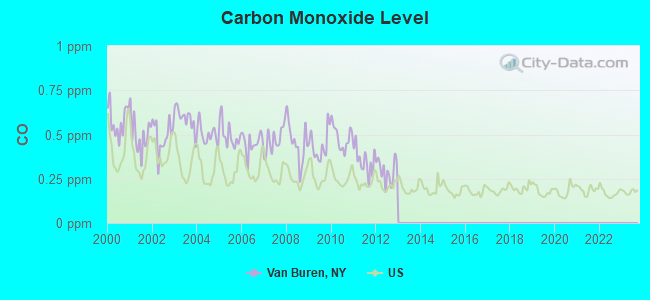
Carbon Monoxide (CO) [ppm] level in 2012 was 0.295. This is about average. Closest monitor was 9.3 miles away from the city center.
| City: | 0.295 |
| U.S.: | 0.251 |
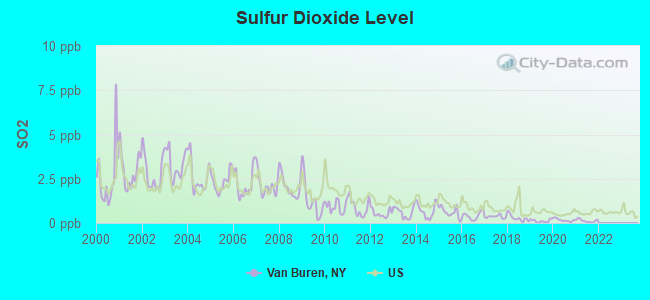
Sulfur Dioxide (SO2) [ppb] level in 2021 was 0.128. This is significantly better than average. Closest monitor was 8.0 miles away from the city center.
| City: | 0.128 |
| U.S.: | 1.515 |
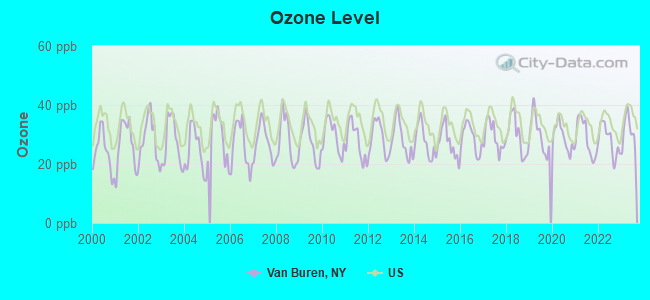
Ozone [ppb] level in 2023 was 31.1. This is about average. Closest monitor was 9.3 miles away from the city center.
| City: | 31.1 |
| U.S.: | 33.3 |
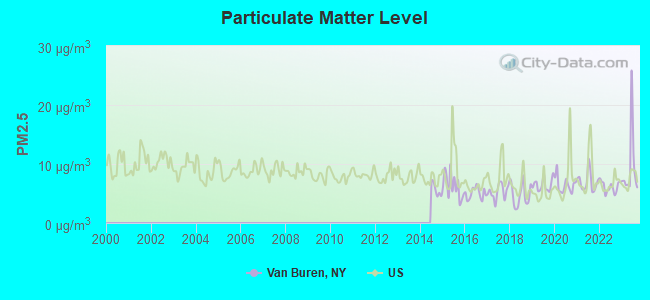
Particulate Matter (PM2.5) [µg/m3] level in 2023 was 9.42. This is about average. Closest monitor was 10.3 miles away from the city center.
| City: | 9.42 |
| U.S.: | 8.11 |
Tornado activity:
Van Buren-area historical tornado activity is below New York state average. It is 78% smaller than the overall U.S. average.
On 5/2/1983, a category F3 (max. wind speeds 158-206 mph) tornado 7.7 miles away from the Van Buren town center caused between $50,000 and $500,000 in damages.
On 5/2/1983, a category F3 tornado 10.2 miles away from the town center killed one person and caused between $500,000 and $5,000,000 in damages.
Earthquake activity:
Van Buren-area historical earthquake activity is significantly above New York state average. It is 68% smaller than the overall U.S. average.On 10/7/1983 at 10:18:46, a magnitude 5.3 (5.1 MB, 5.3 LG, 5.1 ML, Class: Moderate, Intensity: VI - VII) earthquake occurred 115.5 miles away from the city center
On 4/20/2002 at 10:50:47, a magnitude 5.3 (5.3 ML, Depth: 3.0 mi) earthquake occurred 163.2 miles away from Van Buren center
On 4/20/2002 at 10:50:47, a magnitude 5.2 (5.2 MB, 4.2 MS, 5.2 MW, 5.0 MW) earthquake occurred 161.4 miles away from the city center
On 9/25/1998 at 19:52:52, a magnitude 5.2 (4.8 MB, 4.3 MS, 5.2 LG, 4.5 MW, Depth: 3.1 mi) earthquake occurred 236.1 miles away from the city center
On 8/23/2011 at 17:51:04, a magnitude 5.8 (5.8 MW, Depth: 3.7 mi) earthquake occurred 370.2 miles away from the city center
On 6/17/1991 at 08:53:16, a magnitude 4.1 (4.0 MB, 4.0 LG, Depth: 3.1 mi, Class: Light, Intensity: IV - V) earthquake occurred 91.0 miles away from Van Buren center
Magnitude types: regional Lg-wave magnitude (LG), body-wave magnitude (MB), local magnitude (ML), surface-wave magnitude (MS), moment magnitude (MW)
Natural disasters:
The number of natural disasters in Onondaga County (15) is near the US average (15).Major Disasters (Presidential) Declared: 10
Emergencies Declared: 5
Causes of natural disasters: Storms: 7, Floods: 5, Hurricanes: 2, Blizzard: 1, Heavy Rain: 1, Ice Storm: 1, Landslide: 1, Power Outage: 1, Tornado: 1, Tropical Storm: 1, Wind: 1, Other: 2 (Note: some incidents may be assigned to more than one category).

Hospitals and medical centers near Van Buren:
- SYRACUSE HOME ASSOCIATION (Nursing Home, about 2 miles away; BALDWINSVILLE, NY)
- ST. JOSEPH'S - SENECA (Dialysis Facility, about 7 miles away; LIVERPOOL, NY)
- TOOMEY RESIDENTIAL COMMUNITY SERVICES (Hospital, about 7 miles away; LIVERPOOL, NY)
- ST. JOSEPH'S - CAMILLUS (Dialysis Facility, about 7 miles away; CAMILLUS, NY)
- ELDERWOOD HEALTH CARE AT BIRCHWOOD (Nursing Home, about 9 miles away; LIVERPOOL, NY)
- ST JOSEPHS HOSP HEALTH CENTER CHHA (Home Health Center, about 9 miles away; LIVERPOOL, NY)
- LIVERPOOL DIALYSIS CENTER, LLC (Dialysis Facility, about 9 miles away; SYRACUSE, NY)
Amtrak station near Van Buren:
- 10 miles: SYRACUSE (131 P & C PKWY.) . Services: ticket office, fully wheelchair accessible, enclosed waiting area, public restrooms, public payphones, full-service food facilities, free short-term parking, paid long-term parking, call for car rental service, taxi stand, intercity bus service, public transit connection.
Colleges/universities with over 2000 students nearest to Van Buren:
- Onondaga Community College (about 11 miles; Syracuse, NY; Full-time enrollment: 8,920)
- Syracuse University (about 12 miles; Syracuse, NY; FT enrollment: 20,717)
- SUNY College of Environmental Science and Forestry (about 12 miles; Syracuse, NY; FT enrollment: 2,044)
- Le Moyne College (about 14 miles; Syracuse, NY; FT enrollment: 3,041)
- Cayuga County Community College (about 17 miles; Auburn, NY; FT enrollment: 3,141)
- SUNY College at Oswego (about 25 miles; Oswego, NY; FT enrollment: 7,550)
- Hobart William Smith Colleges (about 38 miles; Geneva, NY; FT enrollment: 2,476)
Points of interest:
Notable locations in Van Buren: Daboll Corners (A), Crows Hollow (B), State Fair Toll Plaza (C), Warners Rest Area (D), South Side Sewage Disposal Plant (E), Potters Tree Farm (F), Ironwood Country Club (G), Memphis Fire Department (H), Baldwinsville Village Fire Department (I), Baldwinsville Fire Department Station 1 (J), Baldwinsville Fire Department Station 2 (K). Display/hide their locations on the map
Churches in Van Buren include: Saint Augustines Church (A), Saint Pauls Church (B), Kingdom Hall Church (C), Christ Community United Methodist Church (D), Community Wesleyan Church (E), First Baptist Church (F), Saint Mary's Roman Catholic Church (G), Beacon Gospel Tabernacle (H). Display/hide their locations on the map
Cemeteries: Riverside Cemetery (1), Rouse Cemetery (2), Saint Marys Cemetery (3), Sears Cemetery (4), Ionia Cemetery (5), Warners Cemetery (6), Kingdom Cemetery (7). Display/hide their locations on the map
Lake: Nineteenth Pond (A). Display/hide its location on the map
Streams, rivers, and creeks: White Bottom Creek (A), Dead Creek (B), Crooked Brook (C). Display/hide their locations on the map
| This town: | 2.3 people |
| New York: | 2.6 people |
| This town: | 60.2% |
| Whole state: | 63.5% |
| This town: | 8.9% |
| Whole state: | 6.8% |
Likely homosexual households (counted as self-reported same-sex unmarried-partner households)
- Lesbian couples: 0.3% of all households
- Gay men: 0.2% of all households
| This town: | 6.6% |
| Whole state: | 14.6% |
| This town: | 3.0% |
| Whole state: | 7.4% |
15 people in group homes intended for adults in 2010
People in group quarters in Van Buren in 2000:
- 119 people in nursing homes
- 10 people in other noninstitutional group quarters
- 8 people in homes for the mentally ill
- 3 people in religious group quarters
For population 15 years and over in Van Buren:
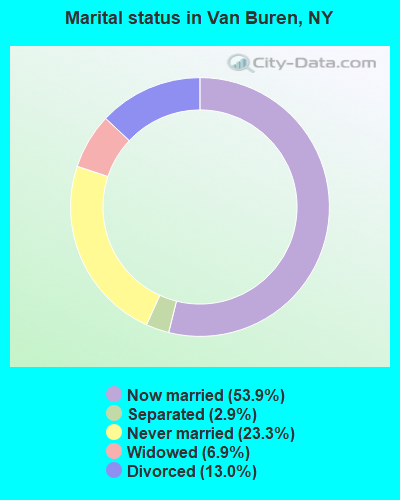
- Never married: 23.3%
- Now married: 53.9%
- Separated: 2.9%
- Widowed: 6.9%
- Divorced: 13.0%
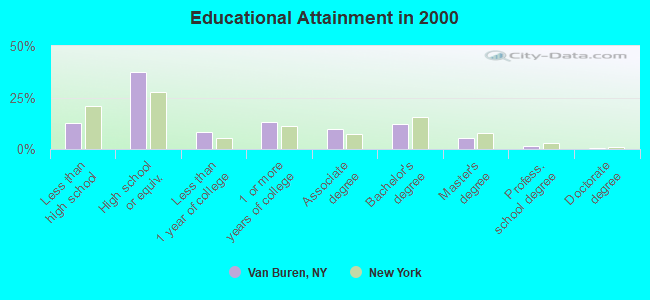
For population 25 years and over in Van Buren:
- High school or higher: 87.6%
- Bachelor's degree or higher: 19.4%
- Graduate or professional degree: 7.1%
- Unemployed: 3.6%
- Mean travel time to work (commute): 21.7 minutes
| Here: | 9.4 |
| New York average: | 14.2 |
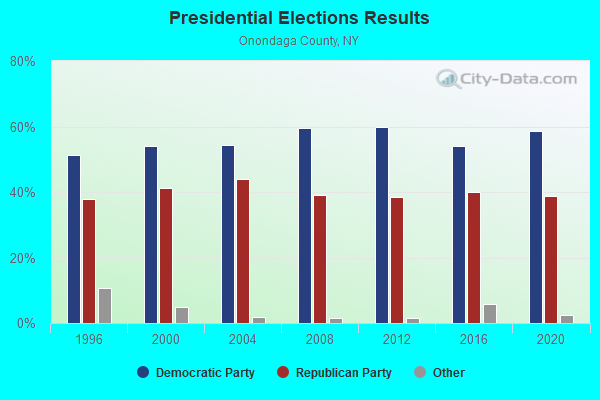
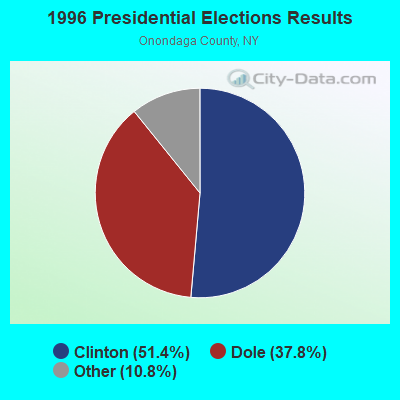
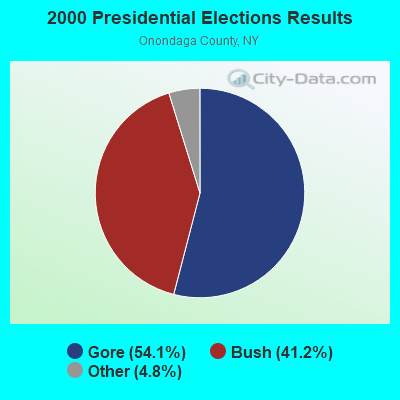
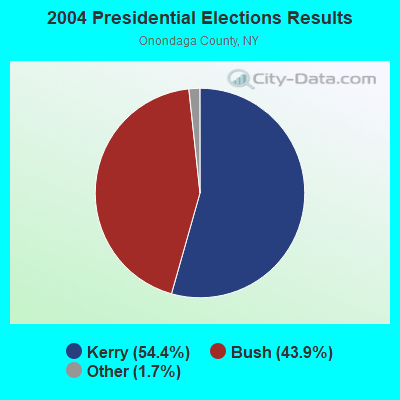
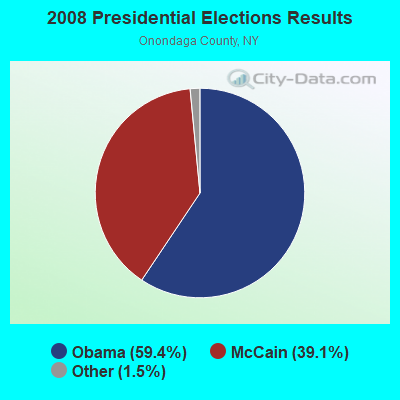

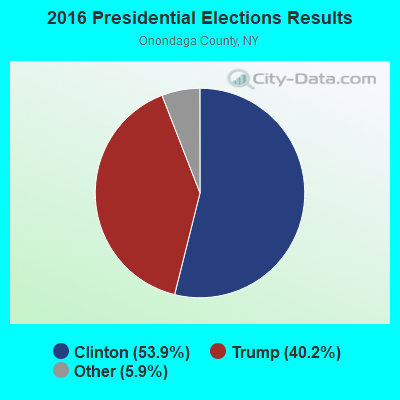
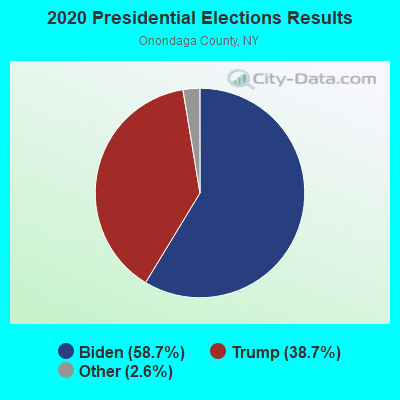
Graphs represent county-level data. Detailed 2008 Election Results
Religion statistics for Van Buren, NY (based on Onondaga County data)
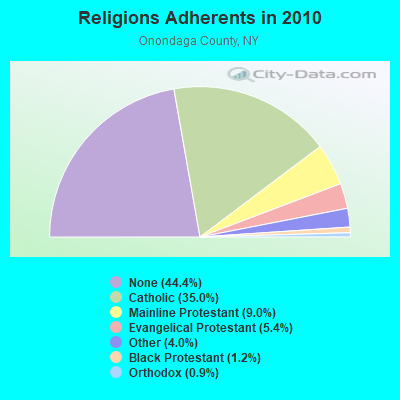
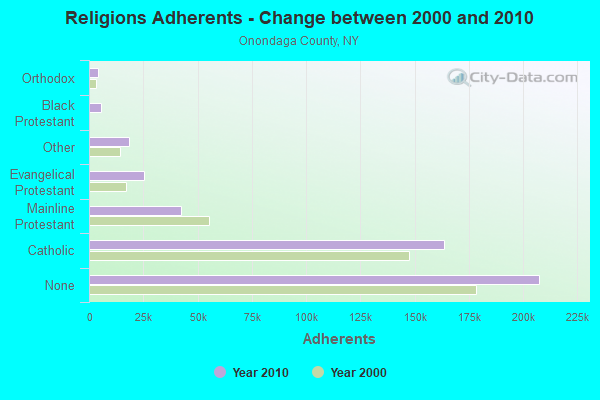
| Religion | Adherents | Congregations |
|---|---|---|
| Catholic | 163,488 | 59 |
| Mainline Protestant | 42,255 | 129 |
| Evangelical Protestant | 25,349 | 137 |
| Other | 18,569 | 34 |
| Black Protestant | 5,690 | 28 |
| Orthodox | 4,152 | 12 |
| None | 207,523 | - |
Food Environment Statistics:
| This county: | 2.56 / 10,000 pop. |
| New York: | 4.13 / 10,000 pop. |
| This county: | 0.11 / 10,000 pop. |
| New York: | 0.06 / 10,000 pop. |
| Onondaga County: | 1.08 / 10,000 pop. |
| New York: | 0.92 / 10,000 pop. |
| This county: | 2.74 / 10,000 pop. |
| New York: | 1.68 / 10,000 pop. |
| This county: | 8.17 / 10,000 pop. |
| State: | 8.82 / 10,000 pop. |
| Onondaga County: | 7.9% |
| New York: | 8.2% |
| This county: | 27.3% |
| New York: | 23.8% |
| Here: | 13.7% |
| State: | 15.6% |
4.05% of this county's 2021 resident taxpayers lived in other counties in 2020 ($62,522 average adjusted gross income)
| Here: | 4.05% |
| New York average: | 5.29% |
0.01% of residents moved from foreign countries ($88 average AGI)
Onondaga County: 0.01% New York average: 0.01%
Top counties from which taxpayers relocated into this county between 2020 and 2021:
| from Oswego County, NY | |
| from Madison County, NY | |
| from Cayuga County, NY |
4.93% of this county's 2020 resident taxpayers moved to other counties in 2021 ($66,970 average adjusted gross income)
| Here: | 4.93% |
| New York average: | 6.93% |
0.01% of residents moved to foreign countries ($98 average AGI)
Onondaga County: 0.01% New York average: 0.02%
Top counties to which taxpayers relocated from this county between 2020 and 2021:
| to Oswego County, NY | |
| to Madison County, NY | |
| to Cayuga County, NY |
Strongest AM radio stations in Van Buren:
- WFBL (1050 AM; 2 kW; BALDWINSVILLE, NY; Owner: BUCKLEY BROADCASTING CORPORATION)
- WHEN (620 AM; 5 kW; SYRACUSE, NY; Owner: CLEAR CHANNEL BROADCASTING LICENSES, INC.)
- WDCW (1390 AM; 5 kW; SYRACUSE, NY; Owner: KIMTRON, INC.)
- WSYR (570 AM; 5 kW; SYRACUSE, NY; Owner: CLEAR CHANNEL BROADCASTING LICENSES, INC.)
- WNSS (1260 AM; 5 kW; SYRACUSE, NY; Owner: CITADEL BROADCASTING COMPANY)
- WHAM (1180 AM; 50 kW; ROCHESTER, NY; Owner: CITICASTERS LICENSES, L.P.)
- WTLA (1200 AM; 1 kW; NORTH SYRACUSE, NY; Owner: GALAXY COMMUNICATIONS, L.P.)
- WOLF (1490 AM; 1 kW; SYRACUSE, NY; Owner: WOLF RADIO INC.)
- WSIV (1540 AM; 2 kW; E. SYRACUSE, NY; Owner: CRAM COMMUNICATIONS LLC)
- WAMF (1300 AM; 1 kW; FULTON, NY; Owner: DONALD H. DEROSA)
- WGY (810 AM; 50 kW; SCHENECTADY, NY; Owner: CLEAR CHANNEL BROADCASTING LICENSES, INC.)
- WHCU (870 AM; 5 kW; ITHACA, NY; Owner: EAGLE BROADCASTING COMPANY, INC.)
- WWLF (1340 AM; 1 kW; AUBURN, NY; Owner: WOLF RADIO, INC)
Strongest FM radio stations in Van Buren:
- WZUN (102.1 FM; PHOENIX, NY; Owner: GALAXY COMMUNICATIONS, L.P.)
- WSEN-FM (92.1 FM; BALDWINSVILLE, NY; Owner: BUCKLEY BROADCASTING CORPORATION)
- WBXL (90.5 FM; BALDWINSVILLE, NY; Owner: BALDWINSVILLE CENTRAL SCHOOL DIST.)
- WBBS (104.7 FM; FULTON, NY; Owner: CITICASTERS LICENSES, L.P.)
- WMHR (102.9 FM; SYRACUSE, NY; Owner: MARS HILL BROADCASTING CO., INC.)
- W207BH (89.3 FM; BALDWINSVILLE, NY; Owner: FAMILY LIFE MINISTRIES, INC.)
- WLTI (105.9 FM; SYRACUSE, NY; Owner: CITADEL BROADCASTING COMPANY)
- WYYY (94.5 FM; SYRACUSE, NY; Owner: CLEAR CHANNEL BROADCASTING LICENSES, INC.)
- WCNY-FM (91.3 FM; SYRACUSE, NY; Owner: THE PUB. B/C COUNC. OF CEN. NY, INC.)
- WNTQ (93.1 FM; SYRACUSE, NY; Owner: CITADEL BROADCASTING COMPANY)
- W278AH (103.5 FM; SYRACUSE, JAMESVILLE, NY; Owner: CALVARY CHAPEL OF THE FINGER LAKES, INC.)
- WWHT (107.9 FM; SYRACUSE, NY; Owner: CLEAR CHANNEL BROADCASTING LICENSES, INC.)
- WPHR (106.9 FM; AUBURN, NY; Owner: CLEAR CHANNEL BROADCASTING LICENSES, INC.)
- WAQX-FM (95.7 FM; MANLIUS, NY; Owner: CITADEL BROADCASTING COMPANY)
- W251AK (98.1 FM; NEDROW, NY; Owner: PATHWAY COMMUNITY RADIO, INC.)
- WKRL-FM (100.9 FM; NORTH SYRACUSE, NY; Owner: GALAXY COMMUNICATIONS, L.P.)
- W256AC (99.1 FM; SOLVAY, NY; Owner: GALAXY COMMUNICATIONS, L.P.)
- W267AL (101.3 FM; SYRACUSE, NY; Owner: GALAXY COMMUNICATIONS, L.P.)
- WAER (88.3 FM; SYRACUSE, NY; Owner: SYRACUSE UNIVERSITY)
- WTKV (105.5 FM; OSWEGO, NY; Owner: GALAXY COMMUNICATIONS, L.P.)
TV broadcast stations around Van Buren:
- WCNY-TV (Channel 24; SYRACUSE, NY; Owner: PUBLIC BROADCASTING COUNCIL OF CENTRAL NEW YORK)
- WNYS-TV (Channel 43; SYRACUSE, NY; Owner: RKM MEDIA, INC.)
- WSTM-TV (Channel 3; SYRACUSE, NY; Owner: WSTM LICENSE SUBSIDIARY, INC.)
- W11BP (Channel 11; SYRACUSE, ETC., NY; Owner: RENARD COMMUNICATIONS CORP.)
- WSPX-TV (Channel 56; SYRACUSE, NY; Owner: PAXSON SYRACUSE LICENSE, INC.)
- WIXT-TV (Channel 9; SYRACUSE, NY; Owner: CENTRAL NY NEWS, INC.)
- WSYT (Channel 68; SYRACUSE, NY; Owner: WSYT LICENSEE L.P.)
- WTVU-LP (Channel 22; SYRACUSE, NY; Owner: RENARD COMMUNICATIONS CORP.)
- WOBX-LP (Channel 35; SYRACUSE, NY; Owner: METRO TV, INC.)
- WBLZ-LP (Channel 13; SYRACUSE, NY; Owner: RENARD COMMUNICATIONS CORP.)
- WSTQ-LP (Channel 14; SYRACUSE, NY; Owner: FEDERAL BROADCASTING COMPANY)
- WTVH (Channel 5; SYRACUSE, NY; Owner: WTVH LICENSE, INC.)
- W30AJ (Channel 30; SYRACUSE, NY; Owner: JOHN MESTER INCOME FAMILY TRUST)
- W51BA (Channel 51; SYRACUSE, NY; Owner: RENARD COMMUNICATIONS CORP.)
- WMBO-LP (Channel 60; SYRACUSE, ETC., NY; Owner: METRO TV, INC.)
- WNDR-LP (Channel 18; SYRACUSE, NY; Owner: METRO TV, INC.)
- W40BJ (Channel 40; DEWITT, NY; Owner: RENARD COMMUNICATIONS CORP.)
- W48AO (Channel 48; AUBURN, NY; Owner: SONNY PERSAD)
- W38CY (Channel 38; SYRACUSE, NY; Owner: NATIONAL MINORITY T.V., INC.)
- W54AK (Channel 54; AUBURN, NY; Owner: SONNY PERSAD)
- National Bridge Inventory (NBI) Statistics
- 43Number of bridges
- 433ft / 132mTotal length
- $60,068,000Total costs
- 370,127Total average daily traffic
- 14,622Total average daily truck traffic
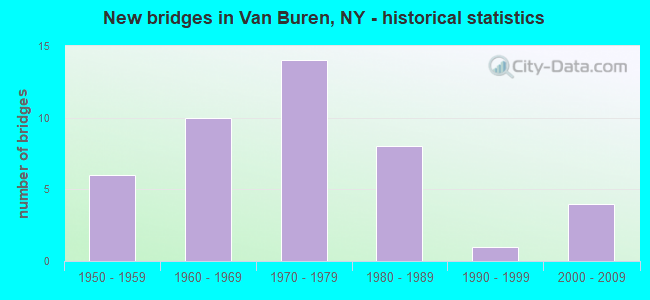
- New bridges - historical statistics
- 61950-1959
- 101960-1969
- 141970-1979
- 81980-1989
- 11990-1999
- 42000-2009
FCC Registered Cell Phone Towers:
1 (See the full list of FCC Registered Cell Phone Towers in Van Buren)FCC Registered Antenna Towers:
31 (See the full list of FCC Registered Antenna Towers)FCC Registered Private Land Mobile Towers:
1- 6813 Van Buren Rd (Lat: 43.100889 Lon: -76.281861), Type: Tower, Structure height: 43 m, Call Sign: WPHB650,
Assigned Frequencies: 929.762 MHz, Grant Date: 04/28/2000, Expiration Date: 04/28/2010, Cancellation Date: 10/02/2002, Certifier: Paul H Kuzia, Registrant: Wilkinson Barker Knauer, LLP, 2300 N Street, N.W., 7th Floor, Washington, DC 20037, Phone: (202) 783-4141, Fax: (202) 783-5851, Email:
FCC Registered Microwave Towers:
2- STATION, Asph Access Rd 350 Ft S Of Van Buren Rd Int (Lat: 42.445333 Lon: -79.401139), Overall height: 24.4 m, Call Sign: WNEY281,
Assigned Frequencies: 18000.0 MHz, Grant Date: 10/29/1999, Expiration Date: 10/27/2009, Cancellation Date: 02/24/2003, Certifier: Chris Kelly, Registrant: Keller And Heckman LLP, 1001 G Street, N.W. Suite 500 West, Washington, DC 20001, Phone: (202) 434-4130, Fax: (202) 434-4646, Email:
- VAN BUREN, 2 Mi Nw Of Warners (Lat: 43.105333 Lon: -76.358250), Overall height: 51.2 m, Call Sign: KEF75, Licensee ID: L00004625,
Assigned Frequencies: 10795.0 MHz, 10915.0 MHz, 10835.0 MHz, 10875.0 MHz, 11075.0 MHz, 10875.0 MHz, 10915.0 MHz, 10955.0 MHz, 11115.0 MHz, 10955.0 MHz... (+4 more), Grant Date: 08/29/2000, Expiration Date: 08/01/2010, Cancellation Date: 08/16/2002, Registrant: Verizon Ny, 395 Flatbush Ave Ext, Rm 506, Brooklyn, NY 11201, Phone: (718) 237-5337
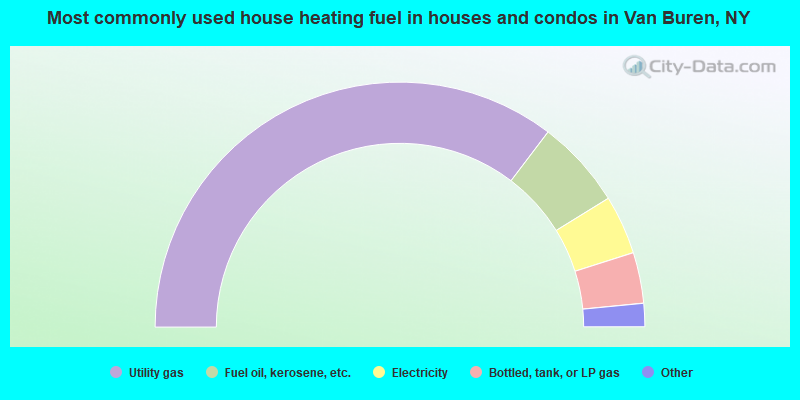
- 70.6%Utility gas
- 11.7%Fuel oil, kerosene, etc.
- 7.8%Electricity
- 6.7%Bottled, tank, or LP gas
- 1.8%Wood
- 1.0%Coal or coke
- 0.3%Other fuel
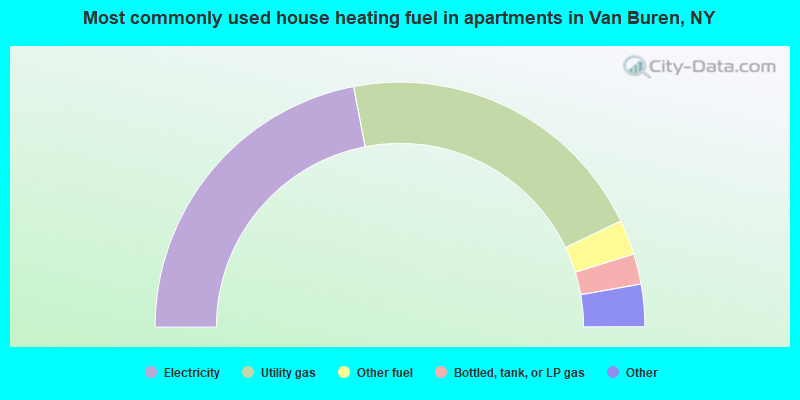
- 43.9%Electricity
- 41.8%Utility gas
- 4.6%Other fuel
- 4.0%Bottled, tank, or LP gas
- 3.4%Fuel oil, kerosene, etc.
- 2.2%No fuel used
Van Buren compared to New York state average:
- Median house value significantly below state average.
- Unemployed percentage significantly below state average.
- Black race population percentage significantly below state average.
- Hispanic race population percentage significantly below state average.
- Foreign-born population percentage significantly below state average.
- Length of stay since moving in significantly above state average.
- Number of rooms per house significantly below state average.
- House age significantly below state average.
Van Buren on our top lists:
- #15 on the list of "Top 101 cities with largest percentage of males in industries: groceries and related products merchant wholesalers (population 5,000+)"
- #31 on the list of "Top 101 cities with largest percentage of males in industries: electrical and electronic goods merchant wholesalers (population 5,000+)"
- #33 on the list of "Top 101 cities with largest percentage of males in industries: beverage and tobacco products (population 5,000+)"
- #34 on the list of "Top 101 cities with largest percentage of females in industries: recyclable material merchant wholesalers (population 5,000+)"
- #44 on the list of "Top 101 cities with largest percentage of males in occupations: bookkeeping, accounting, and auditing clerks (population 5,000+)"
- #44 on the list of "Top 101 cities with largest percentage of males in occupations: financial clerks except bookkeeping, accounting, and auditing clerks (population 5,000+)"
- #44 on the list of "Top 101 cities with largest percentage of females in occupations: religious workers (population 5,000+)"
- #47 on the list of "Top 101 cities with largest percentage of females in occupations: plant and system operators (population 5,000+)"
- #49 on the list of "Top 101 cities with largest percentage of males in industries: food and beverage stores (population 5,000+)"
- #53 on the list of "Top 101 cities with largest percentage of females in occupations: electrical equipment mechanics and other installation, maintenance, and repair occupations including supervisors (population 5,000+)"
- #53 on the list of "Top 101 cities with largest percentage of males in occupations: secondary school teachers (population 5,000+)"
- #62 on the list of "Top 101 cities with largest percentage of females in industries: alcoholic beverages merchant wholesalers (population 5,000+)"
- #67 on the list of "Top 101 cities with largest percentage of females in industries: metals and minerals, except petroleum, merchant wholesalers (population 5,000+)"
- #72 on the list of "Top 101 cities with largest percentage of females in industries: sewing, needlework, and piece goods stores (population 5,000+)"
- #77 on the list of "Top 101 cities with largest percentage of males in industries: gasoline stations (population 5,000+)"
- #100 on the list of "Top 101 cities with largest percentage of females in industries: warehousing and storage (population 5,000+)"
- #31 on the list of "Top 101 counties with the largest decrease in the number of infant deaths per 1000 residents 2000-2006 to 2007-2013 (pop. 50,000+)"
- #41 on the list of "Top 101 counties with the most Orthodox congregations"
- #42 on the list of "Top 101 counties with the most Catholic congregations"
- #64 on the list of "Top 101 counties with the lowest percentage of residents relocating from other counties between 2010 and 2011 (pop. 50,000+)"
- #65 on the list of "Top 101 counties with the lowest Sulfur Oxides Annual air pollution readings in 2012 (µg/m3)"