Hampshire County, West Virginia (WV)
County owner-occupied free and clear houses and condos in 2010: 3,125
County owner-occupied houses and condos in 2000: 6,450
Renter-occupied apartments: 1,873 (it was 1,505 in 2000)
| % of renters here: | 19% |
| State: | 27% |
Land area: 642 sq. mi.
Water area: 2.9 sq. mi.
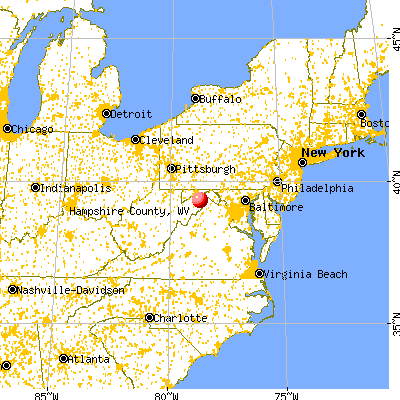
Population density: 36 people per square mile (low).
Industries providing employment: Educational, health and social services (22.4%), Manufacturing (16.3%), Construction (15.8%), Retail trade (11.7%).
Type of workers:
- Private wage or salary: 73%
- Government: 20%
- Self-employed, not incorporated: 7%
- Unpaid family work: 0%
- OSM Map
- General Map
- Google Map
- MSN Map

- 21,51893.4%White Non-Hispanic Alone
- 9944.3%Two or more races
- 3871.7%Hispanic or Latino
- 1080.5%Black Non-Hispanic Alone
- 240.1%American Indian and Alaska Native alone
- 170.07%Asian alone

| Median resident age: | 48.0 years |
| West Virginia median age: | 42.9 years |
| Males: 11,814 | |
| Females: 11,229 |

 | West Virginia...Southern or Northern? (474 replies) |
| Thinking about moving to Morgan County (36 replies) |
| Martinsburg Mall Redevelopment Project (724 replies) |
| Are most people in Appalachia of Scottish ancestry? (66 replies) |
| Climate & Healthcare in WV (9 replies) |
| Restaurants and Stores in Charleston are going up!!! (974 replies) |
| Hampshire County: | 2.0 people |
| West Virginia: | 2 people |
Estimated median household income in 2022: $54,333 ($31,666 in 1999)
| This county: | $54,333 |
| West Virginia: | $54,329 |
Median contract rent in 2022 for apartments: $533 (lower quartile is $311, upper quartile is $718)
| This county: | $533 |
| State: | $606 |
Estimated median house or condo value in 2022: $196,588 (it was $71,200 in 2000)
| Hampshire: | $196,588 |
| West Virginia: | $155,100 |
Median monthly housing costs for homes and condos with a mortgage: $1,074
Median monthly housing costs for units without a mortgage: $338
Institutionalized population: 475
Crime in 2021 (reported by the sheriff's office or county police, not the county total):
- Murders: 0
- Rapes: 0
- Robberies: 0
- Assaults: 2
- Burglaries: 4
- Thefts: 10
- Auto thefts: 0
Crime in 2020 (reported by the sheriff's office or county police, not the county total):
- Murders: 0
- Rapes: 0
- Robberies: 0
- Assaults: 30
- Burglaries: 24
- Thefts: 58
- Auto thefts: 7
Single-family new house construction building permits:
- 2022: 125 buildings, average cost: $184,400
- 2021: 126 buildings, average cost: $176,300
- 2020: 102 buildings, average cost: $132,700
- 2019: 88 buildings, average cost: $127,200
- 2018: 60 buildings, average cost: $157,000
- 2017: 57 buildings, average cost: $138,800
- 2016: 61 buildings, average cost: $129,600
- 2015: 92 buildings, average cost: $113,100
- 2014: 66 buildings, average cost: $116,100
- 2013: 55 buildings, average cost: $110,200
- 2012: 59 buildings, average cost: $153,900
- 2011: 38 buildings, average cost: $130,400
- 2010: 62 buildings, average cost: $121,800
- 2009: 53 buildings, average cost: $128,900
- 2008: 82 buildings, average cost: $139,900
- 2007: 186 buildings, average cost: $134,200
- 2006: 338 buildings, average cost: $109,200
- 2005: 293 buildings, average cost: $82,500
- 2004: 165 buildings, average cost: $93,700
- 2003: 171 buildings, average cost: $98,300
- 2002: 164 buildings, average cost: $96,800
- 2001: 127 buildings, average cost: $54,600
- 2000: 111 buildings, average cost: $112,900
- 1999: 111 buildings, average cost: $166,500
- 1998: 118 buildings, average cost: $67,000
- 1997: 5 buildings, average cost: $84,600


Median real estate property taxes paid for housing units with mortgages in 2022: $770 (0.4%)
Median real estate property taxes paid for housing units with no mortgage in 2022: $703 (0.4%)


| Hampshire County: | 18.6% |
| West Virginia: | 17.9% |
Median age of residents in 2022: 48.0 years old
(Males: 47.9 years old, Females: 47.7 years old)
(Median age for: White residents: 48.0 years old, Black residents: 74.0 years old, American Indian residents: 57.6 years old, Hispanic or Latino residents: 50.0 years old, Other race residents: 70.9 years old)
Area name: Winchester, VA HUD Metro FMR Area
Fair market rent in 2006 for a 1-bedroom apartment in Hampshire County is $490 a month.
Fair market rent for a 2-bedroom apartment is $647 a month.
Fair market rent for a 3-bedroom apartment is $893 a month.
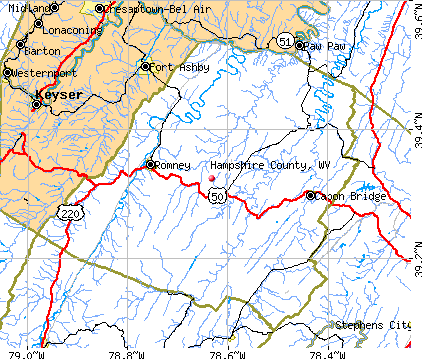
Cities in this county include: Romney, Springfield, Green Spring, Capon Bridge.
Neighboring counties: Christian County, Illinois  , Frederick County, Virginia
  , Jackson County, Kansas , Jefferson County, Kansas , Morgan County, Ohio , Winchester city, Virginia .
| Here: | 2.8% |
| West Virginia: | 4.0% |


Current college students: 474
People 25 years of age or older with a high school degree or higher: 87.7%
People 25 years of age or older with a bachelor's degree or higher: 14.6%
Number of foreign born residents: 222 (75.0% naturalized citizens)
| Hampshire County: | 1.0% |
| Whole state: | 1.8% |

- Year of entry for the foreign-born population
- 252010 or later
- 1132000 to 2009
- 171990 to 1999
- 321980 to 1989
- 141970 to 1979
- 46Before 1970
Mean travel time to work (commute): ' minutes
Percentage of county residents living and working in this county: 57.8%
Housing units in structures:
- One, detached: 9,916
- One, attached: 64
- Two: 60
- 3 or 4: 57
- 5 to 9: 247
- 10 to 19: 47
- 20 to 49: 39
- 50 or more: 6
- Mobile homes: 2,086
Housing units in Hampshire County with a mortgage: 3,121 (225 second mortgage, 28 home equity loan, 124 both second mortgage and home equity loan)
Houses without a mortgage: 32
| Here: | 8.6% with mortgage |
| State: | 97.1% with mortgage |
Religion statistics for Hampshire County
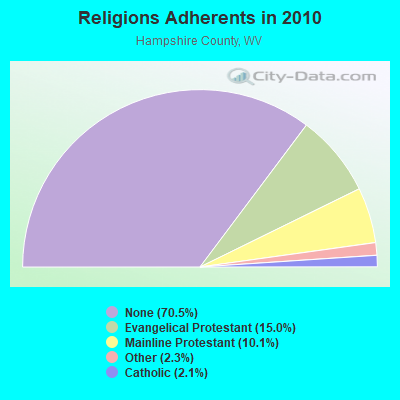
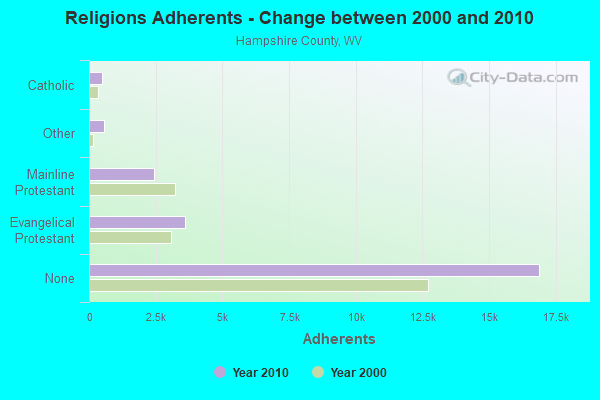
| Religion | Adherents | Congregations |
|---|---|---|
| Evangelical Protestant | 3,600 | 34 |
| Mainline Protestant | 2,425 | 29 |
| Other | 557 | 3 |
| Catholic | 496 | 1 |
| None | 16,886 | - |
Source: Clifford Grammich, Kirk Hadaway, Richard Houseal, Dale E.Jones, Alexei Krindatch, Richie Stanley and Richard H.Taylor. 2012. 2010 U.S.Religion Census: Religious Congregations & Membership Study. Association of Statisticians of American Religious Bodies. Jones, Dale E., et al. 2002. Congregations and Membership in the United States 2000. Nashville, TN: Glenmary Research Center.
Food Environment Statistics:
| Hampshire County: | 0.89 / 10,000 pop. |
| State: | 2.41 / 10,000 pop. |
| This county: | 0.44 / 10,000 pop. |
| West Virginia: | 1.09 / 10,000 pop. |
| Hampshire County: | 4.88 / 10,000 pop. |
| West Virginia: | 5.38 / 10,000 pop. |
| This county: | 6.21 / 10,000 pop. |
| State: | 6.22 / 10,000 pop. |
| Hampshire County: | 11.4% |
| West Virginia: | 12.2% |
| Hampshire County: | 31.3% |
| State: | 31.1% |
| Here: | 12.6% |
| State: | 13.1% |
Agriculture in Hampshire County:
Average size of farms: 218 acresAverage value of agricultural products sold per farm: $30,932
Average value of crops sold per acre for harvested cropland: $103.19
The value of nursery, greenhouse, floriculture, and sod as a percentage of the total market value of agricultural products sold: 3.00%
The value of livestock, poultry, and their products as a percentage of the total market value of agricultural products sold: 85.37%
Average total farm production expenses per farm: $24,336
Harvested cropland as a percentage of land in farms: 20.09%
Irrigated harvested cropland as a percentage of land in farms: 0.11%
Average market value of all machinery and equipment per farm: $40,094
The percentage of farms operated by a family or individual: 95.43%
Average age of principal farm operators: 57 years
Average number of cattle and calves per 100 acres of all land in farms: 13.38
Corn for grain: 395 harvested acres
All wheat for grain: 83 harvested acres
Vegetables: 53 harvested acres
Land in orchards: 1,517 acres
Earthquake activity:
Hampshire County-area historical earthquake activity is significantly above West Virginia state average. It is 50% smaller than the overall U.S. average.On 8/23/2011 at 17:51:04, a magnitude 5.8 (5.8 MW, Depth: 3.7 mi, Class: Moderate, Intensity: VI - VII) earthquake occurred 104.7 miles away from Hampshire County center
On 9/25/1998 at 19:52:52, a magnitude 5.2 (4.8 MB, 4.3 MS, 5.2 LG, 4.5 MW, Depth: 3.1 mi) earthquake occurred 176.4 miles away from the county center
On 8/25/2011 at 05:07:52, a magnitude 4.5 (4.5 ML, Depth: 4.2 mi, Class: Light, Intensity: IV - V) earthquake occurred 101.7 miles away from the county center
On 1/31/1986 at 16:46:43, a magnitude 5.0 (5.0 MB) earthquake occurred 206.2 miles away from the county center
On 12/9/2003 at 20:59:18, a magnitude 4.5 (4.5 ML, Depth: 6.2 mi) earthquake occurred 110.9 miles away from Hampshire County center
On 8/9/2020 at 12:07:37, a magnitude 5.1 (5.1 MW, Depth: 4.7 mi) earthquake occurred 238.3 miles away from the county center
Magnitude types: regional Lg-wave magnitude (LG), body-wave magnitude (MB), local magnitude (ML), surface-wave magnitude (MS), moment magnitude (MW)
Most recent natural disasters:
- West Virginia Covid-19 Pandemic, Incident Period: January 20, 2020, Major Disaster (Presidential) Declared DR-4517-WV: April 3, 2020, FEMA Id: 4517, Natural disaster type: Other
- West Virginia Severe Storms, Flooding, Landslides, And Mudslides, Incident Period: May 28, 2018 - June 3, 2018, FEMA Id: 4378, Natural disaster type: Storm, Mudslide, Landslide, Flood
- West Virginia Hurricane Sandy, Incident Period: October 29, 2012 to November 08, 2012, Emergency Declared EM-3358: October 29, 2012, FEMA Id: 3358, Natural disaster type: Hurricane
- West Virginia Severe Storms, Incident Period: June 29, 2012 to July 10, 2012, Emergency Declared EM-3345: June 30, 2012, FEMA Id: 3345, Natural disaster type: Storm
- West Virginia Severe Winter Storms and Snowstorms, Incident Period: February 05, 2010 to February 11, 2010, Major Disaster (Presidential) Declared DR-1903: April 23, 2010, FEMA Id: 1903, Natural disaster type: Snowstorm, Winter Storm
- West Virginia Hurricane Katrina Evacuation, Incident Period: August 29, 2005 to October 01, 2005, Emergency Declared EM-3221: September 05, 2005, FEMA Id: 3221, Natural disaster type: Hurricane
- West Virginia Hurricane Isabel, Incident Period: September 18, 2003 to September 30, 2003, Major Disaster (Presidential) Declared DR-1496: September 23, 2003, FEMA Id: 1496, Natural disaster type: Hurricane
- West Virginia Hurricane Fran, Incident Period: September 05, 1996 to September 08, 1996, Major Disaster (Presidential) Declared DR-1137: September 11, 1996, FEMA Id: 1137, Natural disaster type: Hurricane
- West Virginia Flooding, Incident Period: January 19, 1996 to February 02, 1996, Major Disaster (Presidential) Declared DR-1096: January 25, 1996, FEMA Id: 1096, Natural disaster type: Flood
- West Virginia Blizzard, Incident Period: January 06, 1996 to January 12, 1996, Major Disaster (Presidential) Declared DR-1084: January 13, 1996, FEMA Id: 1084, Natural disaster type: Blizzard
- 6 other natural disasters have been reported since 1953.
The number of natural disasters in Hampshire County (16) is near the US average (15).
Major Disasters (Presidential) Declared: 9
Emergencies Declared: 6
Causes of natural disasters: Floods: 4, Hurricanes: 4, Storms: 3, Droughts: 2, Winter Storms: 2, Blizzard: 1, Landslide: 1, Mudslide: 1, Snowfall: 1, Snowstorm: 1, Tropical Storm: 1, Other: 1 (Note: some incidents may be assigned to more than one category).

Means of transportation to work:
- Drove a car alone: 3,775 (80.3%)
- Carpooled: 190 (4.0%)
- Bus: 20 (0.4%)
- Taxicab, motorcycle, or other means: 29 (0.6%)
- Walked: 73 (1.6%)
- Worked at home: 677 (14.4%)


- Health care and social assistance (19%)
- Educational services (16%)
- Retail trade (13%)
- Public administration (5%)
- Manufacturing (5%)
- Accommodation and food services (5%)
- Other services, except public administration (4%)

- Health care and social assistance (23%)
- Educational services (20%)
- Retail trade (16%)
- Public administration (6%)
- Manufacturing (6%)
- Accommodation and food services (6%)
- Other services, except public administration (6%)

- Management occupations (13%)
- Construction and extraction occupations (13%)
- Production occupations (12%)
- Transportation occupations (11%)
- Material moving occupations (11%)
- Sales and related occupations (7%)
- Installation, maintenance, and repair occupations (7%)

- Office and administrative support occupations (20%)
- Educational instruction, and library occupations (12%)
- Sales and related occupations (11%)
- Healthcare support occupations (8%)
- Health diagnosing and treating practitioners and other technical occupations (7%)
- Management occupations (7%)
- Material moving occupations (5%)

- Kuwait (37%)
- Germany (11%)
- Philippines (8%)
- Dominican Republic (7%)
- India (5%)
- Cuba (5%)
- Honduras (5%)

- English (29%)
- German (22%)
- American (14%)
- Irish (11%)
- Scottish (3%)
- Italian (2%)
- Lithuanian (2%)


People in group quarters in Hampshire County, West Virginia in 2010:
- 250 people in local jails and other municipal confinement facilities
- 92 people in nursing facilities/skilled-nursing facilities
- 91 people in residential schools for people with disabilities
- 27 people in residential treatment centers for adults
- 23 people in group homes for juveniles (non-correctional)
- 13 people in state prisons
- 6 people in residential treatment centers for juveniles (non-correctional)
- 6 people in group homes intended for adults
People in group quarters in Hampshire County, West Virginia in 2000:
- 109 people in local jails and other confinement facilities (including police lockups)
- 102 people in nursing homes
- 87 people in institutions for the deaf
- 44 people in homes for the mentally retarded
- 38 people in institutions for the blind
- 18 people in homes or halfway houses for drug/alcohol abuse
- 9 people in religious group quarters
- 8 people in other noninstitutional group quarters
- 5 people in homes for the mentally ill
7.17% of this county's 2021 resident taxpayers lived in other counties in 2020 ($52,470 average adjusted gross income)
| Here: | 7.17% |
| West Virginia average: | 5.74% |
10 or fewer of this county's residents moved from foreign countries.
2.56% relocated from other counties in West Virginia ($14,903 average AGI)
4.61% relocated from other states ($37,567 average AGI)
Hampshire County: 4.61% West Virginia average: 3.02%

Top counties from which taxpayers relocated into this county between 2020 and 2021:
| from Frederick County, VA | |
| from Berkeley County, WV | |
| from Mineral County, WV | |
| from Hardy County, WV | |
| from Morgan County, WV | |
| from Winchester city, VA |
4.97% of this county's 2020 resident taxpayers moved to other counties in 2021 ($41,663 average adjusted gross income)
| Here: | 4.97% |
| West Virginia average: | 5.65% |
10 or fewer of this county's residents moved to foreign countries.
2.20% relocated to other counties in West Virginia ($17,019 average AGI)
2.78% relocated to other states ($24,644 average AGI)
Hampshire County: 2.78% West Virginia average: 2.93%

Top counties to which taxpayers relocated from this county between 2020 and 2021:
| to Mineral County, WV | |
| to Frederick County, VA | |
| to Hardy County, WV | |
| to Berkeley County, WV | |
| to Winchester city, VA |
Births per 1000 population from 1990 to 1999: 12.0
Births per 1000 population from 2000 to 2006: 10.9

Deaths per 1000 population from 1990 to 1999: 9.5
Deaths per 1000 population from 2000 to 2009: 9.5
Deaths per 1000 population from 2010 to 2020: 11.5

Infant deaths per 1000 live births from 1990 to 1999: 7.6
Infant deaths per 1000 live births from 2000 to 2006: 8.6

Persons under 19 years old without health insurance coverage in 2018: 5.1%


Persons enrolled in hospital insurance and/or supplemental medical insurance (Medicare) in July 1, 2007: 4,009 (3,199 aged, 810 disabled)
Children under 18 without health insurance coverage in 2007: 756 (15%)


Most common underlying causes of death in Hampshire County, West Virginia in 1999 - 2019:
- Bronchus or lung, unspecified - Malignant neoplasms (373)
- Atherosclerotic heart disease (368)
- Acute myocardial infarction, unspecified (219)
- Chronic obstructive pulmonary disease, unspecified (200)
- Unspecified dementia (20)
- Congestive heart failure (13)
- Accidental poisoning by and exposure to other and unspecified drugs, medicaments and biological substances (11)
- Unspecified diabetes mellitus, without complications (11)
- Colon, unspecified - Malignant neoplasms (10)
- Volume depletion (10)
Population without health insurance coverage in 2000: 12%
Children under 18 without health insurance coverage in 2000: 8%
Short term general hospital admissions per 100,000 population in 2004: 2,061
Short term general hospital beds per 100,000 population in 2004: 204
Emergency room visits per 100,000 population in 2004: 28,224
General practice office based MDs per 100,000 population in 2005: 1,035
Medical specialist MDs per 100,000 population in 2005: 931
Total births per 100,000 population, July 2005 - July 2006 : 21
Total deaths per 100,000 population, July 2005 - July 2006: 41
Limited-service eating places per 100,000 population in 2005 : 5
Household type by relationship:
Households: 23,043- Male householders: 4,411 (1,529 living alone), Female householders: 3,873 (1,190 living alone)
3,932 spouses (3,932 opposite-sex spouses), 497 unmarried partners, (475 opposite-sex unmarried partners), 6,741 children (6,239 natural, 11 adopted, 437 stepchildren), 537 grandchildren, 445 brothers or sisters, 552 parents, 0 foster children, 372 other relatives, 884 non-relatives
- In group quarters: 550
Size of family households: 3,099 2-persons, 992 3-persons, 641 4-persons, 268 5-persons, 129 6-persons, 89 7-or-more-persons.
Size of nonfamily households: 2,713 1-person, 298 2-persons, 53 3-persons.
2,364 married couples with children.
1,333 single-parent households (284 men, 1,049 women).
98.9% of residents of Hampshire speak English at home.
1.0% of residents speak Spanish at home (93% speak English very well, 7% speak English not well).
0.2% of residents speak other Indo-European language at home (67% speak English very well, 33% speak English well).
In fiscal year 2004:
Federal Government expenditure: $106,641,000 ($4,950 per capita)
Department of Defense expenditure: $3,403,000
Federal direct payments to individuals for retirement and disability: $56,811,000
Federal other direct payments to individuals: $20,621,000
Federal direct payments not to individuals: $1,199,000
Federal grants: $24,213,000
Federal procurement contracts: $598,000 ($2,000 Department of Defense)
Federal salaries and wages: $3,200,000 ($253,000 Department of Defense)
Federal Government direct loans: $459,000
Federal guaranteed/insured loans: $6,268,000
Federal Government insurance: $15,982,000
Population change from April 1, 2000 to July 1, 2005:
Births: 1,211| Here: | 55 per 1000 residents |
| State: | 60 per 1000 residents |
Deaths: 1,087
| Here: | 49 per 1000 residents |
| State: | 61 per 1000 residents |
Net international migration: +24
| Here: | +1 per 1000 residents |
| State: | +2 per 1000 residents |
Net internal migration: +1,714
| Here: | +78 per 1000 residents |
| State: | +6 per 1000 residents |

Total withdrawal of fresh water for public supply: 0.57 millions of gallons per day (28% from ground, 72% from surface)
| Here: | 6.4 |
| State: | 6.5 |
| Here: | 4.8 |
| State: | 4.7 |

- Year house built in Hampshire County, West Virginia
- 302020 or later
- 7382010 to 2019
- 2,2892000 to 2009
- 2,3361990 to 1999
- 2,7501980 to 1989
- 1,4371970 to 1979
- 6361960 to 1969
- 7191950 to 1959
- 3321940 to 1949
- 1,3051939 or earlier

- Rooms in owner-occupied houses in Hampshire County, West Virginia
- 331 room
- 572 rooms
- 1633 rooms
- 3754 rooms
- 1,4135 rooms
- 1,6426 rooms
- 9417 rooms
- 9258 rooms
- 1,2009+ rooms

- Rooms in renter-occupied apartments in Hampshire County, West Virginia
- 481 room
- 1332 rooms
- 1343 rooms
- 3364 rooms
- 2835 rooms
- 2766 rooms
- 2497 rooms
- 458 rooms
- 499+ rooms

- Bedrooms in owner-occupied houses in Hampshire County, West Virginia
- 48no bedroom
- 1561 bedroom
- 1,1492 bedrooms
- 4,0793 bedrooms
- 9564 bedrooms
- 4025+ bedrooms

- Bedrooms in renter-occupied apartments in Hampshire County, West Virginia
- 94no bedroom
- 1951 bedroom
- 5722 bedrooms
- 5653 bedrooms
- 364 bedrooms
- 525+ bedrooms

- Cars and other vehicles available in Hampshire County in owner-occupied houses/condos
- 191no vehicle
- 1,3541 vehicle
- 2,6482 vehicles
- 1,5703 vehicles
- 5324 vehicles
- 4155+ vehicles

- Cars and other vehicles available in Hampshire County in renter-occupied apartments
- 232no vehicle
- 5931 vehicle
- 5822 vehicles
- 1183 vehicles
- 54 vehicles
- 05+ vehicles
93.6% of Hampshire County residents lived in the same house 1 years ago.
Out of people who lived in different houses, 29% lived in this county.
Out of people who lived in different counties, 33% lived in West Virginia.
| Hampshire County: | 93.6% |
| State average: | 89.6% |
Place of birth for U.S.-born residents:
- This state: 7,105
- Other state: 16,072
- Northeast: 1,895
- Midwest: 664
- South: 13,261
- West: 417


- 47.9%Electricity
- 24.8%Wood
- 13.6%Bottled, tank, or LP gas
- 9.8%Fuel oil, kerosene, etc.
- 3.2%Utility gas
- 0.5%Other fuel
- 0.2%No fuel used

- 59.0%Electricity
- 20.3%Fuel oil, kerosene, etc.
- 16.6%Wood
- 2.1%Utility gas
- 1.5%Bottled, tank, or LP gas
- 0.5%Other fuel
Private vs. public school enrollment:
| Here: | 22.6% |
| West Virginia: | 12.2% |
| Here: | 7.9% |
| West Virginia: | 8.8% |
| Here: | 1.8% |
| West Virginia: | 17.3% |


Hampshire County government finances - Expenditure in 2018:
- Charges - Other: $1,948,000
Other: $835,000
Parks and Recreation: $457,000
Parks and Recreation: $42,000
- Construction - General - Other: $1,214,000
General - Other: $345,000
- Current Operations - Central Staff Services: $4,794,000
Central Staff Services: $4,425,000
Police Protection: $3,215,000
Police Protection: $2,824,000
Judicial and Legal Services: $1,016,000
Financial Administration: $895,000
General - Other: $855,000
Financial Administration: $804,000
Judicial and Legal Services: $703,000
Health - Other: $590,000
Health - Other: $529,000
General - Other: $518,000
Public Welfare - Other: $229,000
Libraries: $209,000
Parks and Recreation: $201,000
Parks and Recreation: $173,000
Natural Resources - Other: $97,000
Solid Waste Management: $69,000
Solid Waste Management: $54,000
Natural Resources - Other: $26,000
Public Welfare - Other: $7,000
- Federal Intergovernmental - Health and Hospitals: $83,000
Other: $75,000
Other: $69,000
Natural Resources: $50,000
Health and Hospitals: $23,000
General Local Government Support: $12,000
- General - Interest on Debt: $67,000
Interest on Debt: $31,000
- Long Term Debt - Beginning Outstanding - Unspecified Public Purpose: $894,000
Outstanding Unspecified Public Purpose: $839,000
Beginning Outstanding - Unspecified Public Purpose: $784,000
Outstanding Unspecified Public Purpose: $729,000
Retired Unspecified Public Purpose: $55,000
Retired Unspecified Public Purpose: $55,000
- Miscellaneous - General Revenue - Other: $771,000
General Revenue - Other: $572,000
Fines and Forfeits: $332,000
Interest Earnings: $181,000
Sale of Property: $180,000
Donations From Private Sources: $92,000
Interest Earnings: $25,000
- Other Capital Outlay - General - Other: $92,000
- Other Funds - Cash and Securities: $8,377,000
Cash and Securities: $7,410,000
- State Intergovernmental - Health and Hospitals: $206,000
Other: $201,000
Other: $165,000
Health and Hospitals: $163,000
General Local Government Support: $154,000
General Local Government Support: $105,000
Highways: $15,000
- Tax - Property: $6,545,000
Property: $5,807,000
Other: $318,000
Other License: $116,000
Other Selective Sales: $100,000
Other License: $60,000
Other Selective Sales: $50,000
Alcoholic Beverage Sales: $10,000
Alcoholic Beverage Sales: $3,000
- Total Salaries and Wages: $4,043,000
Hampshire County government finances - Revenue in 2018:
- Charges - Other: $1,948,000
Other: $835,000
Parks and Recreation: $457,000
Parks and Recreation: $42,000
- Construction - General - Other: $1,214,000
General - Other: $345,000
- Current Operations - Central Staff Services: $4,794,000
Central Staff Services: $4,425,000
Police Protection: $3,215,000
Police Protection: $2,824,000
Judicial and Legal Services: $1,016,000
Financial Administration: $895,000
General - Other: $855,000
Financial Administration: $804,000
Judicial and Legal Services: $703,000
Health - Other: $590,000
Health - Other: $529,000
General - Other: $518,000
Public Welfare - Other: $229,000
Libraries: $209,000
Parks and Recreation: $201,000
Parks and Recreation: $173,000
Natural Resources - Other: $97,000
Solid Waste Management: $69,000
Solid Waste Management: $54,000
Natural Resources - Other: $26,000
Public Welfare - Other: $7,000
- Federal Intergovernmental - Health and Hospitals: $83,000
Other: $75,000
Other: $69,000
Natural Resources: $50,000
Health and Hospitals: $23,000
General Local Government Support: $12,000
- General - Interest on Debt: $67,000
Interest on Debt: $31,000
- Long Term Debt - Beginning Outstanding - Unspecified Public Purpose: $894,000
Outstanding Unspecified Public Purpose: $839,000
Beginning Outstanding - Unspecified Public Purpose: $784,000
Outstanding Unspecified Public Purpose: $729,000
Retired Unspecified Public Purpose: $55,000
Retired Unspecified Public Purpose: $55,000
- Miscellaneous - General Revenue - Other: $771,000
General Revenue - Other: $572,000
Fines and Forfeits: $332,000
Interest Earnings: $181,000
Sale of Property: $180,000
Donations From Private Sources: $92,000
Interest Earnings: $25,000
- Other Capital Outlay - General - Other: $92,000
- Other Funds - Cash and Securities: $8,377,000
Cash and Securities: $7,410,000
- State Intergovernmental - Health and Hospitals: $206,000
Other: $201,000
Other: $165,000
Health and Hospitals: $163,000
General Local Government Support: $154,000
General Local Government Support: $105,000
Highways: $15,000
- Tax - Property: $6,545,000
Property: $5,807,000
Other: $318,000
Other License: $116,000
Other Selective Sales: $100,000
Other License: $60,000
Other Selective Sales: $50,000
Alcoholic Beverage Sales: $10,000
Alcoholic Beverage Sales: $3,000
- Total Salaries and Wages: $4,043,000
Hampshire County government finances - Debt in 2018:
- Charges - Other: $1,948,000
Other: $835,000
Parks and Recreation: $457,000
Parks and Recreation: $42,000
- Construction - General - Other: $1,214,000
General - Other: $345,000
- Current Operations - Central Staff Services: $4,794,000
Central Staff Services: $4,425,000
Police Protection: $3,215,000
Police Protection: $2,824,000
Judicial and Legal Services: $1,016,000
Financial Administration: $895,000
General - Other: $855,000
Financial Administration: $804,000
Judicial and Legal Services: $703,000
Health - Other: $590,000
Health - Other: $529,000
General - Other: $518,000
Public Welfare - Other: $229,000
Libraries: $209,000
Parks and Recreation: $201,000
Parks and Recreation: $173,000
Natural Resources - Other: $97,000
Solid Waste Management: $69,000
Solid Waste Management: $54,000
Natural Resources - Other: $26,000
Public Welfare - Other: $7,000
- Federal Intergovernmental - Health and Hospitals: $83,000
Other: $75,000
Other: $69,000
Natural Resources: $50,000
Health and Hospitals: $23,000
General Local Government Support: $12,000
- General - Interest on Debt: $67,000
Interest on Debt: $31,000
- Long Term Debt - Beginning Outstanding - Unspecified Public Purpose: $894,000
Outstanding Unspecified Public Purpose: $839,000
Beginning Outstanding - Unspecified Public Purpose: $784,000
Outstanding Unspecified Public Purpose: $729,000
Retired Unspecified Public Purpose: $55,000
Retired Unspecified Public Purpose: $55,000
- Miscellaneous - General Revenue - Other: $771,000
General Revenue - Other: $572,000
Fines and Forfeits: $332,000
Interest Earnings: $181,000
Sale of Property: $180,000
Donations From Private Sources: $92,000
Interest Earnings: $25,000
- Other Capital Outlay - General - Other: $92,000
- Other Funds - Cash and Securities: $8,377,000
Cash and Securities: $7,410,000
- State Intergovernmental - Health and Hospitals: $206,000
Other: $201,000
Other: $165,000
Health and Hospitals: $163,000
General Local Government Support: $154,000
General Local Government Support: $105,000
Highways: $15,000
- Tax - Property: $6,545,000
Property: $5,807,000
Other: $318,000
Other License: $116,000
Other Selective Sales: $100,000
Other License: $60,000
Other Selective Sales: $50,000
Alcoholic Beverage Sales: $10,000
Alcoholic Beverage Sales: $3,000
- Total Salaries and Wages: $4,043,000
Hampshire County government finances - Cash and Securities in 2018:
- Charges - Other: $1,948,000
Other: $835,000
Parks and Recreation: $457,000
Parks and Recreation: $42,000
- Construction - General - Other: $1,214,000
General - Other: $345,000
- Current Operations - Central Staff Services: $4,794,000
Central Staff Services: $4,425,000
Police Protection: $3,215,000
Police Protection: $2,824,000
Judicial and Legal Services: $1,016,000
Financial Administration: $895,000
General - Other: $855,000
Financial Administration: $804,000
Judicial and Legal Services: $703,000
Health - Other: $590,000
Health - Other: $529,000
General - Other: $518,000
Public Welfare - Other: $229,000
Libraries: $209,000
Parks and Recreation: $201,000
Parks and Recreation: $173,000
Natural Resources - Other: $97,000
Solid Waste Management: $69,000
Solid Waste Management: $54,000
Natural Resources - Other: $26,000
Public Welfare - Other: $7,000
- Federal Intergovernmental - Health and Hospitals: $83,000
Other: $75,000
Other: $69,000
Natural Resources: $50,000
Health and Hospitals: $23,000
General Local Government Support: $12,000
- General - Interest on Debt: $67,000
Interest on Debt: $31,000
- Long Term Debt - Beginning Outstanding - Unspecified Public Purpose: $894,000
Outstanding Unspecified Public Purpose: $839,000
Beginning Outstanding - Unspecified Public Purpose: $784,000
Outstanding Unspecified Public Purpose: $729,000
Retired Unspecified Public Purpose: $55,000
Retired Unspecified Public Purpose: $55,000
- Miscellaneous - General Revenue - Other: $771,000
General Revenue - Other: $572,000
Fines and Forfeits: $332,000
Interest Earnings: $181,000
Sale of Property: $180,000
Donations From Private Sources: $92,000
Interest Earnings: $25,000
- Other Capital Outlay - General - Other: $92,000
- Other Funds - Cash and Securities: $8,377,000
Cash and Securities: $7,410,000
- State Intergovernmental - Health and Hospitals: $206,000
Other: $201,000
Other: $165,000
Health and Hospitals: $163,000
General Local Government Support: $154,000
General Local Government Support: $105,000
Highways: $15,000
- Tax - Property: $6,545,000
Property: $5,807,000
Other: $318,000
Other License: $116,000
Other Selective Sales: $100,000
Other License: $60,000
Other Selective Sales: $50,000
Alcoholic Beverage Sales: $10,000
Alcoholic Beverage Sales: $3,000
- Total Salaries and Wages: $4,043,000
Supplemental Security Income (SSI) in 2006:
- Total number of recipients: 728
- Number of aged recipients: 72
- Number of blind and disabled recipients: 656
- Number of recipients under 18: 117
- Number of recipients between 18 and 64: 445
- Number of recipients older than 64: 166
- Number of recipients also receiving OASDI: 297
- Amount of payments (thousands of dollars): 290
| Most common first names in Hampshire County, WV among deceased individuals | ||
| Name | Count | Lived (average) |
|---|---|---|
| Mary | 53 | 75.8 years |
| John | 47 | 71.9 years |
| James | 44 | 75.7 years |
| William | 44 | 70.6 years |
| Robert | 40 | 71.4 years |
| Charles | 33 | 77.6 years |
| George | 30 | 76.6 years |
| Virginia | 25 | 78.8 years |
| Edward | 20 | 70.7 years |
| Anna | 19 | 80.2 years |
| Most common last names in Hampshire County, WV among deceased individuals | ||
| Last name | Count | Lived (average) |
|---|---|---|
| Haines | 37 | 76.1 years |
| Smith | 32 | 80.3 years |
| Hott | 30 | 75.3 years |
| Saville | 30 | 80.1 years |
| Wolford | 27 | 77.1 years |
| Miller | 27 | 76.8 years |
| Ganoe | 20 | 76.3 years |
| Lewis | 20 | 71.8 years |
| Davis | 20 | 81.0 years |
| Corbin | 20 | 79.7 years |
| Businesses in Hampshire County, WV | ||||
| Name | Count | Name | Count | |
|---|---|---|---|---|
| 7-Eleven | 1 | H&R Block | 1 | |
| Advance Auto Parts | 1 | La-Z-Boy | 1 | |
| Burger King | 1 | McDonald's | 1 | |
| CVS | 1 | Rite Aid | 1 | |
| Chevrolet | 1 | Subway | 1 | |
| Dairy Queen | 1 | U-Haul | 1 | |
| Domino's Pizza | 1 | U.S. Cellular | 1 | |
| FedEx | 1 | UPS | 1 | |
| GNC | 1 | |||