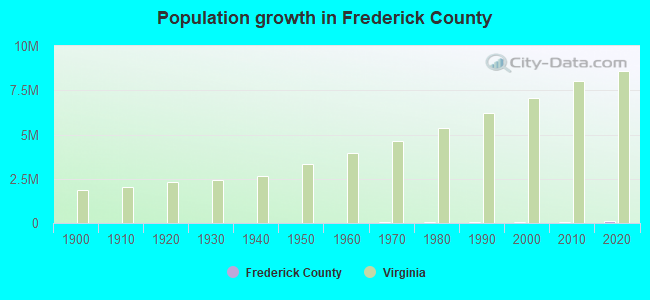
Frederick County, Virginia (VA)
County owner-occupied free and clear houses and condos in 2010: 5,711
County owner-occupied houses and condos in 2000: 17,754
Renter-occupied apartments: 6,191 (it was 4,343 in 2000)
| % of renters here: | 20% |
| State: | 33% |
Land area: 415 sq. mi.
Water area: 1.0 sq. mi.
Population density: 229 people per square mile (high).
Industries providing employment: Educational, health and social services (21.8%), Professional, scientific, management, administrative, and waste management services (13.1%), Retail trade (10.9%), Manufacturing (10.0%).
Type of workers:
- Private wage or salary: 77%
- Government: 18%
- Self-employed, not incorporated: 5%
- Unpaid family work: 0%
- OSM Map
- General Map
- Google Map
- MSN Map

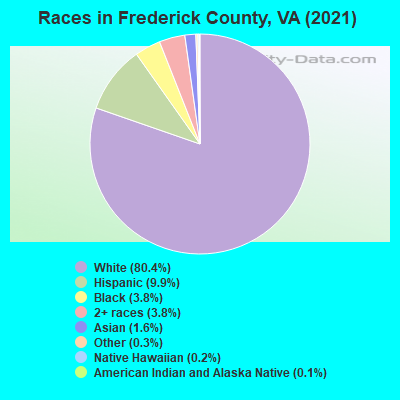
- 74,46178.3%White Non-Hispanic Alone
- 10,83211.4%Hispanic or Latino
- 3,5953.8%Black Non-Hispanic Alone
- 3,4113.6%Two or more races
- 2,1022.2%Asian alone
- 4300.5%Some other race alone
- 1280.1%Native Hawaiian and Other
Pacific Islander alone - 920.10%American Indian and Alaska Native alone
| Median resident age: | 41.3 years |
| Virginia median age: | 39.0 years |
| Males: 47,965 | |
| Females: 47,086 |

 | Job relocation to Winchester. Seeking Winchester VA or Purcellville information. Thanks so much (13 replies) |
| Census Releases New CDPs for Virginia, 2020-2030 (5 replies) |
| Young family possibly moving to Winchester (16 replies) |
| Moving to Frederick Co - Advice? (7 replies) |
| Where is Northern Virginia? (25 replies) |
| Metro Silver Line and the Resurgence of Catoctin County (110 replies) |
| Frederick County: | 2.0 people |
| Virginia: | 3 people |
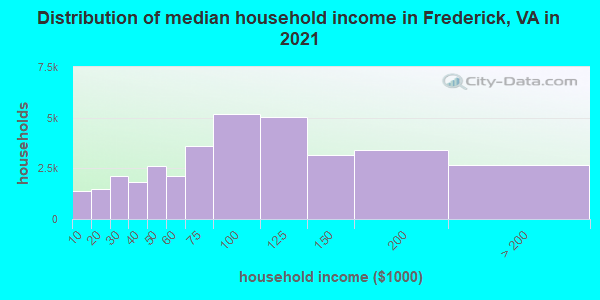
Estimated median household income in 2022: $98,870 ($46,941 in 1999)
| This county: | $98,870 |
| Virginia: | $85,873 |
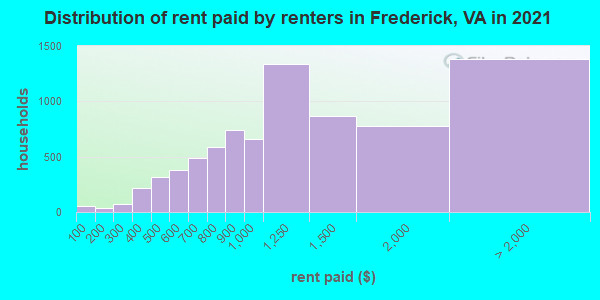
Median contract rent in 2022 for apartments: $1,361 (lower quartile is $1,097, upper quartile is $1,741)
| This county: | $1361 |
| State: | $1270 |
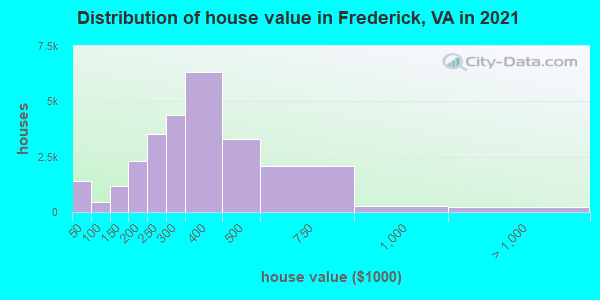
Estimated median house or condo value in 2022: $366,600 (it was $114,300 in 2000)
| Frederick: | $366,600 |
| Virginia: | $365,700 |
Mean price in 2022:
Median monthly housing costs for homes and condos with a mortgage: $1,693Detached houses: $400,552
Here: $400,552 State: $472,865 Townhouses or other attached units: $281,948
Here: $281,948 State: $457,437 In 5-or-more-unit structures: $165,182
Here: $165,182 State: $382,551 Mobile homes: $34,463
Here: $34,463 State: $100,736
Median monthly housing costs for units without a mortgage: $512
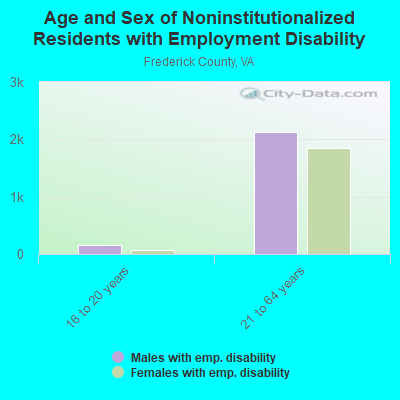
Institutionalized population: 727
Crime in 2021 (reported by the sheriff's office or county police, not the county total):
- Murders: 2
- Rapes: 16
- Robberies: 6
- Assaults: 37
- Burglaries: 65
- Thefts: 695
- Auto thefts: 86
Crime in 2020 (reported by the sheriff's office or county police, not the county total):
- Murders: 3
- Rapes: 16
- Robberies: 6
- Assaults: 48
- Burglaries: 97
- Thefts: 700
- Auto thefts: 83
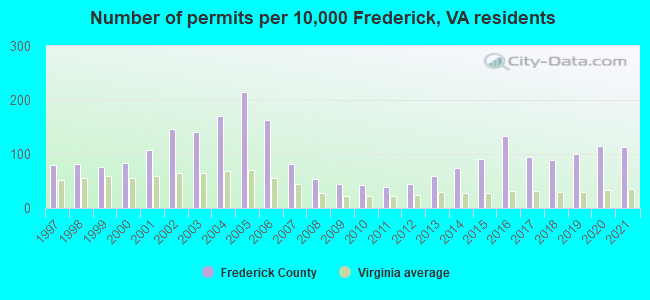
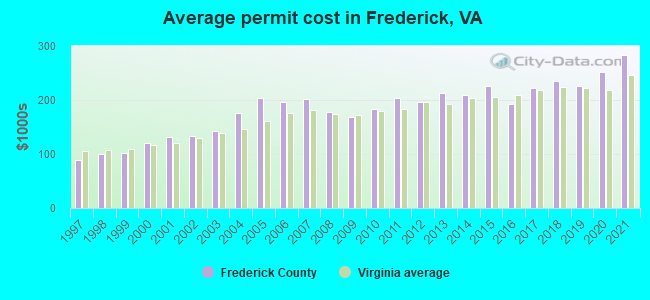
Single-family new house construction building permits:
- 2022: 594 buildings, average cost: $293,300
- 2021: 667 buildings, average cost: $283,100
- 2020: 678 buildings, average cost: $252,300
- 2019: 594 buildings, average cost: $225,500
- 2018: 525 buildings, average cost: $236,400
- 2017: 562 buildings, average cost: $222,900
- 2016: 791 buildings, average cost: $191,900
- 2015: 532 buildings, average cost: $224,900
- 2014: 436 buildings, average cost: $209,600
- 2013: 357 buildings, average cost: $213,400
- 2012: 266 buildings, average cost: $196,200
- 2011: 229 buildings, average cost: $204,000
- 2010: 247 buildings, average cost: $183,500
- 2009: 268 buildings, average cost: $168,200
- 2008: 322 buildings, average cost: $177,900
- 2007: 485 buildings, average cost: $202,300
- 2006: 967 buildings, average cost: $195,900
- 2005: 1271 buildings, average cost: $203,100
- 2004: 1005 buildings, average cost: $176,100
- 2003: 828 buildings, average cost: $143,100
- 2002: 866 buildings, average cost: $132,800
- 2001: 631 buildings, average cost: $132,400
- 2000: 500 buildings, average cost: $119,800
- 1999: 452 buildings, average cost: $101,000
- 1998: 485 buildings, average cost: $100,000
- 1997: 475 buildings, average cost: $88,600
Median real estate property taxes paid for housing units with mortgages in 2022: $1,854 (0.5%)
Median real estate property taxes paid for housing units with no mortgage in 2022: $1,819 (0.5%)
| Frederick County: | 6.6% |
| Virginia: | 10.6% |
Median age of residents in 2022: 41.3 years old
(Males: 39.3 years old, Females: 43.3 years old)
(Median age for: White residents: 44.4 years old, Black residents: 35.6 years old, American Indian residents: 19.7 years old, Asian residents: 33.6 years old, Hispanic or Latino residents: 26.6 years old, Other race residents: 35.4 years old)
Area name: Winchester, VA HUD Metro FMR Area
Fair market rent in 2006 for a 1-bedroom apartment in Frederick County is $490 a month.
Fair market rent for a 2-bedroom apartment is $647 a month.
Fair market rent for a 3-bedroom apartment is $893 a month.
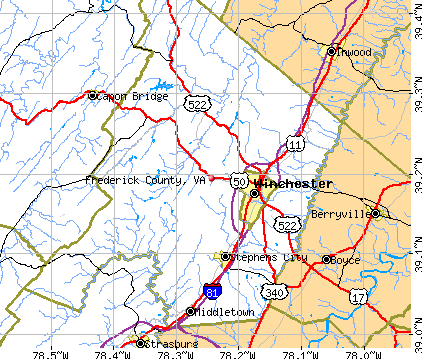
Cities in this county include: Winchester, Lake Holiday, Shawneeland, Stephens City, Middletown.
2023 air pollution in Frederick County:
Ozone (1-hour): 0.032 ppm (standard limit: 0.12 ppm). Near U.S. average.
Particulate Matter (PM10) Annual: 20.1 µg/m3. Near U.S. average.
Particulate Matter (PM2.5) Annual: 10.6 µg/m3(standard limit: 15.0 µg/m3). Near U.S. average.
Neighboring counties: Anne Arundel County, Maryland  , Hampshire County, West Virginia
  , Morgan County, Ohio
  , Platte County, Missouri , Winchester city .
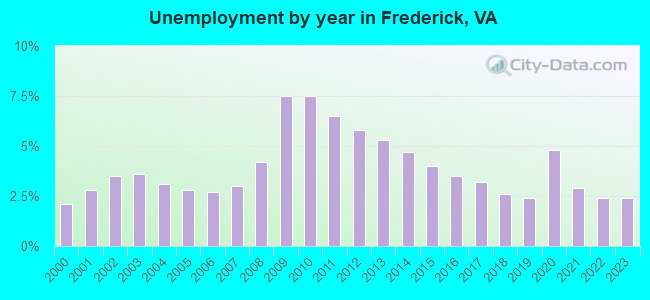
| Here: | 2.4% |
| Virginia: | 2.7% |
Current college students: 1,918
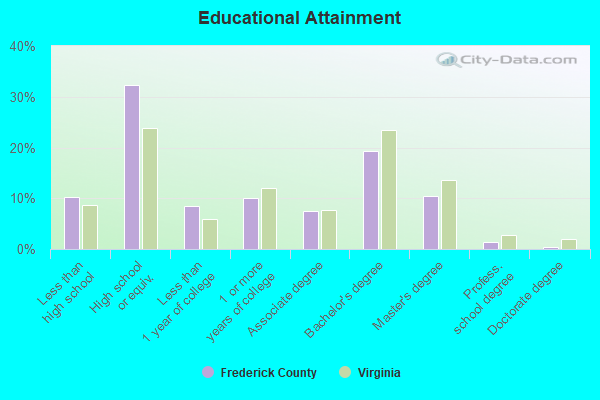
People 25 years of age or older with a high school degree or higher: 91.6%
People 25 years of age or older with a bachelor's degree or higher: 32.7%
Number of foreign born residents: 6,578 (52.4% naturalized citizens)
| Frederick County: | 6.9% |
| Whole state: | 12.7% |
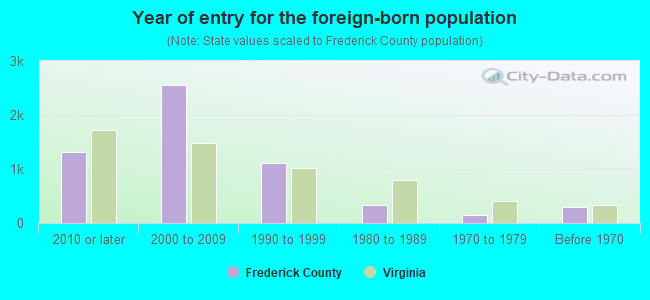
- Year of entry for the foreign-born population
- 1,5542010 or later
- 2,9012000 to 2009
- 1,0701990 to 1999
- 3361980 to 1989
- 1471970 to 1979
- 293Before 1970
Mean travel time to work (commute): minutes
Percentage of county residents living and working in this county: 94.1%


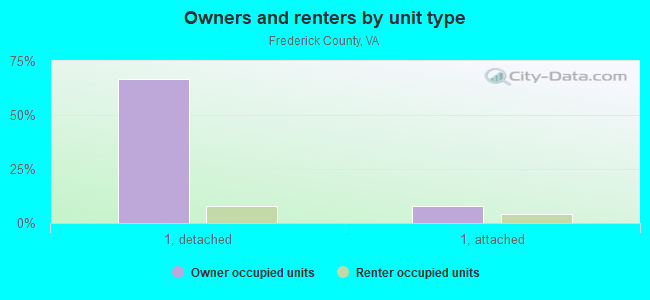
Housing units in structures:
- One, detached: 29,253
- One, attached: 3,933
- Two: 70
- 3 or 4: 143
- 5 to 9: 262
- 10 to 19: 561
- 20 to 49: 297
- 50 or more: 678
- Mobile homes: 2,027
- Boats, RVs, vans, etc.: 55
Housing units in Frederick County with a mortgage: 20,474 (1,307 second mortgage, 79 home equity loan, 1,052 both second mortgage and home equity loan)
Houses without a mortgage: 287
| Here: | 6.5% with mortgage |
| State: | 97.2% with mortgage |
Religion statistics for Frederick County
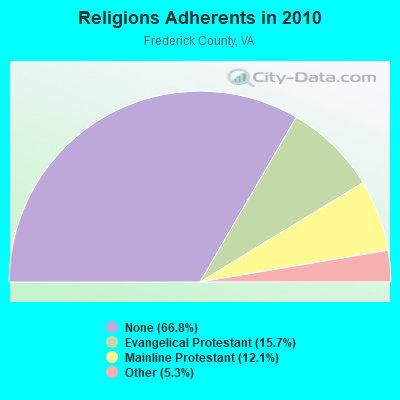
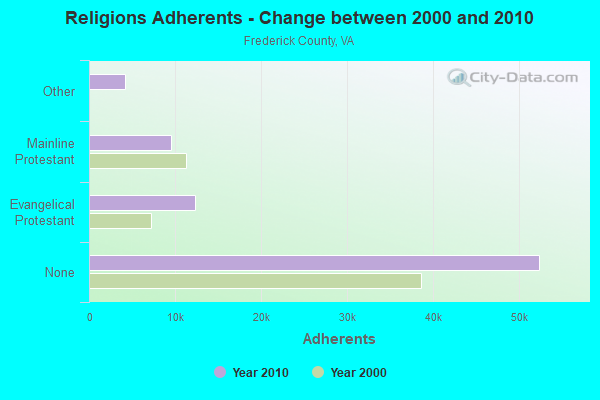
| Religion | Adherents | Congregations |
|---|---|---|
| Evangelical Protestant | 12,307 | 44 |
| Mainline Protestant | 9,502 | 51 |
| Other | 4,170 | 5 |
| None | 52,326 | - |
Source: Clifford Grammich, Kirk Hadaway, Richard Houseal, Dale E.Jones, Alexei Krindatch, Richie Stanley and Richard H.Taylor. 2012. 2010 U.S.Religion Census: Religious Congregations & Membership Study. Association of Statisticians of American Religious Bodies. Jones, Dale E., et al. 2002. Congregations and Membership in the United States 2000. Nashville, TN: Glenmary Research Center.
Food Environment Statistics:
| Frederick County: | 1.38 / 10,000 pop. |
| State: | 2.03 / 10,000 pop. |
| Here: | 0.28 / 10,000 pop. |
| Virginia: | 0.17 / 10,000 pop. |
| This county: | 0.14 / 10,000 pop. |
| Virginia: | 1.43 / 10,000 pop. |
| Frederick County: | 4.95 / 10,000 pop. |
| Virginia: | 4.03 / 10,000 pop. |
| This county: | 3.99 / 10,000 pop. |
| State: | 7.65 / 10,000 pop. |
| Frederick County: | 9.0% |
| Virginia: | 9.3% |
| Frederick County: | 27.7% |
| State: | 26.7% |
Agriculture in Frederick County:
Average size of farms: 156 acresAverage value of agricultural products sold per farm: $30,059
Average value of crops sold per acre for harvested cropland: $388.21
The value of nursery, greenhouse, floriculture, and sod as a percentage of the total market value of agricultural products sold: 13.12%
The value of livestock, poultry, and their products as a percentage of the total market value of agricultural products sold: 33.01%
Average total farm production expenses per farm: $29,401
Harvested cropland as a percentage of land in farms: 33.14%
Average market value of all machinery and equipment per farm: $38,203
The percentage of farms operated by a family or individual: 89.17%
Average age of principal farm operators: 57 years
Average number of cattle and calves per 100 acres of all land in farms: 17.85
Milk cows as a percentage of all cattle and calves: 3.45%
Corn for grain: 2116 harvested acres
All wheat for grain: 520 harvested acres
Soybeans for beans: 448 harvested acres
Vegetables: 99 harvested acres
Land in orchards: 7,902 acres
Earthquake activity:
Frederick County-area historical earthquake activity is significantly above Virginia state average. It is 51% smaller than the overall U.S. average.On 8/23/2011 at 17:51:04, a magnitude 5.8 (5.8 MW, Depth: 3.7 mi, Class: Moderate, Intensity: VI - VII) earthquake occurred 90.3 miles away from Frederick County center
On 9/25/1998 at 19:52:52, a magnitude 5.2 (4.8 MB, 4.3 MS, 5.2 LG, 4.5 MW, Depth: 3.1 mi) earthquake occurred 195.3 miles away from the county center
On 8/25/2011 at 05:07:52, a magnitude 4.5 (4.5 ML, Depth: 4.2 mi, Class: Light, Intensity: IV - V) earthquake occurred 87.5 miles away from the county center
On 12/9/2003 at 20:59:18, a magnitude 4.5 (4.5 ML, Depth: 6.2 mi) earthquake occurred 98.4 miles away from the county center
On 12/9/2003 at 20:59:14, a magnitude 4.5 (4.5 MB, 4.5 LG) earthquake occurred 112.6 miles away from Frederick County center
On 1/16/1994 at 01:49:16, a magnitude 4.6 (4.6 MB, 4.6 LG, Depth: 3.1 mi) earthquake occurred 141.3 miles away from the county center
Magnitude types: regional Lg-wave magnitude (LG), body-wave magnitude (MB), local magnitude (ML), surface-wave magnitude (MS), moment magnitude (MW)
Most recent natural disasters:
- Virginia Covid-19 Pandemic, Incident Period: January 20, 2020, Major Disaster (Presidential) Declared DR-4512-VA: April 2, 2020, FEMA Id: 4512, Natural disaster type: Other
- Virginia Severe Winter Storm And Snowstorm, Incident Period: January 22, 2016 to January 23, 2016, Major Disaster (Presidential) Declared DR-4262: March 07, 2016, FEMA Id: 4262, Natural disaster type: Snowstorm, Winter Storm
- Virginia Hurricane Sandy, Incident Period: October 26, 2012 to November 01, 2012, Emergency Declared EM-3359: October 29, 2012, FEMA Id: 3359, Natural disaster type: Hurricane
- Virginia Severe Storms and Straight-line Winds, Incident Period: June 29, 2012 to July 01, 2012, Major Disaster (Presidential) Declared DR-4072: July 27, 2012, FEMA Id: 4072, Natural disaster type: Storm, Wind
- Virginia Severe Winter Storms and Snowstorms, Incident Period: February 05, 2010 to February 11, 2010, Major Disaster (Presidential) Declared DR-1905: April 27, 2010, FEMA Id: 1905, Natural disaster type: Snowstorm, Winter Storm
- Virginia Hurricane Katrina Evacuation, Incident Period: August 29, 2005 to October 01, 2005, Emergency Declared EM-3240: September 12, 2005, FEMA Id: 3240, Natural disaster type: Hurricane
- Virginia Hurricane Isabel, Incident Period: September 18, 2003 to October 01, 2003, Major Disaster (Presidential) Declared DR-1491: September 18, 2003, FEMA Id: 1491, Natural disaster type: Hurricane
- Virginia Winter Storm, Incident Period: January 25, 2000 to January 30, 2000, Major Disaster (Presidential) Declared DR-1318: February 28, 2000, FEMA Id: 1318, Natural disaster type: Winter Storm
- Virginia Hurricane Fran, Incident Period: September 05, 1996 to September 23, 1996, Major Disaster (Presidential) Declared DR-1135: September 06, 1996, FEMA Id: 1135, Natural disaster type: Hurricane
- Virginia Severe Flooding, Incident Period: January 19, 1996 to February 01, 1996, Major Disaster (Presidential) Declared DR-1098: January 27, 1996, FEMA Id: 1098, Natural disaster type: Flood
- 4 other natural disasters have been reported since 1953.
The number of natural disasters in Frederick County (14) is near the US average (15).
Major Disasters (Presidential) Declared: 10
Emergencies Declared: 4
Causes of natural disasters: Hurricanes: 4, Winter Storms: 4, Snowstorms: 2, Blizzard: 1, Drought: 1, Flood: 1, Storm: 1, Tropical Storm: 1, Wind: 1, Other: 1 (Note: some incidents may be assigned to more than one category).
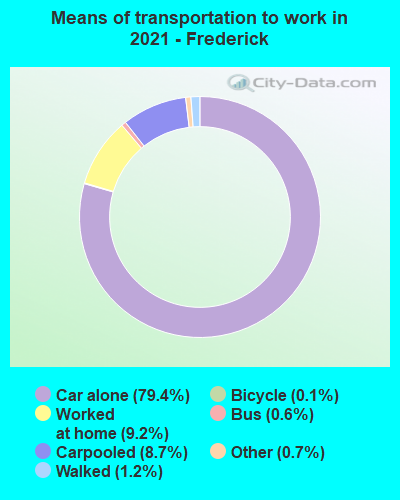
Means of transportation to work:
- Drove a car alone: 29,403 (73.9%)
- Carpooled: 3,372 (8.5%)
- Bus: 153 (0.4%)
- Long-distance train or commuter rail: 6 (0.0%)
- Taxicab, motorcycle, or other means: 536 (1.3%)
- Bicycle: 61 (0.2%)
- Walked: 508 (1.3%)
- Worked at home: 5,440 (13.7%)

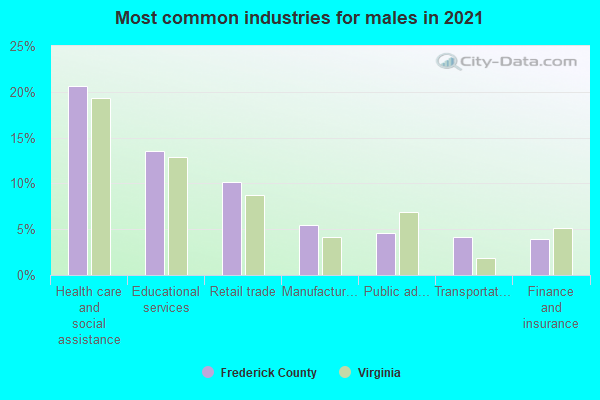
- Health care and social assistance (21%)
- Educational services (12%)
- Finance and insurance (10%)
- Retail trade (9%)
- Professional, scientific, and technical services (7%)
- Accommodation and food services (7%)
- Public administration (6%)
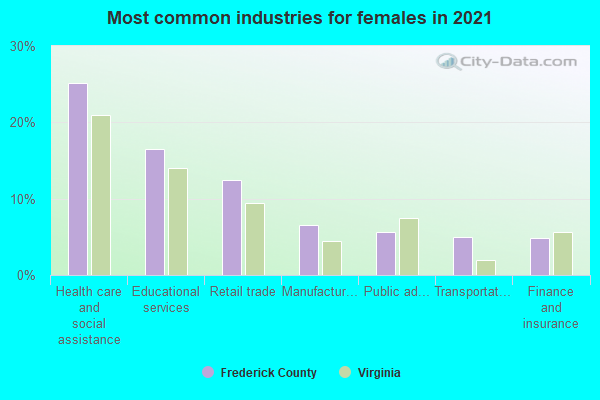
- Health care and social assistance (24%)
- Educational services (14%)
- Finance and insurance (11%)
- Retail trade (10%)
- Professional, scientific, and technical services (8%)
- Accommodation and food services (7%)
- Public administration (7%)
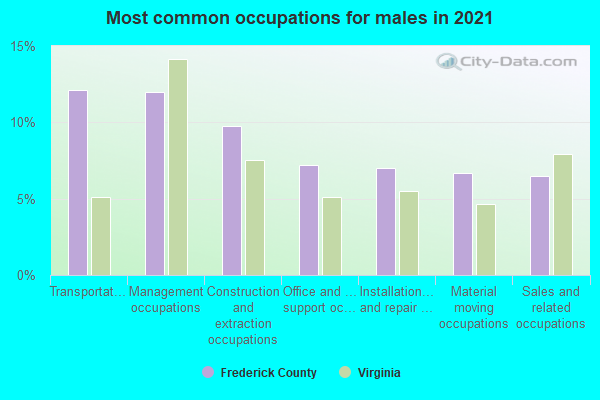
- Construction and extraction occupations (12%)
- Management occupations (11%)
- Computer and mathematical occupations (10%)
- Sales and related occupations (7%)
- Installation, maintenance, and repair occupations (7%)
- Business and financial operations occupations (7%)
- Production occupations (6%)
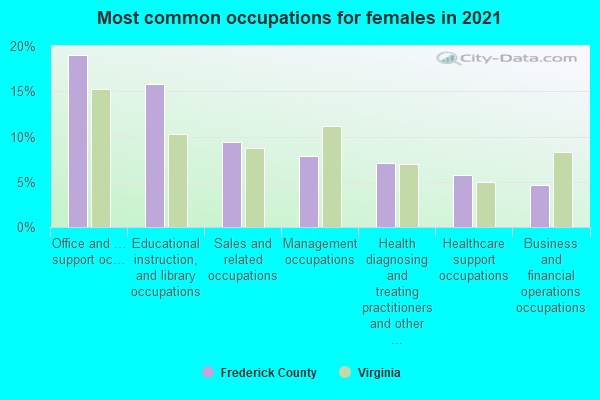
- Office and administrative support occupations (22%)
- Management occupations (10%)
- Business and financial operations occupations (9%)
- Educational instruction, and library occupations (9%)
- Health diagnosing and treating practitioners and other technical occupations (7%)
- Sales and related occupations (7%)
- Health technologists and technicians (6%)
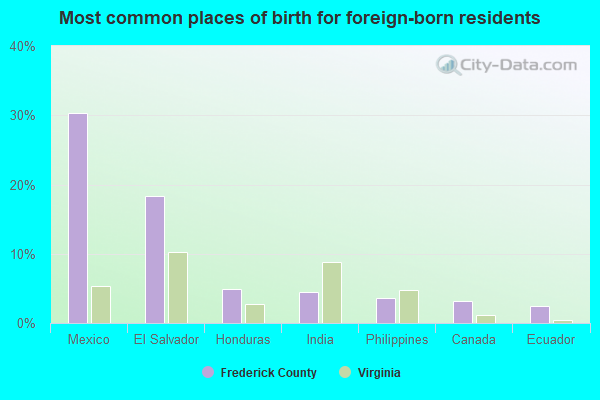
- Mexico (26%)
- El Salvador (19%)
- Honduras (5%)
- Canada (4%)
- India (4%)
- Philippines (4%)
- Bolivia (3%)
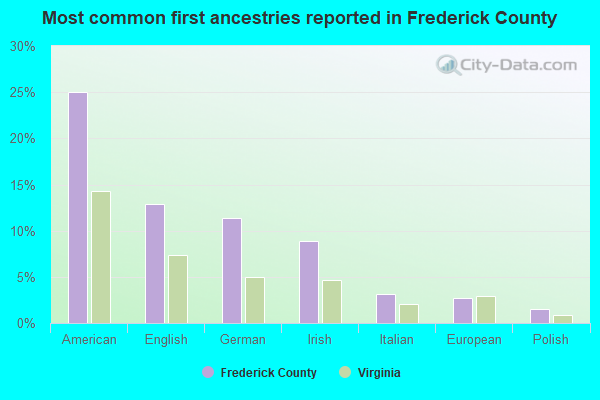
- American (20%)
- English (13%)
- German (12%)
- Irish (10%)
- European (3%)
- Italian (3%)
- Polish (2%)
People in group quarters in Frederick County, Virginia in 2010:
- 519 people in local jails and other municipal confinement facilities
- 92 people in nursing facilities/skilled-nursing facilities
- 84 people in group homes intended for adults
- 78 people in college/university student housing
- 66 people in residential treatment centers for juveniles (non-correctional)
- 43 people in emergency and transitional shelters (with sleeping facilities) for people experiencing homelessness
- 33 people in group homes for juveniles (non-correctional)
- 28 people in workers' group living quarters and job corps centers
- 17 people in correctional facilities intended for juveniles
- 4 people in residential treatment centers for adults
- 3 people in other noninstitutional facilities
People in group quarters in Frederick County, Virginia in 2000:
- 287 people in nursing homes
- 276 people in local jails and other confinement facilities (including police lockups)
- 108 people in homes for abused, dependent, and neglected children
- 100 people in other noninstitutional group quarters
- 13 people in religious group quarters
- 2 people in homes for the physically handicapped
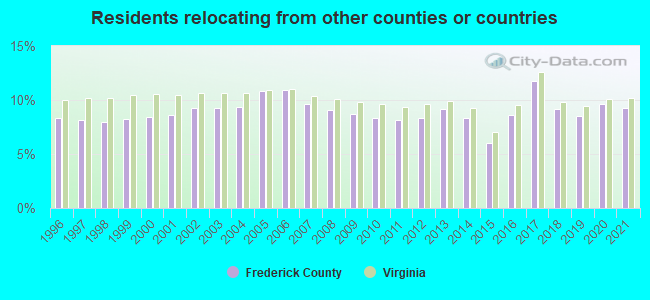
9.24% of this county's 2021 resident taxpayers lived in other counties in 2020 ($70,960 average adjusted gross income)
| Here: | 9.24% |
| Virginia average: | 10.16% |
10 or fewer of this county's residents moved from foreign countries.
6.03% relocated from other counties in Virginia ($45,317 average AGI)
3.21% relocated from other states ($25,643 average AGI)
Frederick County: 3.21% Virginia average: 3.91%
Top counties from which taxpayers relocated into this county between 2020 and 2021:
| from Winchester city, VA | |
| from Loudoun County, VA | |
| from Fairfax County, VA | |
| from Warren County, VA | |
| from Berkeley County, WV | |
| from Prince William County, VA | |
| from Shenandoah County, VA |
7.64% of this county's 2020 resident taxpayers moved to other counties in 2021 ($64,791 average adjusted gross income)
| Here: | 7.64% |
| Virginia average: | 10.20% |
10 or fewer of this county's residents moved to foreign countries.
3.78% relocated to other counties in Virginia ($30,794 average AGI)
3.86% relocated to other states ($33,997 average AGI)
Frederick County: 3.86% Virginia average: 3.98%

Top counties to which taxpayers relocated from this county between 2020 and 2021:
| to Winchester city, VA | |
| to Berkeley County, WV | |
| to Shenandoah County, VA | |
| to Warren County, VA | |
| to Loudoun County, VA | |
| to Clarke County, VA | |
| to Fairfax County, VA |
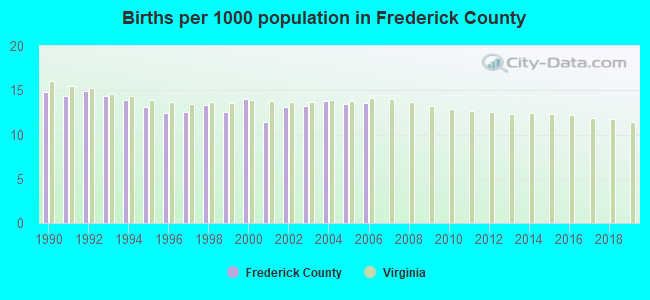
Births per 1000 population from 1990 to 1999: 13.6
Births per 1000 population from 2000 to 2006: 13.2
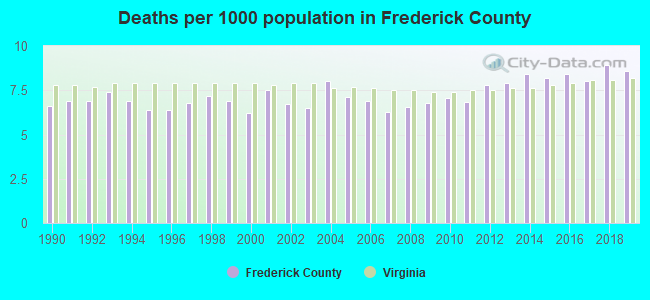
Deaths per 1000 population from 1990 to 1999: 6.8
Deaths per 1000 population from 2000 to 2009: 6.9
Deaths per 1000 population from 2010 to 2020: 8.2
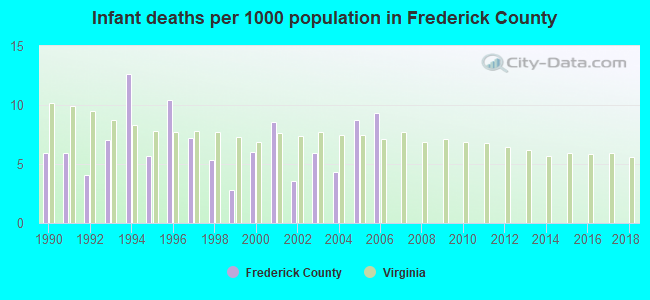
Infant deaths per 1000 live births from 1990 to 1999: 6.7
Infant deaths per 1000 live births from 2000 to 2006: 6.6
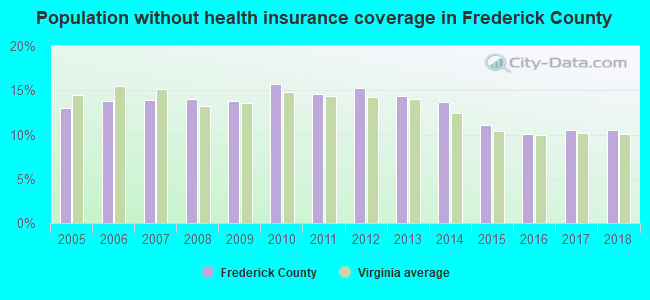
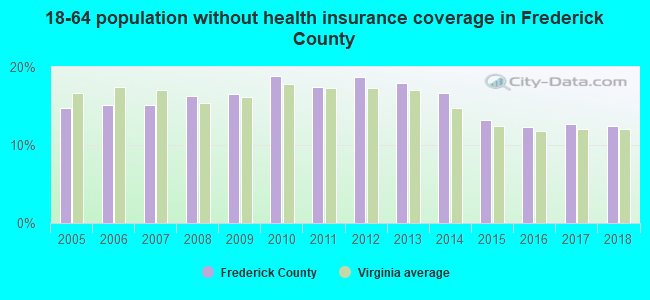
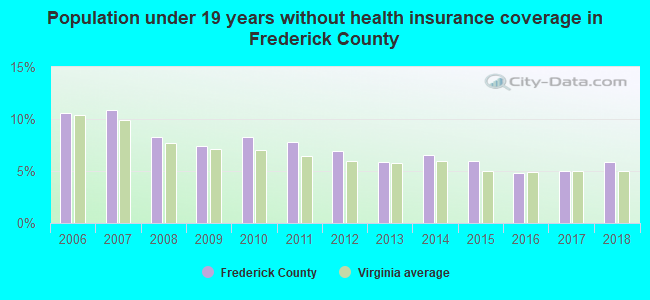
Persons under 19 years old without health insurance coverage in 2018: 5.9%
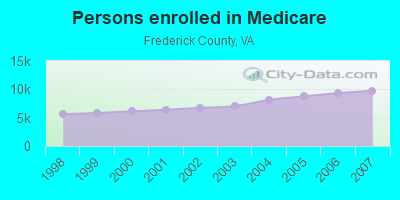
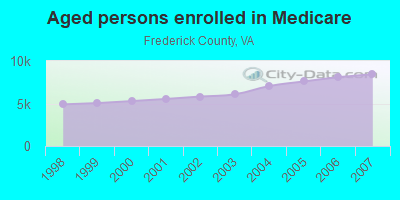
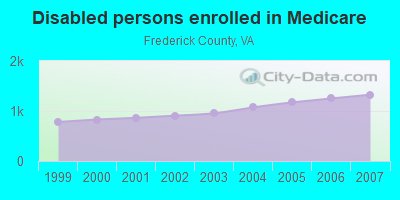
Persons enrolled in hospital insurance and/or supplemental medical insurance (Medicare) in July 1, 2007: 9,761 (8,435 aged, 1,326 disabled)
Children under 18 without health insurance coverage in 2007: 1,954 (10%)
Most common underlying causes of death in Frederick County, Virginia in 1999 - 2019:
- Bronchus or lung, unspecified - Malignant neoplasms (904)
- Atherosclerotic heart disease (599)
- Chronic obstructive pulmonary disease, unspecified (566)
- Acute myocardial infarction, unspecified (508)
- Unspecified dementia (414)
- Alzheimer disease, unspecified (292)
- Stroke, not specified as haemorrhage or infarction (236)
- Breast, unspecified - Malignant neoplasms (185)
- Congestive heart failure (171)
- Colon, unspecified - Malignant neoplasms (155)
Population without health insurance coverage in 2000: 9%
Children under 18 without health insurance coverage in 2000: 7%
Medical specialist MDs per 100,000 population in 2005: 835
Dentists per 100,000 population in 1998: 1
Total births per 100,000 population, July 2005 - July 2006 : 18
Total deaths per 100,000 population, July 2005 - July 2006: 42
Limited-service eating places per 100,000 population in 2005 : 12
Beer, wine & liquor stores per 100,000 population in 2005: 1
Suicides per 1,000,000 population from 2000 to 2006: 128.0. This is more than state average.
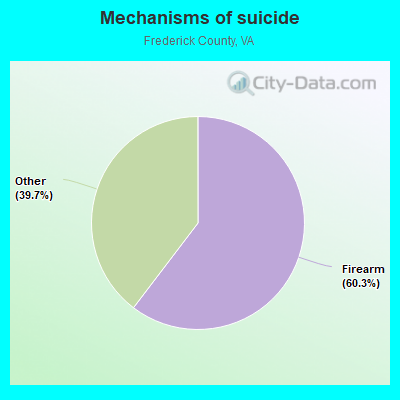
- Firearm - 77.2
- Other - 50.7
Household type by relationship:
Households: 95,051- Male householders: 19,588 (3,442 living alone), Female householders: 16,359 (3,183 living alone)
21,142 spouses (21,071 opposite-sex spouses), 2,073 unmarried partners, (2,030 opposite-sex unmarried partners), 27,091 children (24,626 natural, 163 adopted, 2,302 stepchildren), 2,462 grandchildren, 1,219 brothers or sisters, 1,189 parents, 0 foster children, 885 other relatives, 1,833 non-relatives
- In group quarters: 1,210
Size of family households: 12,331 2-persons, 6,947 3-persons, 5,234 4-persons, 2,048 5-persons, 564 6-persons, 482 7-or-more-persons.
Size of nonfamily households: 6,625 1-person, 1,227 2-persons, 489 3-persons.
13,031 married couples with children.
4,699 single-parent households (2,487 men, 2,212 women).
88.8% of residents of Frederick speak English at home.
8.6% of residents speak Spanish at home (56% speak English very well, 19% speak English well, 21% speak English not well, 4% don't speak English at all).
1.2% of residents speak other Indo-European language at home (77% speak English very well, 17% speak English well, 4% speak English not well, 2% don't speak English at all).
0.9% of residents speak Asian or Pacific Island language at home (87% speak English very well, 3% speak English well, 10% speak English not well).
0.2% of residents speak other language at home (100% speak English very well).
In fiscal year 2004:
Federal Government expenditure: $189,417,000 ($2,844 per capita)
Department of Defense expenditure: $5,688,000
Federal direct payments to individuals for retirement and disability: $133,344,000
Federal other direct payments to individuals: $27,753,000
Federal direct payments not to individuals: $1,038,000
Federal grants: $20,367,000
Federal procurement contracts: $2,169,000 ($515,000 Department of Defense)
Federal salaries and wages: $4,746,000 ($0,000 Department of Defense)
Federal Government direct loans: $965,000
Federal guaranteed/insured loans: $52,671,000
Federal Government insurance: $16,780,000
Population change from April 1, 2000 to July 1, 2005:
Births: 4,301| Here: | 62 per 1000 residents |
| State: | 70 per 1000 residents |
Deaths: 2,230
| Here: | 32 per 1000 residents |
| State: | 40 per 1000 residents |
Net international migration: +245
| Here: | +4 per 1000 residents |
| State: | +18 per 1000 residents |
Net internal migration: +7,690
| Here: | +111 per 1000 residents |
| State: | +14 per 1000 residents |
Total withdrawal of fresh water for public supply: 2.21 millions of gallons per day (9% from ground, 91% from surface)
| Here: | 6.7 |
| State: | 7.0 |
| Here: | 5.1 |
| State: | 4.3 |
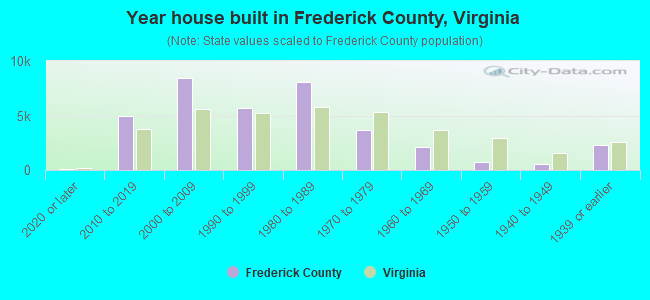
- Year house built in Frederick County, Virginia
- 9162020 or later
- 7,5692010 to 2019
- 10,5862000 to 2009
- 4,8621990 to 1999
- 4,7001980 to 1989
- 4,4571970 to 1979
- 1,2651960 to 1969
- 1,3401950 to 1959
- 5771940 to 1949
- 1,0071939 or earlier
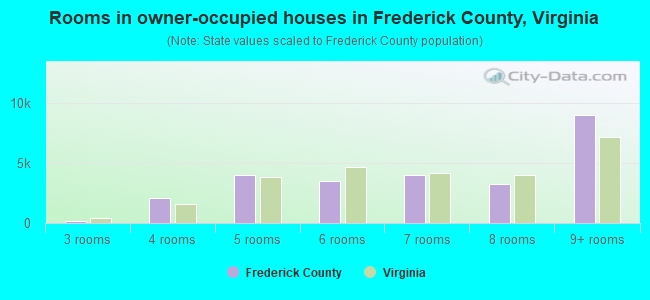
- Rooms in owner-occupied houses in Frederick County, Virginia
- 01 room
- 02 rooms
- 2053 rooms
- 2,9924 rooms
- 3,7335 rooms
- 7,3386 rooms
- 3,4587 rooms
- 4,4608 rooms
- 7,6899+ rooms
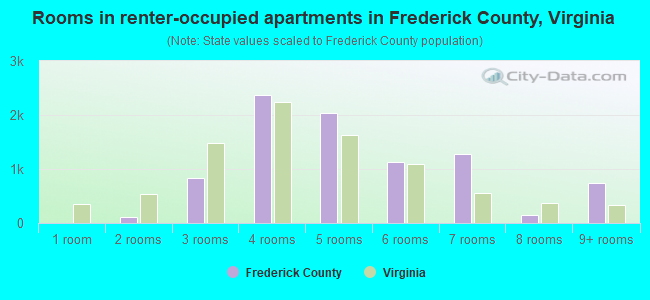
- Rooms in renter-occupied apartments in Frederick County, Virginia
- 2361 room
- 2932 rooms
- 4793 rooms
- 1,4054 rooms
- 1,1005 rooms
- 1,3756 rooms
- 2197 rooms
- 4818 rooms
- 4849+ rooms
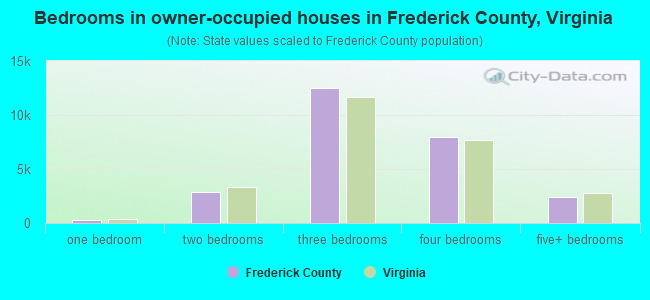
- Bedrooms in owner-occupied houses in Frederick County, Virginia
- 0no bedroom
- 2751 bedroom
- 3,7392 bedrooms
- 15,3683 bedrooms
- 8,5904 bedrooms
- 1,9035+ bedrooms
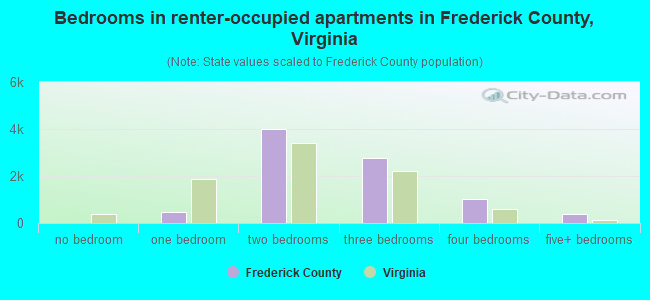
- Bedrooms in renter-occupied apartments in Frederick County, Virginia
- 236no bedroom
- 5011 bedroom
- 2,2172 bedrooms
- 2,2333 bedrooms
- 7614 bedrooms
- 1245+ bedrooms

- Cars and other vehicles available in Frederick County in owner-occupied houses/condos
- 570no vehicle
- 6,0311 vehicle
- 11,8482 vehicles
- 7,6273 vehicles
- 1,8654 vehicles
- 1,9345+ vehicles
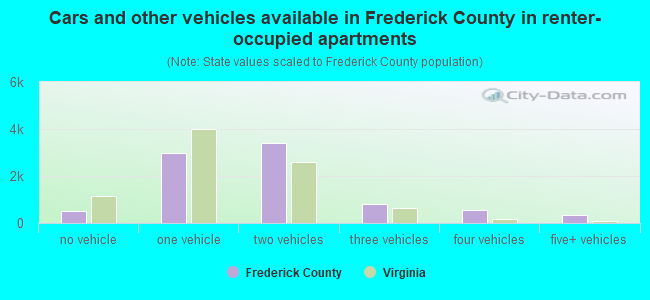
- Cars and other vehicles available in Frederick County in renter-occupied apartments
- 658no vehicle
- 1,1501 vehicle
- 3,4622 vehicles
- 7593 vehicles
- 434 vehicles
- 05+ vehicles
88.6% of Frederick County residents lived in the same house 1 years ago.
Out of people who lived in different houses, 25% lived in this county.
Out of people who lived in different counties, 78% lived in Virginia.
| Frederick County: | 88.6% |
| State average: | 86.6% |
Place of birth for U.S.-born residents:
- This state: 51,535
- Other state: 35,688
- Northeast: 10,814
- Midwest: 5,142
- South: 16,523
- West: 3,209

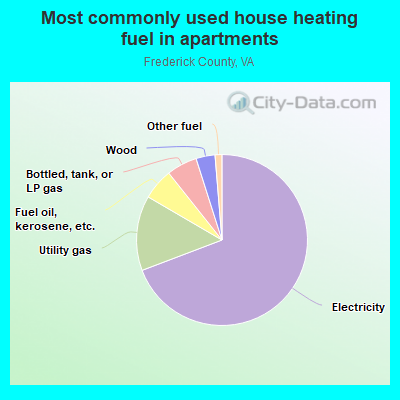
- 41.4%Electricity
- 37.9%Utility gas
- 12.0%Bottled, tank, or LP gas
- 4.9%Wood
- 2.9%Fuel oil, kerosene, etc.
- 0.6%Other fuel
- 0.3%No fuel used
- 48.5%Electricity
- 26.6%Utility gas
- 9.1%Wood
- 6.6%Bottled, tank, or LP gas
- 5.2%Fuel oil, kerosene, etc.
- 3.9%No fuel used
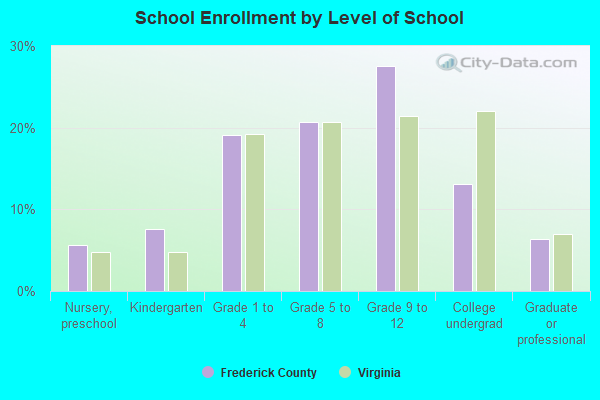
Private vs. public school enrollment:
| Here: | 20.3% |
| Virginia: | 13.2% |
| Here: | 4.1% |
| Virginia: | 10.2% |
| Here: | 20.2% |
| Virginia: | 18.7% |
Frederick County government finances - Expenditure in 2018:
- Assistance and Subsidies - Public Welfare, Cash Assistance Programs - Other: $80,000
Public Welfare, Cash Assistance Programs - Other: $77,000
- Bond Funds - Cash and Securities: $19,395,000
Cash and Securities: $756,000
- Charges - Parks and Recreation: $2,367,000
Parks and Recreation: $2,306,000
Elementary and Secondary Education School Lunch: $2,204,000
Elementary and Secondary Education School Lunch: $1,760,000
Other: $515,000
Other: $430,000
Elementary and Secondary Education - Other: $372,000
Elementary and Secondary Education - Other: $368,000
Elementary and Secondary Education School Tuition and Transportation: $201,000
Elementary and Secondary Education School Tuition and Transportation: $174,000
- Construction - Elementary and Secondary Education: $4,023,000
Elementary and Secondary Education: $1,412,000
- Current Operations - Elementary and Secondary Education: $179,833,000
Elementary and Secondary Education: $163,636,000
Police Protection: $16,390,000
Police Protection: $16,368,000
Local Fire Protection: $15,501,000
Local Fire Protection: $15,307,000
Central Staff Services: $11,582,000
Public Welfare - Other: $7,877,000
Financial Administration: $7,633,000
Public Welfare - Other: $7,354,000
Parks and Recreation: $6,432,000
Correctional Institutions: $5,987,000
Correctional Institutions: $5,667,000
General Public Buildings: $5,631,000
Parks and Recreation: $5,410,000
Financial Administration: $4,004,000
Judicial and Legal Services: $3,326,000
Central Staff Services: $3,004,000
Judicial and Legal Services: $2,491,000
General Public Buildings: $1,952,000
Protective Inspection and Regulation - Other: $1,436,000
Protective Inspection and Regulation - Other: $1,238,000
Libraries: $1,203,000
Public Welfare, Vendor Payments for Other Purposes: $16,000
Public Welfare, Vendor Payments for Other Purposes: $14,000
- Federal Intergovernmental - Education: $307,000
Education: $278,000
- Intergovernmental to Local - Other - Elementary and Secondary Education: $3,994,000
Other - Elementary and Secondary Education: $3,547,000
Other - Libraries: $1,178,000
Other - Libraries: $1,088,000
- Local Intergovernmental - Education: $4,147,000
Education: $3,668,000
- Long Term Debt - Beginning Outstanding - Unspecified Public Purpose: $218,206,000
Beginning Outstanding - Unspecified Public Purpose: $216,362,000
Outstanding Unspecified Public Purpose: $203,515,000
Outstanding Unspecified Public Purpose: $180,023,000
Retired Unspecified Public Purpose: $46,261,000
Retired Unspecified Public Purpose: $36,339,000
Issue, Unspecified Public Purpose: $31,571,000
Beginning Outstanding - Public Debt for Private Purpose: $23,965,000
Outstanding Nonguaranteed - Industrial Revenue: $22,024,000
Beginning Outstanding - Public Debt for Private Purpose: $20,083,000
Outstanding Nonguaranteed - Industrial Revenue: $18,142,000
Retired Nonguaranteed - Public Debt for Private Purpose: $1,941,000
Retired Nonguaranteed - Public Debt for Private Purpose: $1,941,000
- Miscellaneous - General Revenue - Other: $5,850,000
General Revenue - Other: $3,630,000
Interest Earnings: $1,192,000
Interest Earnings: $630,000
Fines and Forfeits: $303,000
Fines and Forfeits: $299,000
Donations From Private Sources: $227,000
Donations From Private Sources: $197,000
Sale of Property: $23,000
Sale of Property: $16,000
- Other Capital Outlay - Elementary and Secondary Education: $31,083,000
Elementary and Secondary Education: $5,586,000
- Other Funds - Cash and Securities: $217,296,000
Cash and Securities: $160,979,000
- Short Term Debt Outstanding - Beginning: $46,261,000
End of Fiscal Year: $16,946,000
- Sinking Funds - Cash and Securities: $22,259,000
Cash and Securities: $22,024,000
- State Intergovernmental - Education: $91,192,000
Education: $82,972,000
General Local Government Support: $13,465,000
General Local Government Support: $13,297,000
Other: $5,700,000
Public Welfare: $5,310,000
Public Welfare: $5,173,000
Other: $5,114,000
- Tax - Property: $117,432,000
Property: $105,569,000
General Sales and Gross Receipts: $16,008,000
General Sales and Gross Receipts: $14,060,000
Occupation and Business License - Other: $7,816,000
Occupation and Business License - Other: $7,121,000
Other Selective Sales: $6,299,000
Other Selective Sales: $6,006,000
Public Utilities Sales: $5,000,000
Public Utilities Sales: $3,865,000
Motor Vehicle License: $2,850,000
Motor Vehicle License: $2,674,000
Other: $2,363,000
Other: $2,335,000
Other License: $2,307,000
Other License: $2,294,000
- Total Salaries and Wages: $109,757,000
: $101,104,000
Frederick County government finances - Revenue in 2018:
- Assistance and Subsidies - Public Welfare, Cash Assistance Programs - Other: $80,000
Public Welfare, Cash Assistance Programs - Other: $77,000
- Bond Funds - Cash and Securities: $19,395,000
Cash and Securities: $756,000
- Charges - Parks and Recreation: $2,367,000
Parks and Recreation: $2,306,000
Elementary and Secondary Education School Lunch: $2,204,000
Elementary and Secondary Education School Lunch: $1,760,000
Other: $515,000
Other: $430,000
Elementary and Secondary Education - Other: $372,000
Elementary and Secondary Education - Other: $368,000
Elementary and Secondary Education School Tuition and Transportation: $201,000
Elementary and Secondary Education School Tuition and Transportation: $174,000
- Construction - Elementary and Secondary Education: $4,023,000
Elementary and Secondary Education: $1,412,000
- Current Operations - Elementary and Secondary Education: $179,833,000
Elementary and Secondary Education: $163,636,000
Police Protection: $16,390,000
Police Protection: $16,368,000
Local Fire Protection: $15,501,000
Local Fire Protection: $15,307,000
Central Staff Services: $11,582,000
Public Welfare - Other: $7,877,000
Financial Administration: $7,633,000
Public Welfare - Other: $7,354,000
Parks and Recreation: $6,432,000
Correctional Institutions: $5,987,000
Correctional Institutions: $5,667,000
General Public Buildings: $5,631,000
Parks and Recreation: $5,410,000
Financial Administration: $4,004,000
Judicial and Legal Services: $3,326,000
Central Staff Services: $3,004,000
Judicial and Legal Services: $2,491,000
General Public Buildings: $1,952,000
Protective Inspection and Regulation - Other: $1,436,000
Protective Inspection and Regulation - Other: $1,238,000
Libraries: $1,203,000
Public Welfare, Vendor Payments for Other Purposes: $16,000
Public Welfare, Vendor Payments for Other Purposes: $14,000
- Federal Intergovernmental - Education: $307,000
Education: $278,000
- Intergovernmental to Local - Other - Elementary and Secondary Education: $3,994,000
Other - Elementary and Secondary Education: $3,547,000
Other - Libraries: $1,178,000
Other - Libraries: $1,088,000
- Local Intergovernmental - Education: $4,147,000
Education: $3,668,000
- Long Term Debt - Beginning Outstanding - Unspecified Public Purpose: $218,206,000
Beginning Outstanding - Unspecified Public Purpose: $216,362,000
Outstanding Unspecified Public Purpose: $203,515,000
Outstanding Unspecified Public Purpose: $180,023,000
Retired Unspecified Public Purpose: $46,261,000
Retired Unspecified Public Purpose: $36,339,000
Issue, Unspecified Public Purpose: $31,571,000
Beginning Outstanding - Public Debt for Private Purpose: $23,965,000
Outstanding Nonguaranteed - Industrial Revenue: $22,024,000
Beginning Outstanding - Public Debt for Private Purpose: $20,083,000
Outstanding Nonguaranteed - Industrial Revenue: $18,142,000
Retired Nonguaranteed - Public Debt for Private Purpose: $1,941,000
Retired Nonguaranteed - Public Debt for Private Purpose: $1,941,000
- Miscellaneous - General Revenue - Other: $5,850,000
General Revenue - Other: $3,630,000
Interest Earnings: $1,192,000
Interest Earnings: $630,000
Fines and Forfeits: $303,000
Fines and Forfeits: $299,000
Donations From Private Sources: $227,000
Donations From Private Sources: $197,000
Sale of Property: $23,000
Sale of Property: $16,000
- Other Capital Outlay - Elementary and Secondary Education: $31,083,000
Elementary and Secondary Education: $5,586,000
- Other Funds - Cash and Securities: $217,296,000
Cash and Securities: $160,979,000
- Short Term Debt Outstanding - Beginning: $46,261,000
End of Fiscal Year: $16,946,000
- Sinking Funds - Cash and Securities: $22,259,000
Cash and Securities: $22,024,000
- State Intergovernmental - Education: $91,192,000
Education: $82,972,000
General Local Government Support: $13,465,000
General Local Government Support: $13,297,000
Other: $5,700,000
Public Welfare: $5,310,000
Public Welfare: $5,173,000
Other: $5,114,000
- Tax - Property: $117,432,000
Property: $105,569,000
General Sales and Gross Receipts: $16,008,000
General Sales and Gross Receipts: $14,060,000
Occupation and Business License - Other: $7,816,000
Occupation and Business License - Other: $7,121,000
Other Selective Sales: $6,299,000
Other Selective Sales: $6,006,000
Public Utilities Sales: $5,000,000
Public Utilities Sales: $3,865,000
Motor Vehicle License: $2,850,000
Motor Vehicle License: $2,674,000
Other: $2,363,000
Other: $2,335,000
Other License: $2,307,000
Other License: $2,294,000
- Total Salaries and Wages: $109,757,000
: $101,104,000
Frederick County government finances - Debt in 2018:
- Assistance and Subsidies - Public Welfare, Cash Assistance Programs - Other: $80,000
Public Welfare, Cash Assistance Programs - Other: $77,000
- Bond Funds - Cash and Securities: $19,395,000
Cash and Securities: $756,000
- Charges - Parks and Recreation: $2,367,000
Parks and Recreation: $2,306,000
Elementary and Secondary Education School Lunch: $2,204,000
Elementary and Secondary Education School Lunch: $1,760,000
Other: $515,000
Other: $430,000
Elementary and Secondary Education - Other: $372,000
Elementary and Secondary Education - Other: $368,000
Elementary and Secondary Education School Tuition and Transportation: $201,000
Elementary and Secondary Education School Tuition and Transportation: $174,000
- Construction - Elementary and Secondary Education: $4,023,000
Elementary and Secondary Education: $1,412,000
- Current Operations - Elementary and Secondary Education: $179,833,000
Elementary and Secondary Education: $163,636,000
Police Protection: $16,390,000
Police Protection: $16,368,000
Local Fire Protection: $15,501,000
Local Fire Protection: $15,307,000
Central Staff Services: $11,582,000
Public Welfare - Other: $7,877,000
Financial Administration: $7,633,000
Public Welfare - Other: $7,354,000
Parks and Recreation: $6,432,000
Correctional Institutions: $5,987,000
Correctional Institutions: $5,667,000
General Public Buildings: $5,631,000
Parks and Recreation: $5,410,000
Financial Administration: $4,004,000
Judicial and Legal Services: $3,326,000
Central Staff Services: $3,004,000
Judicial and Legal Services: $2,491,000
General Public Buildings: $1,952,000
Protective Inspection and Regulation - Other: $1,436,000
Protective Inspection and Regulation - Other: $1,238,000
Libraries: $1,203,000
Public Welfare, Vendor Payments for Other Purposes: $16,000
Public Welfare, Vendor Payments for Other Purposes: $14,000
- Federal Intergovernmental - Education: $307,000
Education: $278,000
- Intergovernmental to Local - Other - Elementary and Secondary Education: $3,994,000
Other - Elementary and Secondary Education: $3,547,000
Other - Libraries: $1,178,000
Other - Libraries: $1,088,000
- Local Intergovernmental - Education: $4,147,000
Education: $3,668,000
- Long Term Debt - Beginning Outstanding - Unspecified Public Purpose: $218,206,000
Beginning Outstanding - Unspecified Public Purpose: $216,362,000
Outstanding Unspecified Public Purpose: $203,515,000
Outstanding Unspecified Public Purpose: $180,023,000
Retired Unspecified Public Purpose: $46,261,000
Retired Unspecified Public Purpose: $36,339,000
Issue, Unspecified Public Purpose: $31,571,000
Beginning Outstanding - Public Debt for Private Purpose: $23,965,000
Outstanding Nonguaranteed - Industrial Revenue: $22,024,000
Beginning Outstanding - Public Debt for Private Purpose: $20,083,000
Outstanding Nonguaranteed - Industrial Revenue: $18,142,000
Retired Nonguaranteed - Public Debt for Private Purpose: $1,941,000
Retired Nonguaranteed - Public Debt for Private Purpose: $1,941,000
- Miscellaneous - General Revenue - Other: $5,850,000
General Revenue - Other: $3,630,000
Interest Earnings: $1,192,000
Interest Earnings: $630,000
Fines and Forfeits: $303,000
Fines and Forfeits: $299,000
Donations From Private Sources: $227,000
Donations From Private Sources: $197,000
Sale of Property: $23,000
Sale of Property: $16,000
- Other Capital Outlay - Elementary and Secondary Education: $31,083,000
Elementary and Secondary Education: $5,586,000
- Other Funds - Cash and Securities: $217,296,000
Cash and Securities: $160,979,000
- Short Term Debt Outstanding - Beginning: $46,261,000
End of Fiscal Year: $16,946,000
- Sinking Funds - Cash and Securities: $22,259,000
Cash and Securities: $22,024,000
- State Intergovernmental - Education: $91,192,000
Education: $82,972,000
General Local Government Support: $13,465,000
General Local Government Support: $13,297,000
Other: $5,700,000
Public Welfare: $5,310,000
Public Welfare: $5,173,000
Other: $5,114,000
- Tax - Property: $117,432,000
Property: $105,569,000
General Sales and Gross Receipts: $16,008,000
General Sales and Gross Receipts: $14,060,000
Occupation and Business License - Other: $7,816,000
Occupation and Business License - Other: $7,121,000
Other Selective Sales: $6,299,000
Other Selective Sales: $6,006,000
Public Utilities Sales: $5,000,000
Public Utilities Sales: $3,865,000
Motor Vehicle License: $2,850,000
Motor Vehicle License: $2,674,000
Other: $2,363,000
Other: $2,335,000
Other License: $2,307,000
Other License: $2,294,000
- Total Salaries and Wages: $109,757,000
: $101,104,000
Frederick County government finances - Cash and Securities in 2018:
- Assistance and Subsidies - Public Welfare, Cash Assistance Programs - Other: $80,000
Public Welfare, Cash Assistance Programs - Other: $77,000
- Bond Funds - Cash and Securities: $19,395,000
Cash and Securities: $756,000
- Charges - Parks and Recreation: $2,367,000
Parks and Recreation: $2,306,000
Elementary and Secondary Education School Lunch: $2,204,000
Elementary and Secondary Education School Lunch: $1,760,000
Other: $515,000
Other: $430,000
Elementary and Secondary Education - Other: $372,000
Elementary and Secondary Education - Other: $368,000
Elementary and Secondary Education School Tuition and Transportation: $201,000
Elementary and Secondary Education School Tuition and Transportation: $174,000
- Construction - Elementary and Secondary Education: $4,023,000
Elementary and Secondary Education: $1,412,000
- Current Operations - Elementary and Secondary Education: $179,833,000
Elementary and Secondary Education: $163,636,000
Police Protection: $16,390,000
Police Protection: $16,368,000
Local Fire Protection: $15,501,000
Local Fire Protection: $15,307,000
Central Staff Services: $11,582,000
Public Welfare - Other: $7,877,000
Financial Administration: $7,633,000
Public Welfare - Other: $7,354,000
Parks and Recreation: $6,432,000
Correctional Institutions: $5,987,000
Correctional Institutions: $5,667,000
General Public Buildings: $5,631,000
Parks and Recreation: $5,410,000
Financial Administration: $4,004,000
Judicial and Legal Services: $3,326,000
Central Staff Services: $3,004,000
Judicial and Legal Services: $2,491,000
General Public Buildings: $1,952,000
Protective Inspection and Regulation - Other: $1,436,000
Protective Inspection and Regulation - Other: $1,238,000
Libraries: $1,203,000
Public Welfare, Vendor Payments for Other Purposes: $16,000
Public Welfare, Vendor Payments for Other Purposes: $14,000
- Federal Intergovernmental - Education: $307,000
Education: $278,000
- Intergovernmental to Local - Other - Elementary and Secondary Education: $3,994,000
Other - Elementary and Secondary Education: $3,547,000
Other - Libraries: $1,178,000
Other - Libraries: $1,088,000
- Local Intergovernmental - Education: $4,147,000
Education: $3,668,000
- Long Term Debt - Beginning Outstanding - Unspecified Public Purpose: $218,206,000
Beginning Outstanding - Unspecified Public Purpose: $216,362,000
Outstanding Unspecified Public Purpose: $203,515,000
Outstanding Unspecified Public Purpose: $180,023,000
Retired Unspecified Public Purpose: $46,261,000
Retired Unspecified Public Purpose: $36,339,000
Issue, Unspecified Public Purpose: $31,571,000
Beginning Outstanding - Public Debt for Private Purpose: $23,965,000
Outstanding Nonguaranteed - Industrial Revenue: $22,024,000
Beginning Outstanding - Public Debt for Private Purpose: $20,083,000
Outstanding Nonguaranteed - Industrial Revenue: $18,142,000
Retired Nonguaranteed - Public Debt for Private Purpose: $1,941,000
Retired Nonguaranteed - Public Debt for Private Purpose: $1,941,000
- Miscellaneous - General Revenue - Other: $5,850,000
General Revenue - Other: $3,630,000
Interest Earnings: $1,192,000
Interest Earnings: $630,000
Fines and Forfeits: $303,000
Fines and Forfeits: $299,000
Donations From Private Sources: $227,000
Donations From Private Sources: $197,000
Sale of Property: $23,000
Sale of Property: $16,000
- Other Capital Outlay - Elementary and Secondary Education: $31,083,000
Elementary and Secondary Education: $5,586,000
- Other Funds - Cash and Securities: $217,296,000
Cash and Securities: $160,979,000
- Short Term Debt Outstanding - Beginning: $46,261,000
End of Fiscal Year: $16,946,000
- Sinking Funds - Cash and Securities: $22,259,000
Cash and Securities: $22,024,000
- State Intergovernmental - Education: $91,192,000
Education: $82,972,000
General Local Government Support: $13,465,000
General Local Government Support: $13,297,000
Other: $5,700,000
Public Welfare: $5,310,000
Public Welfare: $5,173,000
Other: $5,114,000
- Tax - Property: $117,432,000
Property: $105,569,000
General Sales and Gross Receipts: $16,008,000
General Sales and Gross Receipts: $14,060,000
Occupation and Business License - Other: $7,816,000
Occupation and Business License - Other: $7,121,000
Other Selective Sales: $6,299,000
Other Selective Sales: $6,006,000
Public Utilities Sales: $5,000,000
Public Utilities Sales: $3,865,000
Motor Vehicle License: $2,850,000
Motor Vehicle License: $2,674,000
Other: $2,363,000
Other: $2,335,000
Other License: $2,307,000
Other License: $2,294,000
- Total Salaries and Wages: $109,757,000
: $101,104,000
Supplemental Security Income (SSI) in 2006:
- Total number of recipients: 719
- Number of aged recipients: 84
- Number of blind and disabled recipients: 635
- Number of recipients under 18: 113
- Number of recipients between 18 and 64: 451
- Number of recipients older than 64: 155
- Number of recipients also receiving OASDI: 305
- Amount of payments (thousands of dollars): 320
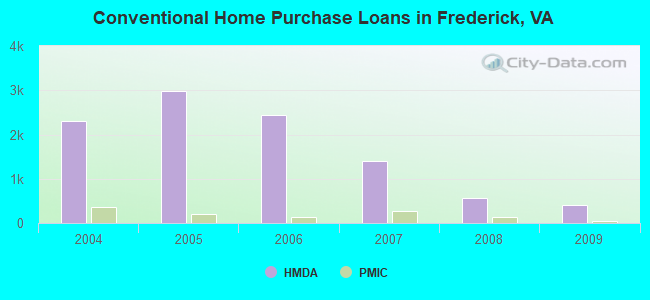
| Home Mortgage Disclosure Act Aggregated Statistics For Year 2009 (Based on 11 full tracts) | ||||||||||||
| A) FHA, FSA/RHS & VA Home Purchase Loans | B) Conventional Home Purchase Loans | C) Refinancings | D) Home Improvement Loans | F) Non-occupant Loans on < 5 Family Dwellings (A B C & D) | G) Loans On Manufactured Home Dwelling (A B C & D) | |||||||
|---|---|---|---|---|---|---|---|---|---|---|---|---|
| Number | Average Value | Number | Average Value | Number | Average Value | Number | Average Value | Number | Average Value | Number | Average Value | |
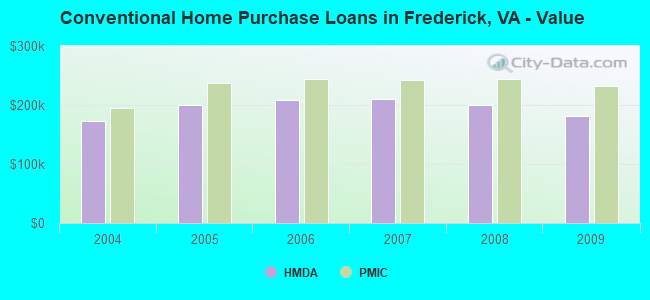
| LOANS ORIGINATED | 636 | $197,443 | 418 | $180,969 | 1,851 | $203,641 | 110 | $90,482 | 202 | $173,554 | 44 | $69,250 |
| APPLICATIONS APPROVED, NOT ACCEPTED | 32 | $172,250 | 39 | $166,308 | 119 | $188,378 | 11 | $35,273 | 14 | $100,071 | 13 | $71,692 |
| APPLICATIONS DENIED | 100 | $197,150 | 100 | $119,990 | 723 | $225,378 | 51 | $55,118 | 41 | $185,512 | 68 | $67,956 |
| APPLICATIONS WITHDRAWN | 70 | $192,114 | 53 | $190,585 | 489 | $216,730 | 17 | $113,529 | 25 | $170,800 | 10 | $84,000 |
| FILES CLOSED FOR INCOMPLETENESS | 13 | $185,077 | 8 | $157,125 | 99 | $230,576 | 2 | $10,000 | 6 | $123,667 | 1 | $75,000 |
| Private Mortgage Insurance Companies Aggregated Statistics For Year 2009 (Based on 11 full tracts) | ||||||||
| A) Conventional Home Purchase Loans | B) Refinancings | C) Non-occupant Loans on < 5 Family Dwellings (A & B) | D) Loans On Manufactured Home Dwelling (A & B) | |||||
|---|---|---|---|---|---|---|---|---|
| Number | Average Value | Number | Average Value | Number | Average Value | Number | Average Value | |
| LOANS ORIGINATED | 41 | $232,854 | 24 | $229,708 | 0 | $0 | 0 | $0 |
| APPLICATIONS APPROVED, NOT ACCEPTED | 17 | $261,353 | 14 | $279,857 | 0 | $0 | 0 | $0 |
| APPLICATIONS DENIED | 3 | $153,667 | 12 | $229,250 | 0 | $0 | 2 | $161,000 |
| APPLICATIONS WITHDRAWN | 2 | $276,500 | 5 | $199,000 | 0 | $0 | 1 | $134,000 |
| FILES CLOSED FOR INCOMPLETENESS | 3 | $225,000 | 2 | $205,500 | 1 | $136,000 | 0 | $0 |
| Most common first names in Frederick County, VA among deceased individuals | ||
| Name | Count | Lived (average) |
|---|---|---|
| John | 75 | 74.5 years |
| Robert | 66 | 73.3 years |
| Mary | 63 | 80.3 years |
| James | 59 | 70.3 years |
| William | 51 | 76.4 years |
| Charles | 48 | 73.6 years |
| George | 35 | 74.7 years |
| Joseph | 30 | 72.7 years |
| Harry | 29 | 76.0 years |
| Margaret | 27 | 79.7 years |
| Most common last names in Frederick County, VA among deceased individuals | ||
| Last name | Count | Lived (average) |
|---|---|---|
| Smith | 27 | 75.9 years |
| Orndorff | 22 | 73.9 years |
| Jenkins | 19 | 71.5 years |
| Miller | 19 | 78.2 years |
| Grim | 19 | 78.3 years |
| Cooley | 17 | 77.7 years |
| White | 17 | 80.6 years |
| Stickley | 17 | 80.2 years |
| Hartley | 16 | 76.7 years |
| Conner | 16 | 78.2 years |
| Businesses in Frederick County, VA | ||||
| Name | Count | Name | Count | |
|---|---|---|---|---|
| 7-Eleven | 7 | Marriott | 2 | |
| ALDI | 1 | Martin's | 1 | |
| AT&T | 2 | MasterBrand Cabinets | 11 | |
| Ace Hardware | 1 | Mazda | 1 | |
| Advance Auto Parts | 3 | McDonald's | 9 | |
| Aeropostale | 1 | Motherhood Maternity | 1 | |
| American Eagle Outfitters | 1 | New Balance | 2 | |
| Ann Taylor | 1 | New York & Co | 1 | |
| Arby's | 3 | Nike | 7 | |
| AutoZone | 3 | Nissan | 1 | |
| Baskin-Robbins | 3 | OfficeMax | 1 | |
| Bath & Body Works | 1 | Old Navy | 1 | |
| Bed Bath & Beyond | 1 | Olive Garden | 1 | |
| Best Western | 1 | Outback | 1 | |
| Buffalo Wild Wings | 1 | Outback Steakhouse | 1 | |
| Burger King | 2 | Pac Sun | 1 | |
| CVS | 5 | Panda Express | 1 | |
| Charlotte Russe | 1 | Panera Bread | 1 | |
| Chevrolet | 1 | Papa John's Pizza | 2 | |
| Chick-Fil-A | 2 | Payless | 2 | |
| Chico's | 1 | PetSmart | 1 | |
| Chipotle | 1 | Pier 1 Imports | 1 | |
| Cold Stone Creamery | 1 | Pizza Hut | 3 | |
| Coldwater Creek | 1 | Popeyes | 1 | |
| Comfort Inn | 1 | Quality | 1 | |
| Costco | 1 | Quiznos | 1 | |
| Cracker Barrel | 1 | RadioShack | 2 | |
| Curves | 2 | Red Lobster | 1 | |
| DHL | 2 | Red Roof Inn | 1 | |
| Dairy Queen | 1 | Rite Aid | 3 | |
| Days Inn | 1 | Ruby Tuesday | 1 | |
| Deb | 1 | Ryder Rental & Truck Leasing | 1 | |
| Decora Cabinetry | 4 | SAS Shoes | 1 | |
| Dunkin Donuts | 6 | SONIC Drive-In | 2 | |
| Famous Footwear | 1 | Sears | 3 | |
| FedEx | 20 | Sleep Inn | 1 | |
| Finish Line | 1 | Spencer Gifts | 1 | |
| Firestone Complete Auto Care | 1 | Sprint Nextel | 5 | |
| Ford | 1 | Staples | 1 | |
| GNC | 3 | Subaru | 1 | |
| GameStop | 3 | Subway | 11 | |
| Gymboree | 1 | Super 8 | 2 | |
| H&R Block | 1 | T-Mobile | 4 | |
| Hilton | 3 | T.G.I. Driday's | 1 | |
| Hobby Lobby | 1 | T.J.Maxx | 1 | |
| Holiday Inn | 4 | Taco Bell | 2 | |
| Hollister Co. | 1 | Talbots | 1 | |
| Home Depot | 1 | Target | 1 | |
| Honda | 1 | The Room Place | 2 | |
| Hot Topic | 1 | Toyota | 1 | |
| Hyundai | 1 | Toys"R"Us | 1 | |
| IHOP | 1 | Travelodge | 1 | |
| JCPenney | 1 | True Value | 1 | |
| JoS. A. Bank | 1 | U-Haul | 5 | |
| Jones New York | 3 | UPS | 20 | |
| Journeys | 1 | Vans | 1 | |
| Justice | 1 | Verizon Wireless | 1 | |
| KFC | 3 | Victoria's Secret | 1 | |
| Kincaid | 1 | Volkswagen | 1 | |
| Kmart | 1 | Waffle House | 2 | |
| Kohl's | 1 | Walgreens | 4 | |
| La-Z-Boy | 2 | Walmart | 1 | |
| Lane Furniture | 4 | Wendy's | 3 | |
| LensCrafters | 1 | Wet Seal | 1 | |
| Long John Silver's | 1 | Wingate | 1 | |
| Lowe's | 2 | |||
Frederick County on our top lists:
- #32 on the list of "Top 101 counties with the lowest total withdrawal of fresh water for public supply (pop. 50,000+)"
- #67 on the list of "Top 101 counties with the lowest ground withdrawal of fresh water for public supply (pop. 50,000+)"
- #97 on the list of "Top 101 counties with the lowest surface withdrawal of fresh water for public supply (pop. 50,000+)"