Ionia County, Michigan (MI)
County owner-occupied free and clear houses and condos in 2010: 5,351
County owner-occupied houses and condos in 2000: 16,497
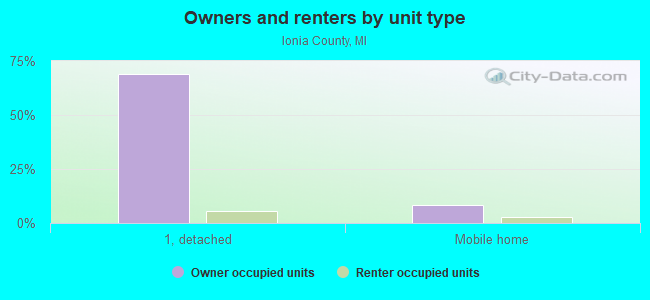
Renter-occupied apartments: 4,935 (it was 4,109 in 2000)
| % of renters here: | 20% |
| State: | 28% |
Land area: 573 sq. mi.
Water area: 7.0 sq. mi.
Population density: 117 people per square mile (average).
Industries providing employment: Manufacturing (21.2%), Educational, health and social services (15.3%), Retail trade (12.5%).
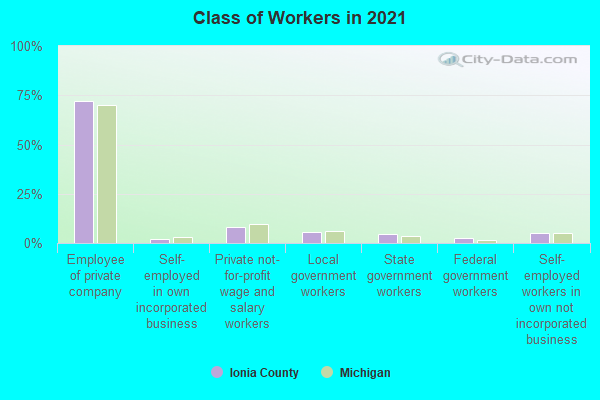
Type of workers:
- Private wage or salary: 81%
- Government: 13%
- Self-employed, not incorporated: 6%
- Unpaid family work: 0%
- OSM Map
- General Map
- Google Map
- MSN Map

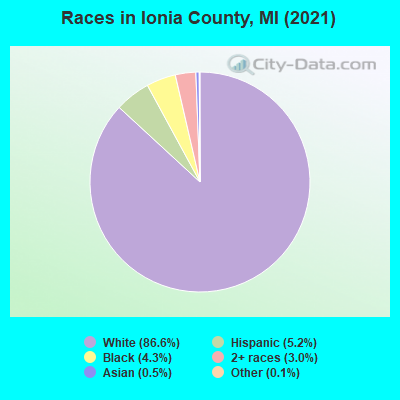
- 56,80485.0%White Non-Hispanic Alone
- 3,6115.4%Hispanic or Latino
- 2,5693.8%Two or more races
- 2,1033.1%Black Non-Hispanic Alone
- 1,5432.3%Asian alone
- 940.1%American Indian and Alaska Native alone
- 470.07%Some other race alone
- 380.06%Native Hawaiian and Other
Pacific Islander alone
| Median resident age: | 41.3 years |
| Michigan median age: | 40.3 years |
| Males: 35,545 | |
| Females: 31,264 |

 | 2020 Census: GR Metro breakdown (14 replies) |
| Top 25 Michigan suburbs for families (6 replies) |
| question 'bout skeeters (19 replies) |
| Good places for peeping ( at Fall colors)? (7 replies) |
| Grand Rapids - Should get professional sports teams (62 replies) |
| What is it like to live in Ionia/Lowell Michigan (3 replies) |
| Ionia County: | 2.0 people |
| Michigan: | 2 people |
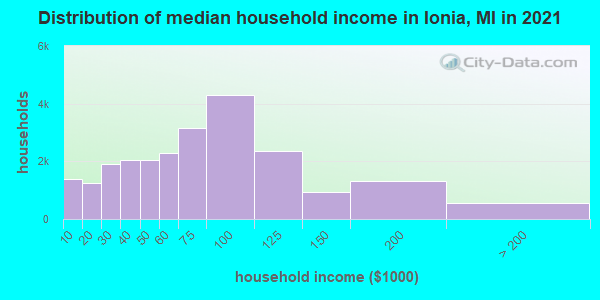
Estimated median household income in 2022: $75,865 ($43,074 in 1999)
| This county: | $75,865 |
| Michigan: | $66,986 |
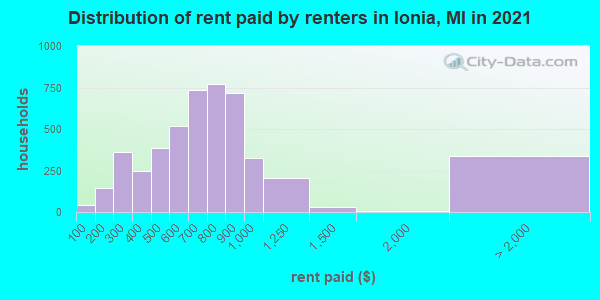
Median contract rent in 2022 for apartments: $738 (lower quartile is $510, upper quartile is $856)
| This county: | $738 |
| State: | $865 |
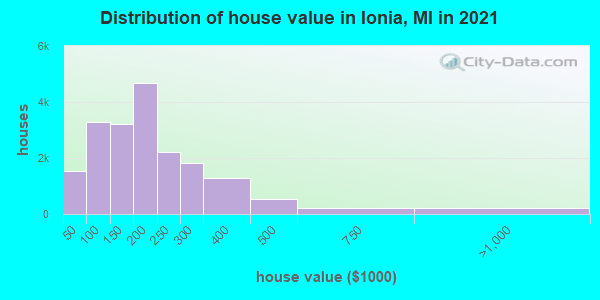
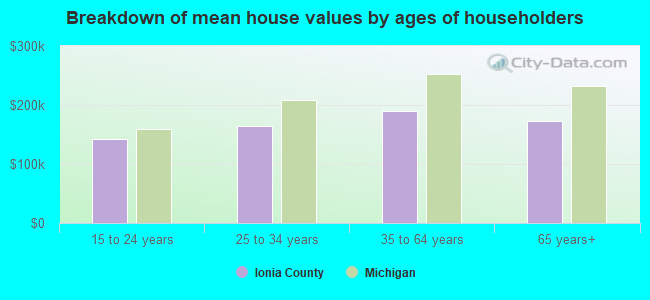
Estimated median house or condo value in 2022: $199,500 (it was $93,500 in 2000)
| Ionia: | $199,500 |
| Michigan: | $224,400 |
Median monthly housing costs for homes and condos with a mortgage: $1,312
Median monthly housing costs for units without a mortgage: $581
Institutionalized population: 5,334
Crime in 2021 (reported by the sheriff's office or county police, not the county total):
- Murders: 0
- Rapes: 1
- Robberies: 0
- Assaults: 3
- Burglaries: 0
- Thefts: 8
- Auto thefts: 2
Crime in 2020 (reported by the sheriff's office or county police, not the county total):
- Murders: 1
- Rapes: 26
- Robberies: 3
- Assaults: 48
- Burglaries: 22
- Thefts: 129
- Auto thefts: 15
Health of residents in Ionia County based on CDC Behavioral Risk Factor Surveillance System Survey Questionnaires from 2013 to 2021:
General health status score of residents in this county from 1 (poor) to 5 (excellent) is 3.6. This is about average.77.6% of residents exercised in the past month. This is about average.
41.2% of residents smoked 100+ cigarettes in their lives. This is about average.
59.8% of adult residents drank alcohol in the past 30 days. This is less than average.
76.2% of residents visited a dentist within the past year. This is about average.
Average weight of males is 201 pounds. This is more than average.
Average weight of females is 165 pounds. This is about average.
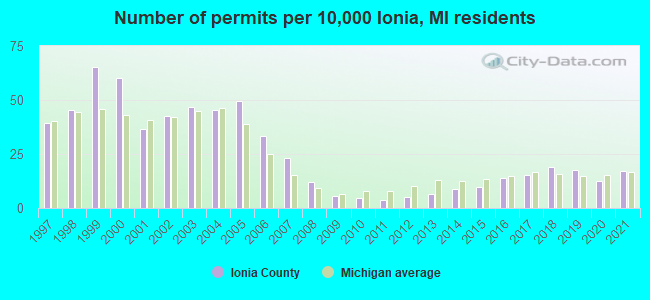
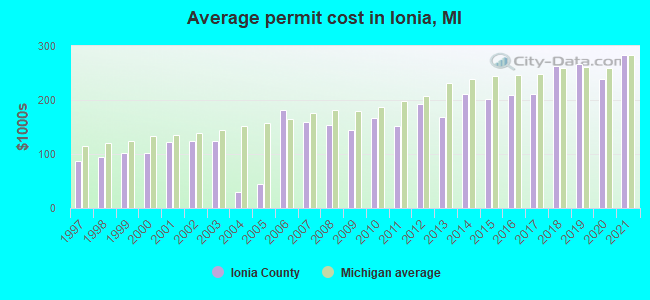
Single-family new house construction building permits:
- 2022: 90 buildings, average cost: $308,500
- 2021: 105 buildings, average cost: $284,300
- 2020: 76 buildings, average cost: $239,100
- 2019: 107 buildings, average cost: $266,100
- 2018: 116 buildings, average cost: $263,200
- 2017: 93 buildings, average cost: $211,800
- 2016: 85 buildings, average cost: $209,300
- 2015: 59 buildings, average cost: $202,100
- 2014: 53 buildings, average cost: $211,400
- 2013: 40 buildings, average cost: $167,900
- 2012: 30 buildings, average cost: $192,900
- 2011: 23 buildings, average cost: $152,000
- 2010: 28 buildings, average cost: $165,700
- 2009: 35 buildings, average cost: $145,000
- 2008: 73 buildings, average cost: $153,000
- 2007: 141 buildings, average cost: $159,300
- 2006: 204 buildings, average cost: $180,600
- 2005: 304 buildings, average cost: $43,900
- 2004: 278 buildings, average cost: $29,300
- 2003: 287 buildings, average cost: $125,000
- 2002: 263 buildings, average cost: $125,000
- 2001: 226 buildings, average cost: $123,400
- 2000: 370 buildings, average cost: $101,600
- 1999: 402 buildings, average cost: $101,600
- 1998: 279 buildings, average cost: $94,700
- 1997: 241 buildings, average cost: $87,100
Median real estate property taxes paid for housing units with mortgages in 2022: $2,297 (1.1%)
Median real estate property taxes paid for housing units with no mortgage in 2022: $2,009 (1.2%)
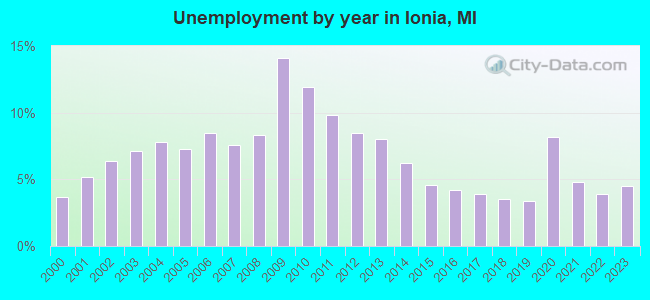
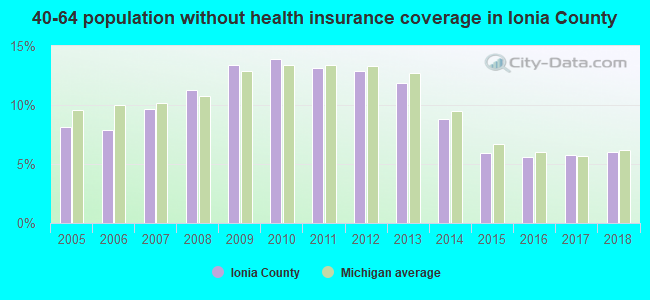
| Ionia County: | 11.5% |
| Michigan: | 13.4% |
Median age of residents in 2022: 41.3 years old
(Males: 41.1 years old, Females: 41.5 years old)
(Median age for: White residents: 41.8 years old, Black residents: 33.5 years old, American Indian residents: 69.0 years old, Asian residents: 40.2 years old, Hispanic or Latino residents: 28.4 years old, Other race residents: 47.0 years old)
Fair market rent in 2006 for a 1-bedroom apartment in Ionia County is $455 a month.
Fair market rent for a 2-bedroom apartment is $555 a month.
Fair market rent for a 3-bedroom apartment is $664 a month.
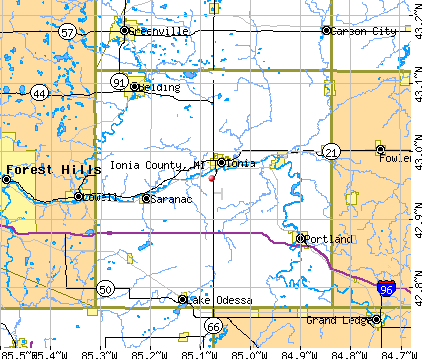
Cities in this county include: Ionia, Belding, Portland, Lake Odessa, Saranac, Lyons, Muir, Pewamo, Hubbardston, Clarksville.
Notable locations in this county outside city limits:
Notable locations in Ionia County: Anne Char Farms (A), Arens Brothers Dairy Farm (B), Rock N Oak Dairy (C), Havengreen Organic Dairy (D), Hufnagel Dairy (E), Blue Pine Dairy (F), T and H Dairy (G), Wieber Dairy (H), Bancroft Farms (I), Piggott Farms (J), Rocky Island Farm (K), Fitzpatrick Farms (L), Schneider Dairy Farm (M), Dutch Meadows Dairy (N), Double D Farm (O), Evergreen Dairy (P), Harte Farms (Q), Kurncz Farms (R), Rich - Ro Farms (S), Schrader Dairy (T). Display/hide their locations on the map
Churches in Ionia County include: Church of the Bible Covenant (A), Greenbush Church (B), Grove Bible Church (C), Highway Tabernacle (D), South Bingham Church (E), Lakeside Chapel (F), Wesleyan Church (G), Wayside Chapel (H), Rose Lake Church (I). Display/hide their locations on the map
Cemeteries: Wager Cemetery (1), Chapel Hill Memorial Gardens (2), Duplain Cemetery (3), Rose Cemetery (4), East Plains Cemetery (5), Alward Lake Cemetery (6), Eureka Cemetery (7). Display/hide their locations on the map
Lakes, reservoirs, and swamps: Richmond Lake (A), Potter Lake (B), Perch Lake (C), Park Lake (D), Whitman Lake (E), Muskrat Lake (F), Mud Lake (G), Montague Lake (H). Display/hide their locations on the map
Streams, rivers, and creeks: Bad Creek (A), Baker Creek (B), Vermilion Creek (C), Peet Creek (D), Hamilton Drain (E), Wise Creek (F), Hayworth Creek (G), Holden Drain (H), Ives Drain (I). Display/hide their locations on the map
Parks in Ionia County include: Sleepy Hollow State Park (1), Padgett Park (2), Gunnisonville United Methodist Church Historical Marker (3), Gunnisonville Historical Marker (4), Michigan's Capitol Historical Marker (5), Greenbush United Methodist Church Historical Marker (6), Joshua Simmons II Historical Marker (7), Rochester Colony Historical Marker (8), Philip Orin Parmelee Historical Marker (9). Display/hide their locations on the map
Neighboring counties: Barry County  , Genesee County, New York
  , Livingston County
  , Montcalm County
  , Muskegon County
  , Shiawassee County .
| Here: | 3.2% |
| Michigan: | 3.5% |
Current college students: 1,877
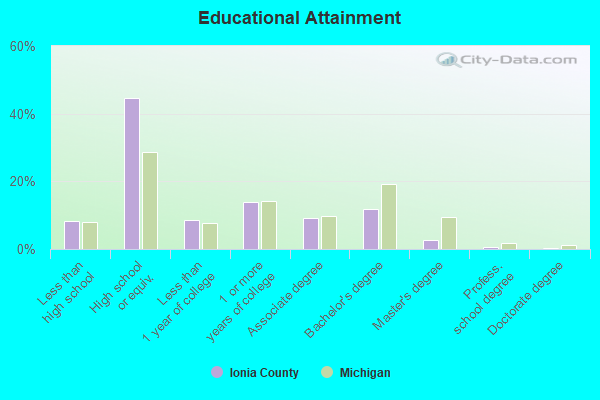
People 25 years of age or older with a high school degree or higher: 89.9%
People 25 years of age or older with a bachelor's degree or higher: 20.3%
Number of foreign born residents: 974 (57.6% naturalized citizens)
| Ionia County: | 1.5% |
| Whole state: | 6.9% |
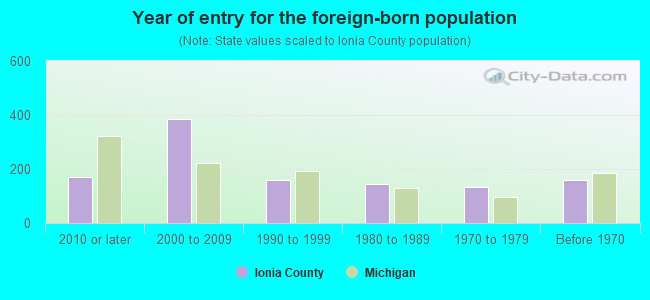
- Year of entry for the foreign-born population
- 1492010 or later
- 3592000 to 2009
- 1161990 to 1999
- 1431980 to 1989
- 1351970 to 1979
- 158Before 1970
Mean travel time to work (commute): minutes
Percentage of county residents living and working in this county: 99.6%
Housing units in structures:
- One, detached: 18,536
- One, attached: 391
- Two: 149
- 3 or 4: 370
- 5 to 9: 479
- 10 to 19: 414
- 20 to 49: 594
- 50 or more: 277
- Mobile homes: 3,659
Housing units in Ionia County with a mortgage: 10,833 (714 second mortgage, 19 home equity loan, 593 both second mortgage and home equity loan)
Houses without a mortgage: 192
| Here: | 5.0% with mortgage |
| State: | 96.7% with mortgage |
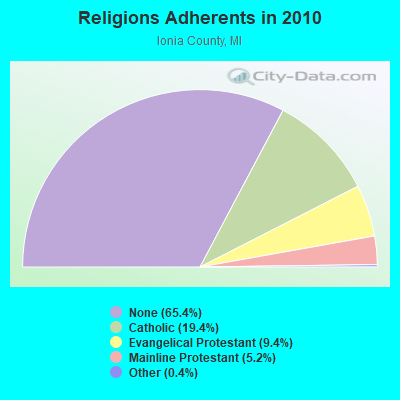
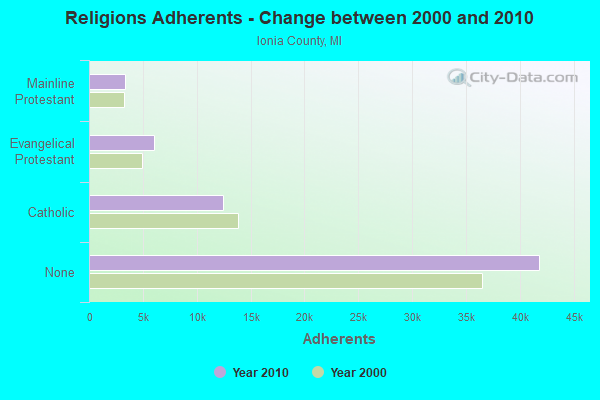
Religion statistics for Ionia County
| Religion | Adherents | Congregations |
|---|---|---|
| Catholic | 12,410 | 8 |
| Evangelical Protestant | 6,029 | 48 |
| Mainline Protestant | 3,348 | 22 |
| Other | 263 | 2 |
| Orthodox | 30 | 1 |
| None | 41,825 | - |
Source: Clifford Grammich, Kirk Hadaway, Richard Houseal, Dale E.Jones, Alexei Krindatch, Richie Stanley and Richard H.Taylor. 2012. 2010 U.S.Religion Census: Religious Congregations & Membership Study. Association of Statisticians of American Religious Bodies. Jones, Dale E., et al. 2002. Congregations and Membership in the United States 2000. Nashville, TN: Glenmary Research Center.
Food Environment Statistics:
| Ionia County: | 1.72 / 10,000 pop. |
| State: | 2.34 / 10,000 pop. |
| Here: | 0.31 / 10,000 pop. |
| Michigan: | 0.18 / 10,000 pop. |
| This county: | 2.34 / 10,000 pop. |
| Michigan: | 1.52 / 10,000 pop. |
| Ionia County: | 2.34 / 10,000 pop. |
| Michigan: | 2.99 / 10,000 pop. |
| This county: | 3.59 / 10,000 pop. |
| State: | 6.80 / 10,000 pop. |
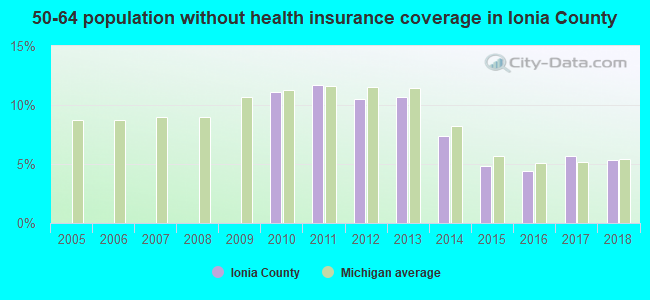
| Ionia County: | 8.2% |
| Michigan: | 9.7% |
| Ionia County: | 29.3% |
| State: | 29.7% |
| Here: | 17.6% |
| State: | 13.4% |
Agriculture in Ionia County:
Average size of farms: 201 acresAverage value of agricultural products sold per farm: $98,668
Average value of crops sold per acre for harvested cropland: $213.08
The value of livestock, poultry, and their products as a percentage of the total market value of agricultural products sold: 67.96%
Average total farm production expenses per farm: $79,565
Harvested cropland as a percentage of land in farms: 73.88%
Irrigated harvested cropland as a percentage of land in farms: 1.89%
Average market value of all machinery and equipment per farm: $93,986
The percentage of farms operated by a family or individual: 92.50%
Average age of principal farm operators: 53 years
Average number of cattle and calves per 100 acres of all land in farms: 15.05
Milk cows as a percentage of all cattle and calves: 33.09%
Corn for grain: 64908 harvested acres
All wheat for grain: 12104 harvested acres
Soybeans for beans: 59360 harvested acres
Vegetables: 625 harvested acres
Land in orchards: 910 acres
Tornado activity:
Ionia County historical area-adjusted tornado activity is significantly below Michigan state average. It is 1981530.9 times below overall U.S. average.Tornadoes in this county have caused one fatality and 27 injuries recorded between 1950 and 2004.
On 4/11/1965, a category 4 (max. wind speeds 207-260 mph) tornado killed one person and injured 8 people and caused between $50,000 and $500,000 in damages.
Earthquake activity:
Ionia County-area historical earthquake activity is significantly above Michigan state average. It is 34% smaller than the overall U.S. average.On 5/2/2015 at 16:23:07, a magnitude 4.2 (4.2 MW, Depth: 2.8 mi, Class: Light, Intensity: IV - V) earthquake occurred 53.1 miles away from Ionia County center
On 1/31/1986 at 16:46:43, a magnitude 5.0 (5.0 MB, Class: Moderate, Intensity: VI - VII) earthquake occurred 221.4 miles away from the county center
On 9/25/1998 at 19:52:52, a magnitude 5.2 (4.8 MB, 4.3 MS, 5.2 LG, 4.5 MW, Depth: 3.1 mi) earthquake occurred 260.4 miles away from the county center
On 7/12/1986 at 08:19:37, a magnitude 4.5 (4.5 MB) earthquake occurred 171.5 miles away from the county center
On 4/18/2008 at 09:36:59, a magnitude 5.4 (5.1 MB, 4.8 MS, 5.4 MW, 5.2 MW) earthquake occurred 344.7 miles away from Ionia County center
On 7/27/1980 at 18:52:21, a magnitude 5.2 (5.1 MB, 4.7 MS, 5.0 UK, 5.2 UK) earthquake occurred 334.2 miles away from the county center
Magnitude types: regional Lg-wave magnitude (LG), body-wave magnitude (MB), surface-wave magnitude (MS), moment magnitude (MW)
Most recent natural disasters:
- Michigan Covid-19 Pandemic, Incident Period: January 20, 2020, FEMA Id: 4494, Natural disaster type: Other
- Michigan Flooding, Incident Period: April 16, 2013 to May 15, 2013, Major Disaster (Presidential) Declared DR-4121: June 18, 2013, FEMA Id: 4121, Natural disaster type: Flood
- Michigan Hurricane Katrina Evacuation, Incident Period: August 29, 2005 to October 01, 2005, Emergency Declared EM-3225: September 07, 2005, FEMA Id: 3225, Natural disaster type: Hurricane
- Michigan Severe Storms, Tornadoes and Flooding, Incident Period: May 20, 2004 to June 08, 2004, Major Disaster (Presidential) Declared DR-1527: June 30, 2004, FEMA Id: 1527, Natural disaster type: Storm, Tornado, Flood
- Michigan Severe Winter Storm, Incident Period: December 11, 2000 to December 31, 2000, Emergency Declared EM-3160: January 10, 2001, FEMA Id: 3160, Natural disaster type: Winter Storm
- Michigan Winter Storm, Incident Period: January 02, 1999 to January 15, 1999, Emergency Declared EM-3137: January 27, 1999, FEMA Id: 3137, Natural disaster type: Winter Storm
- Michigan Severe Storms And Straight-Line Winds, Incident Period: May 29, 1998 to May 31, 1998, Major Disaster (Presidential) Declared DR-1226: June 24, 1998, FEMA Id: 1226, Natural disaster type: Storm, Wind
- Michigan SEVERE STORMS, FLOODING, Incident Period: September 10, 1986 to October 10, 1986, Major Disaster (Presidential) Declared DR-774: September 18, 1986, FEMA Id: 774, Natural disaster type: Storm, Flood
- Michigan Blizzards and Snowstorms, Incident Period: January 27, 1978, Emergency Declared EM-3057: January 27, 1978, FEMA Id: 3057, Natural disaster type: Snowstorm, Blizzard
- Michigan Snowstorms, Incident Period: February 05, 1977, Emergency Declared EM-3030: February 05, 1977, FEMA Id: 3030, Natural disaster type: Snowstorm
- 3 other natural disasters have been reported since 1953.
The number of natural disasters in Ionia County (13) is near the US average (15).
Major Disasters (Presidential) Declared: 7
Emergencies Declared: 5
Causes of natural disasters: Storms: 6, Floods: 5, Snowstorms: 2, Tornadoes: 2, Winds: 2, Winter Storms: 2, Blizzard: 1, Freeze: 1, Hurricane: 1, Other: 1 (Note: some incidents may be assigned to more than one category).
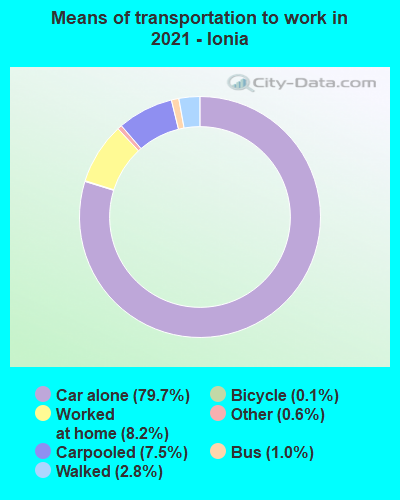
Means of transportation to work:
- Drove a car alone: 15,591 (73.2%)
- Carpooled: 1,664 (7.8%)
- Bus: 213 (1.0%)
- Taxicab, motorcycle, or other means: 199 (0.9%)
- Bicycle: 57 (0.3%)
- Walked: 612 (2.9%)
- Worked at home: 2,947 (13.8%)
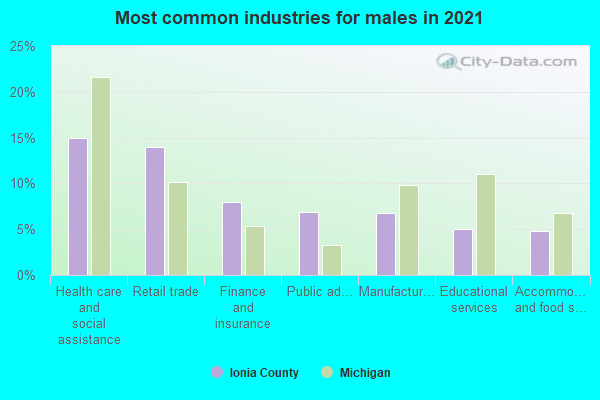
- Health care and social assistance (14%)
- Retail trade (11%)
- Manufacturing (10%)
- Finance and insurance (8%)
- Other services, except public administration (6%)
- Educational services (6%)
- Professional, scientific, and technical services (5%)
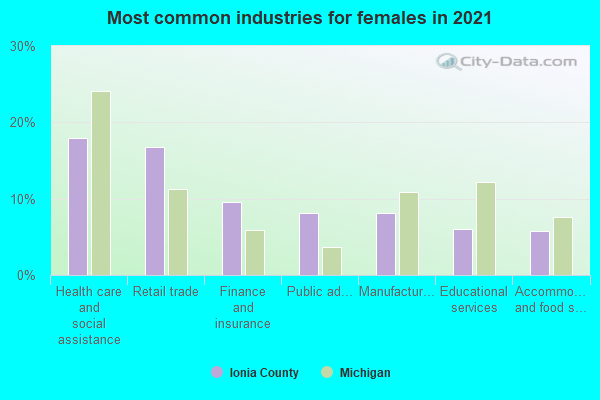
- Health care and social assistance (17%)
- Retail trade (13%)
- Manufacturing (12%)
- Finance and insurance (10%)
- Other services, except public administration (7%)
- Educational services (7%)
- Professional, scientific, and technical services (6%)
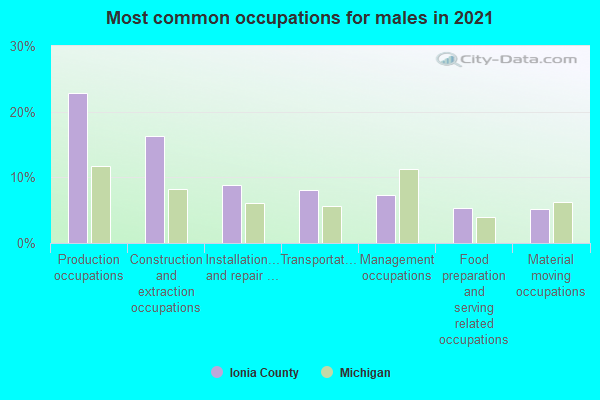
- Production occupations (16%)
- Installation, maintenance, and repair occupations (11%)
- Material moving occupations (10%)
- Construction and extraction occupations (8%)
- Management occupations (7%)
- Sales and related occupations (7%)
- Transportation occupations (5%)
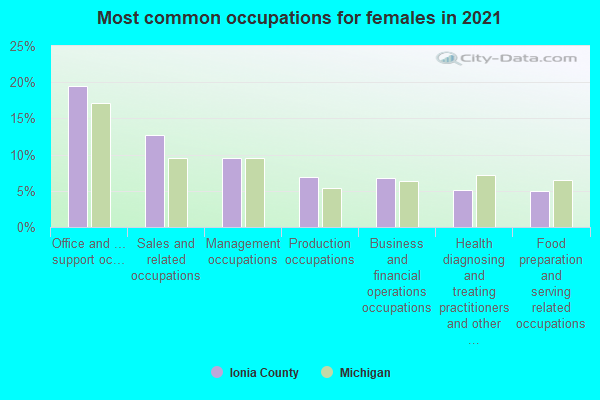
- Office and administrative support occupations (22%)
- Production occupations (11%)
- Business and financial operations occupations (9%)
- Sales and related occupations (7%)
- Management occupations (7%)
- Health diagnosing and treating practitioners and other technical occupations (7%)
- Food preparation and serving related occupations (6%)
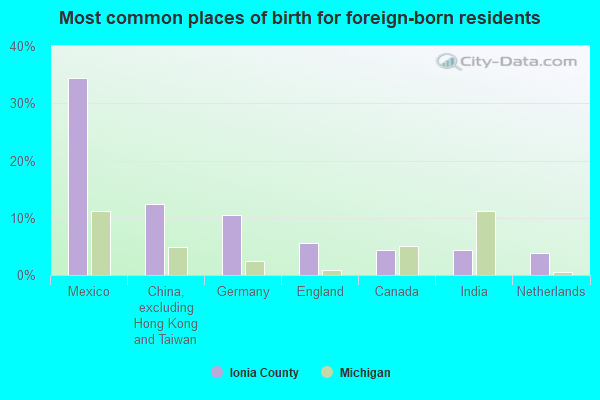
- Mexico (38%)
- Germany (11%)
- China, excluding Hong Kong and Taiwan (7%)
- Canada (5%)
- United Kingdom, excluding England and Scotland (5%)
- England (5%)
- Netherlands (3%)
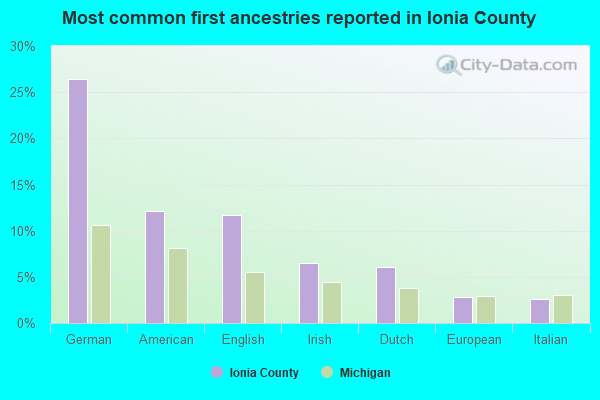
- German (24%)
- American (14%)
- English (12%)
- Irish (6%)
- Dutch (6%)
- European (3%)
- Italian (2%)
People in group quarters in Ionia County, Michigan in 2010:
- 5,033 people in state prisons
- 189 people in nursing facilities/skilled-nursing facilities
- 120 people in group homes intended for adults
- 112 people in local jails and other municipal confinement facilities
- 47 people in workers' group living quarters and job corps centers
- 15 people in residential treatment centers for adults
- 8 people in other noninstitutional facilities
People in group quarters in Ionia County, Michigan in 2000:
- 5,125 people in state prisons
- 289 people in nursing homes
- 122 people in local jails and other confinement facilities (including police lockups)
- 119 people in other noninstitutional group quarters
- 100 people in other group homes
- 19 people in agriculture workers' dormitories on farms
- 12 people in homes for the mentally retarded
- 3 people in religious group quarters
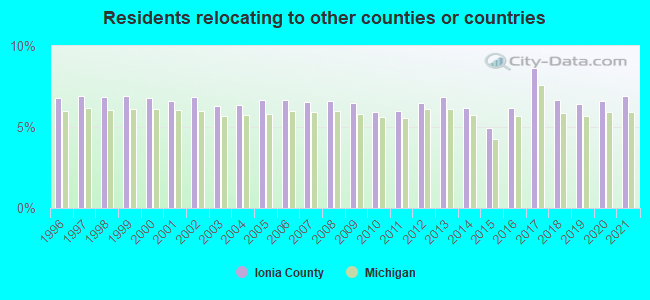
7.81% of this county's 2021 resident taxpayers lived in other counties in 2020 ($42,867 average adjusted gross income)
| Here: | 7.81% |
| Michigan average: | 5.83% |
10 or fewer of this county's residents moved from foreign countries.
6.69% relocated from other counties in Michigan ($36,672 average AGI)
1.12% relocated from other states ($6,195 average AGI)
Ionia County: 1.12% Michigan average: 1.78%

Top counties from which taxpayers relocated into this county between 2020 and 2021:
| from Kent County, MI | |
| from Montcalm County, MI | |
| from Eaton County, MI | |
| from Ingham County, MI | |
| from Barry County, MI | |
| from Wayne County, MI | |
| from Clinton County, MI |
6.94% of this county's 2020 resident taxpayers moved to other counties in 2021 ($46,183 average adjusted gross income)
| Here: | 6.94% |
| Michigan average: | 5.95% |
10 or fewer of this county's residents moved to foreign countries.
6.02% relocated to other counties in Michigan ($39,325 average AGI)
0.92% relocated to other states ($6,859 average AGI)
Ionia County: 0.92% Michigan average: 1.91%
Top counties to which taxpayers relocated from this county between 2020 and 2021:
| to Kent County, MI | |
| to Montcalm County, MI | |
| to Eaton County, MI | |
| to Barry County, MI | |
| to Clinton County, MI | |
| to Ingham County, MI | |
| to Muskegon County, MI |
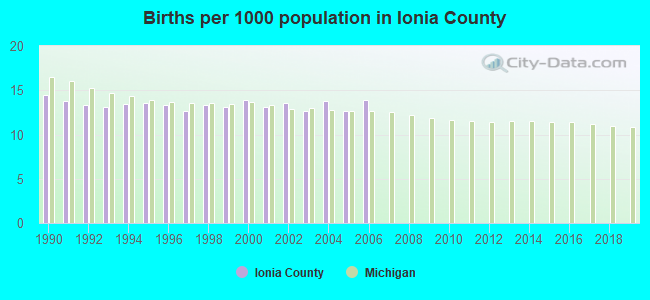
Births per 1000 population from 1990 to 1999: 13.4
Births per 1000 population from 2000 to 2006: 13.4
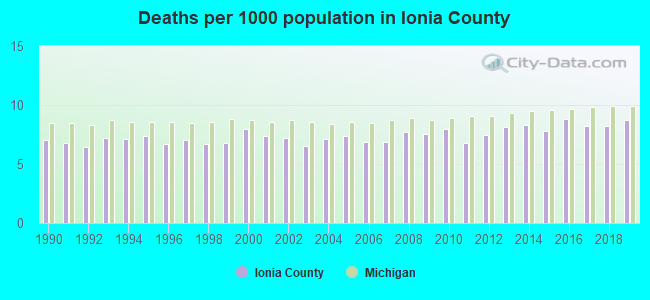
Deaths per 1000 population from 1990 to 1999: 6.9
Deaths per 1000 population from 2000 to 2009: 7.3
Deaths per 1000 population from 2010 to 2020: 8.2
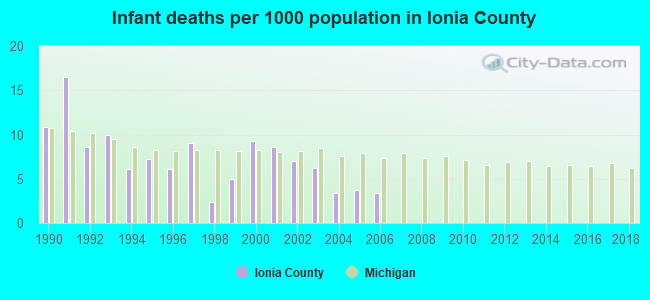
Infant deaths per 1000 live births from 1990 to 1999: 8.2
Infant deaths per 1000 live births from 2000 to 2006: 5.9
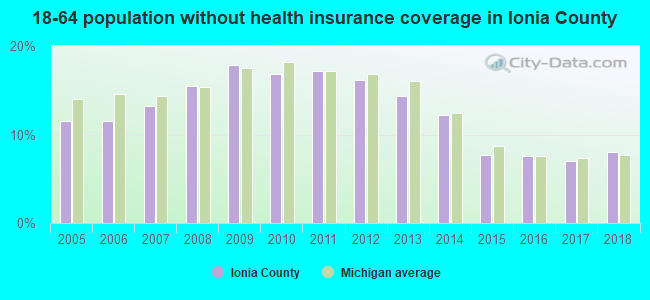
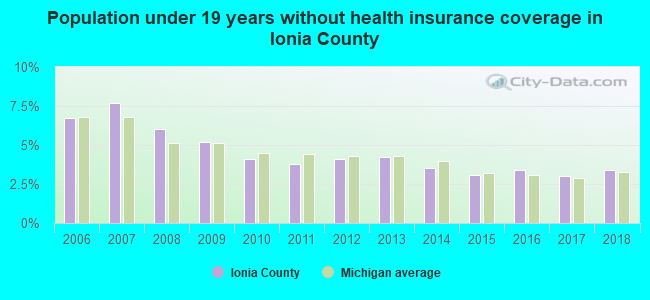
Persons under 19 years old without health insurance coverage in 2018: 3.4%
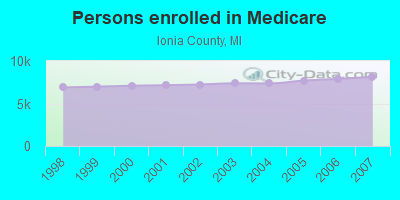
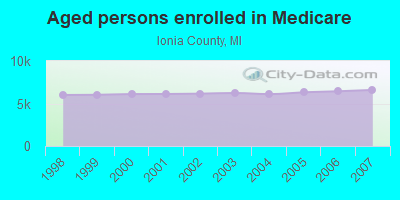
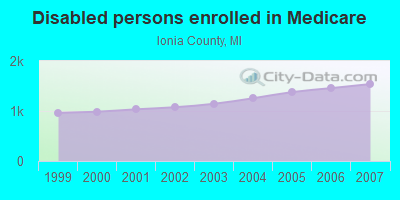
Persons enrolled in hospital insurance and/or supplemental medical insurance (Medicare) in July 1, 2007: 8,132 (6,593 aged, 1,539 disabled)
Children under 18 without health insurance coverage in 2007: 899 (5%)
Most common underlying causes of death in Ionia County, Michigan in 1999 - 2019:
- Atherosclerotic heart disease (865)
- Bronchus or lung, unspecified - Malignant neoplasms (676)
- Chronic obstructive pulmonary disease, unspecified (490)
- Alzheimer disease, unspecified (444)
- Acute myocardial infarction, unspecified (395)
- Congestive heart failure (303)
- Stroke, not specified as haemorrhage or infarction (212)
- Unspecified dementia (200)
- Atherosclerotic cardiovascular disease, so described (137)
- Pneumonia, unspecified (114)
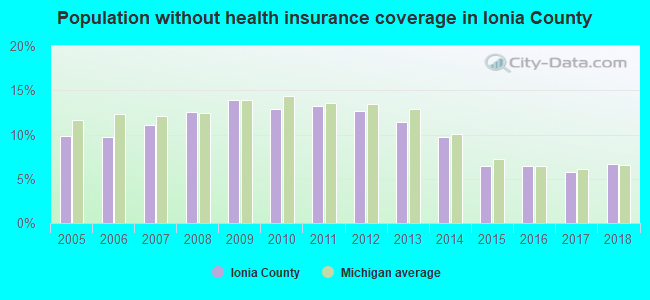
Population without health insurance coverage in 2000: 10%
Children under 18 without health insurance coverage in 2000: 6%
Short term general hospital admissions per 100,000 population in 2004: 1,309
Short term general hospital beds per 100,000 population in 2004: 87
Emergency room visits per 100,000 population in 2004: 21,565
General practice office based MDs per 100,000 population in 2005: 1,326
Medical specialist MDs per 100,000 population in 2005: 757
Dentists per 100,000 population in 1998: 3
Total births per 100,000 population, July 2005 - July 2006 : 28
Total deaths per 100,000 population, July 2005 - July 2006: 46
Limited-service eating places per 100,000 population in 2005 : 12
Suicides per 1,000,000 population from 2000 to 2006: 163.2. This is more than state average.
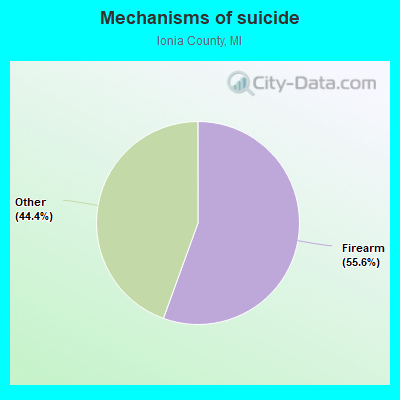
- Firearm - 90.6
- Other - 72.5
Household type by relationship:
Households: 66,809- Male householders: 11,733 (2,528 living alone), Female householders: 11,145 (2,326 living alone)
12,594 spouses (12,529 opposite-sex spouses), 1,870 unmarried partners, (1,870 opposite-sex unmarried partners), 18,647 children (17,421 natural, 464 adopted, 762 stepchildren), 1,214 grandchildren, 660 brothers or sisters, 1,188 parents, 0 foster children, 1,329 other relatives, 3,250 non-relatives
- In group quarters: 3,179
Size of family households: 7,485 2-persons, 2,631 3-persons, 3,627 4-persons, 1,499 5-persons, 724 6-persons, 295 7-or-more-persons.
Size of nonfamily households: 4,854 1-person, 1,590 2-persons, 118 3-persons, 31 4-persons, 24 5-persons.
9,055 married couples with children.
3,449 single-parent households (1,970 men, 1,479 women).
97.0% of residents of Ionia speak English at home.
1.8% of residents speak Spanish at home (72% speak English very well, 10% speak English well, 14% speak English not well, 4% don't speak English at all).
0.5% of residents speak other Indo-European language at home (84% speak English very well, 10% speak English well, 6% speak English not well).
0.2% of residents speak Asian or Pacific Island language at home (86% speak English very well, 14% speak English well).
0.1% of residents speak other language at home (90% speak English very well, 10% speak English well).
In fiscal year 2004:
Federal Government expenditure: $220,856,000 ($3,431 per capita)
Department of Defense expenditure: $2,855,000
Federal direct payments to individuals for retirement and disability: $111,153,000
Federal other direct payments to individuals: $51,168,000
Federal direct payments not to individuals: $6,014,000
Federal grants: $42,951,000
Federal procurement contracts: $2,460,000 ($157,000 Department of Defense)
Federal salaries and wages: $7,109,000 ($0,000 Department of Defense)
Federal Government direct loans: $724,000
Federal guaranteed/insured loans: $26,536,000
Federal Government insurance: $28,194,000
Population change from April 1, 2000 to July 1, 2005:
Births: 4,278| Here: | 66 per 1000 residents |
| State: | 68 per 1000 residents |
Deaths: 2,306
| Here: | 36 per 1000 residents |
| State: | 45 per 1000 residents |
Net international migration: +117
| Here: | +2 per 1000 residents |
| State: | +12 per 1000 residents |
Net internal migration: +1,071
| Here: | |
| State: |
Total withdrawal of fresh water for public supply: 5.13 millions of gallons per day (all from ground)
| Here: | 6.8 |
| State: | 6.5 |
| Here: | 4.5 |
| State: | 4.3 |
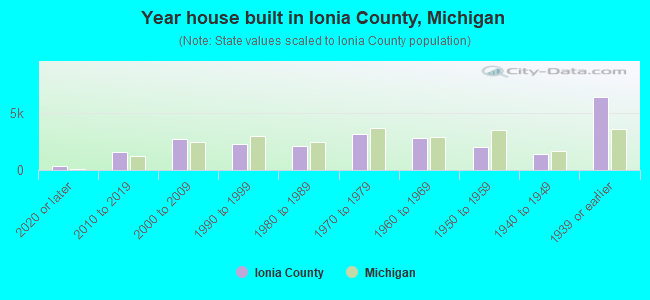
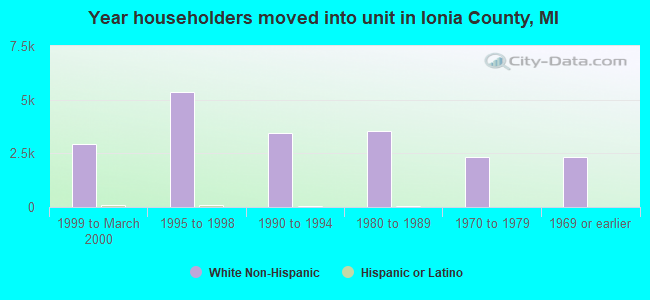
- Year house built in Ionia County, Michigan
- 4672020 or later
- 1,2152010 to 2019
- 3,4112000 to 2009
- 2,9171990 to 1999
- 2,2651980 to 1989
- 3,5311970 to 1979
- 1,5581960 to 1969
- 1,5221950 to 1959
- 7601940 to 1949
- 7,2231939 or earlier
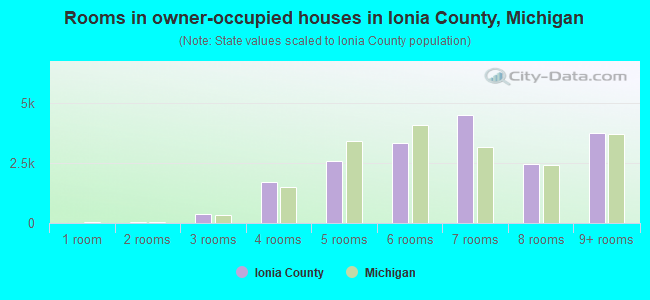
- Rooms in owner-occupied houses in Ionia County, Michigan
- 01 room
- 132 rooms
- 4603 rooms
- 9264 rooms
- 3,0185 rooms
- 3,8656 rooms
- 3,3507 rooms
- 2,4448 rooms
- 4,3759+ rooms
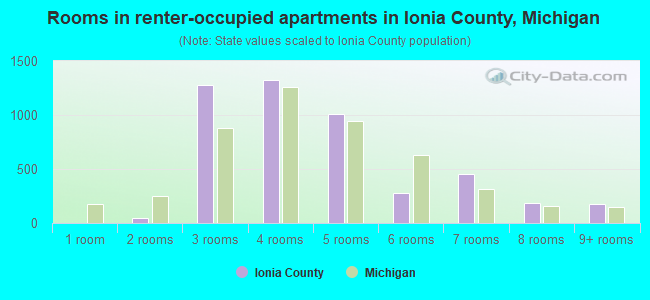
- Rooms in renter-occupied apartments in Ionia County, Michigan
- 711 room
- 1512 rooms
- 4513 rooms
- 1,5494 rooms
- 9995 rooms
- 5286 rooms
- 1337 rooms
- 2458 rooms
- 3009+ rooms
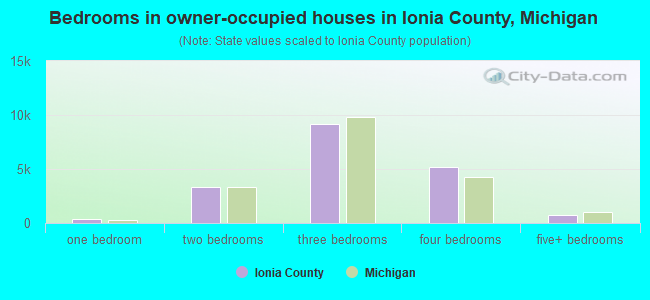
- Bedrooms in owner-occupied houses in Ionia County, Michigan
- 71no bedroom
- 2671 bedroom
- 2,5682 bedrooms
- 9,7773 bedrooms
- 5,0314 bedrooms
- 7375+ bedrooms
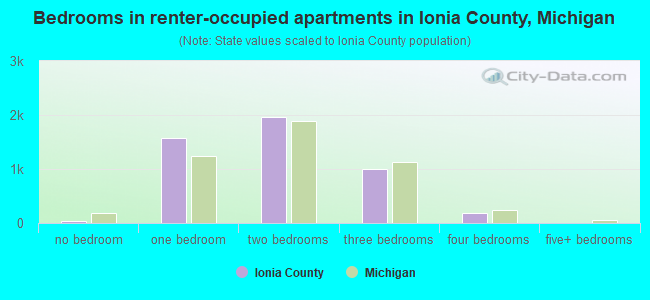
- Bedrooms in renter-occupied apartments in Ionia County, Michigan
- 71no bedroom
- 8751 bedroom
- 1,9692 bedrooms
- 1,2903 bedrooms
- 1724 bedrooms
- 505+ bedrooms
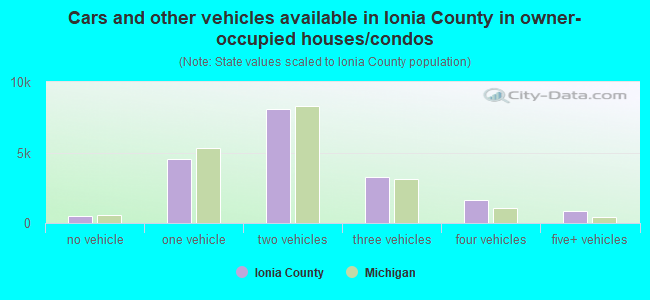
- Cars and other vehicles available in Ionia County in owner-occupied houses/condos
- 401no vehicle
- 3,6261 vehicle
- 8,3822 vehicles
- 4,0813 vehicles
- 1,6424 vehicles
- 3195+ vehicles
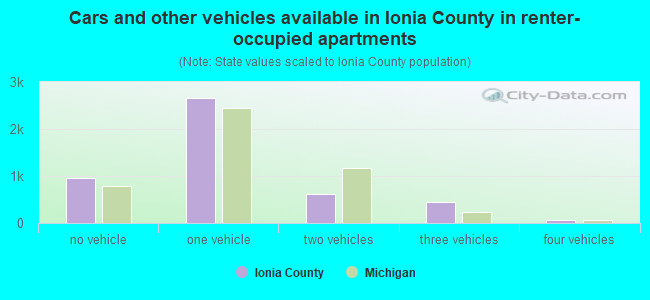
- Cars and other vehicles available in Ionia County in renter-occupied apartments
- 443no vehicle
- 2,0261 vehicle
- 1,5622 vehicles
- 3963 vehicles
- 04 vehicles
- 05+ vehicles
88.9% of Ionia County residents lived in the same house 1 years ago.
Out of people who lived in different houses, 32% lived in this county.
Out of people who lived in different counties, 89% lived in Michigan.
| Ionia County: | 88.9% |
| State average: | 88.4% |
Place of birth for U.S.-born residents:
- This state: 57,328
- Other state: 7,974
- Northeast: 992
- Midwest: 1,689
- South: 2,946
- West: 2,347
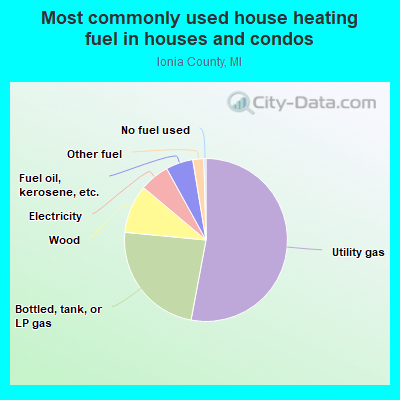
- 53.6%Utility gas
- 25.1%Bottled, tank, or LP gas
- 8.7%Electricity
- 7.3%Wood
- 2.0%Other fuel
- 2.0%Fuel oil, kerosene, etc.
- 1.1%No fuel used
- 0.2%Coal or coke
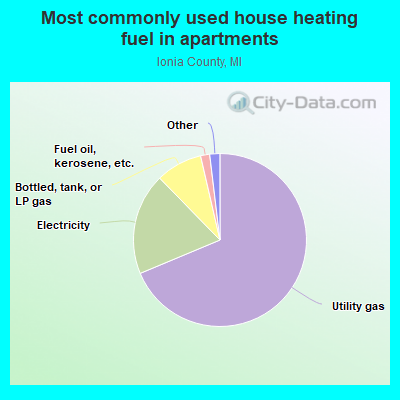
- 59.0%Utility gas
- 19.9%Bottled, tank, or LP gas
- 15.0%Electricity
- 4.0%Fuel oil, kerosene, etc.
- 1.7%Wood
- 0.3%Other fuel
- 0.2%No fuel used
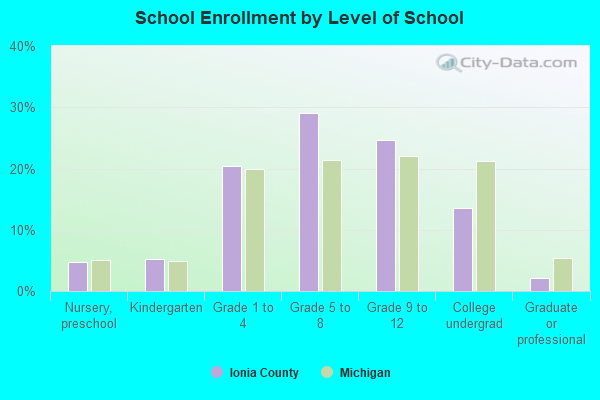
Private vs. public school enrollment:
| Here: | 11.4% |
| Michigan: | 12.4% |
| Here: | 6.3% |
| Michigan: | 9.8% |
| Here: | 15.3% |
| Michigan: | 14.9% |
Ionia County government finances - Expenditure in 2017:
- Charges - Other: $7,652,000
- Current Operations - Regular Highways: $14,252,000
General - Other: $6,054,000
Correctional Institutions: $2,684,000
Judicial and Legal Services: $2,478,000
Health - Other: $2,190,000
Police Protection: $1,974,000
General Public Buildings: $1,141,000
Public Welfare - Other: $931,000
Financial Administration: $787,000
Central Staff Services: $623,000
Protective Inspection and Regulation - Other: $307,000
Parks and Recreation: $136,000
Air Transportation: $80,000
Housing and Community Development: $70,000
- Federal Intergovernmental - Other: $1,727,000
Health and Hospitals: $1,322,000
Public Welfare: $315,000
- General - Interest on Debt: $48,000
- Local Intergovernmental - Highways: $1,947,000
- Long Term Debt - Beginning Outstanding - Unspecified Public Purpose: $1,777,000
Outstanding Unspecified Public Purpose: $1,531,000
Retired Unspecified Public Purpose: $475,000
Issue, Unspecified Public Purpose: $229,000
- Miscellaneous - General Revenue - Other: $1,399,000
Special Assessments: $880,000
Donations From Private Sources: $223,000
Fines and Forfeits: $218,000
Rents: $116,000
Interest Earnings: $28,000
- Other Capital Outlay - Police Protection: $448,000
General - Other: $188,000
Correctional Institutions: $154,000
- Other Funds - Cash and Securities: $15,373,000
- State Intergovernmental - Highways: $6,813,000
Other: $1,320,000
General Local Government Support: $1,181,000
Public Welfare: $324,000
Health and Hospitals: $16,000
- Tax - Property: $8,078,000
Occupation and Business License - Other: $456,000
Other License: $205,000
- Total Salaries and Wages: $9,232,000
Ionia County government finances - Revenue in 2017:
- Charges - Other: $7,652,000
- Current Operations - Regular Highways: $14,252,000
General - Other: $6,054,000
Correctional Institutions: $2,684,000
Judicial and Legal Services: $2,478,000
Health - Other: $2,190,000
Police Protection: $1,974,000
General Public Buildings: $1,141,000
Public Welfare - Other: $931,000
Financial Administration: $787,000
Central Staff Services: $623,000
Protective Inspection and Regulation - Other: $307,000
Parks and Recreation: $136,000
Air Transportation: $80,000
Housing and Community Development: $70,000
- Federal Intergovernmental - Other: $1,727,000
Health and Hospitals: $1,322,000
Public Welfare: $315,000
- General - Interest on Debt: $48,000
- Local Intergovernmental - Highways: $1,947,000
- Long Term Debt - Beginning Outstanding - Unspecified Public Purpose: $1,777,000
Outstanding Unspecified Public Purpose: $1,531,000
Retired Unspecified Public Purpose: $475,000
Issue, Unspecified Public Purpose: $229,000
- Miscellaneous - General Revenue - Other: $1,399,000
Special Assessments: $880,000
Donations From Private Sources: $223,000
Fines and Forfeits: $218,000
Rents: $116,000
Interest Earnings: $28,000
- Other Capital Outlay - Police Protection: $448,000
General - Other: $188,000
Correctional Institutions: $154,000
- Other Funds - Cash and Securities: $15,373,000
- State Intergovernmental - Highways: $6,813,000
Other: $1,320,000
General Local Government Support: $1,181,000
Public Welfare: $324,000
Health and Hospitals: $16,000
- Tax - Property: $8,078,000
Occupation and Business License - Other: $456,000
Other License: $205,000
- Total Salaries and Wages: $9,232,000
Ionia County government finances - Debt in 2017:
- Charges - Other: $7,652,000
- Current Operations - Regular Highways: $14,252,000
General - Other: $6,054,000
Correctional Institutions: $2,684,000
Judicial and Legal Services: $2,478,000
Health - Other: $2,190,000
Police Protection: $1,974,000
General Public Buildings: $1,141,000
Public Welfare - Other: $931,000
Financial Administration: $787,000
Central Staff Services: $623,000
Protective Inspection and Regulation - Other: $307,000
Parks and Recreation: $136,000
Air Transportation: $80,000
Housing and Community Development: $70,000
- Federal Intergovernmental - Other: $1,727,000
Health and Hospitals: $1,322,000
Public Welfare: $315,000
- General - Interest on Debt: $48,000
- Local Intergovernmental - Highways: $1,947,000
- Long Term Debt - Beginning Outstanding - Unspecified Public Purpose: $1,777,000
Outstanding Unspecified Public Purpose: $1,531,000
Retired Unspecified Public Purpose: $475,000
Issue, Unspecified Public Purpose: $229,000
- Miscellaneous - General Revenue - Other: $1,399,000
Special Assessments: $880,000
Donations From Private Sources: $223,000
Fines and Forfeits: $218,000
Rents: $116,000
Interest Earnings: $28,000
- Other Capital Outlay - Police Protection: $448,000
General - Other: $188,000
Correctional Institutions: $154,000
- Other Funds - Cash and Securities: $15,373,000
- State Intergovernmental - Highways: $6,813,000
Other: $1,320,000
General Local Government Support: $1,181,000
Public Welfare: $324,000
Health and Hospitals: $16,000
- Tax - Property: $8,078,000
Occupation and Business License - Other: $456,000
Other License: $205,000
- Total Salaries and Wages: $9,232,000
Ionia County government finances - Cash and Securities in 2017:
- Charges - Other: $7,652,000
- Current Operations - Regular Highways: $14,252,000
General - Other: $6,054,000
Correctional Institutions: $2,684,000
Judicial and Legal Services: $2,478,000
Health - Other: $2,190,000
Police Protection: $1,974,000
General Public Buildings: $1,141,000
Public Welfare - Other: $931,000
Financial Administration: $787,000
Central Staff Services: $623,000
Protective Inspection and Regulation - Other: $307,000
Parks and Recreation: $136,000
Air Transportation: $80,000
Housing and Community Development: $70,000
- Federal Intergovernmental - Other: $1,727,000
Health and Hospitals: $1,322,000
Public Welfare: $315,000
- General - Interest on Debt: $48,000
- Local Intergovernmental - Highways: $1,947,000
- Long Term Debt - Beginning Outstanding - Unspecified Public Purpose: $1,777,000
Outstanding Unspecified Public Purpose: $1,531,000
Retired Unspecified Public Purpose: $475,000
Issue, Unspecified Public Purpose: $229,000
- Miscellaneous - General Revenue - Other: $1,399,000
Special Assessments: $880,000
Donations From Private Sources: $223,000
Fines and Forfeits: $218,000
Rents: $116,000
Interest Earnings: $28,000
- Other Capital Outlay - Police Protection: $448,000
General - Other: $188,000
Correctional Institutions: $154,000
- Other Funds - Cash and Securities: $15,373,000
- State Intergovernmental - Highways: $6,813,000
Other: $1,320,000
General Local Government Support: $1,181,000
Public Welfare: $324,000
Health and Hospitals: $16,000
- Tax - Property: $8,078,000
Occupation and Business License - Other: $456,000
Other License: $205,000
- Total Salaries and Wages: $9,232,000
Supplemental Security Income (SSI) in 2006:
- Total number of recipients: 1,066
- Number of aged recipients: 38
- Number of blind and disabled recipients: 1,028
- Number of recipients under 18: 169
- Number of recipients between 18 and 64: 775
- Number of recipients older than 64: 122
- Number of recipients also receiving OASDI: 395
- Amount of payments (thousands of dollars): 465
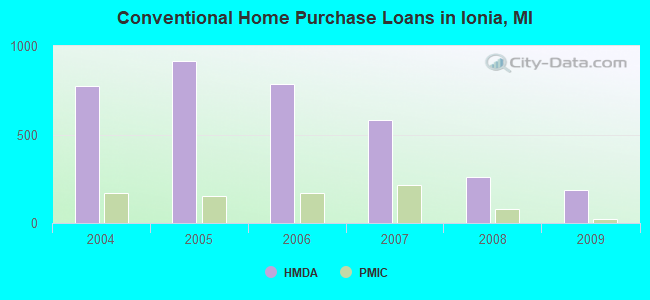
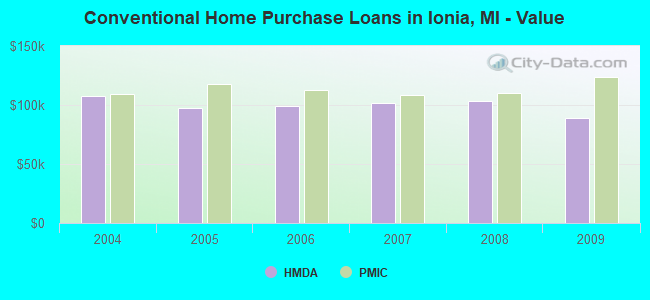
| Home Mortgage Disclosure Act Aggregated Statistics For Year 2009 (Based on 12 full tracts) | ||||||||||||||
| A) FHA, FSA/RHS & VA Home Purchase Loans | B) Conventional Home Purchase Loans | C) Refinancings | D) Home Improvement Loans | E) Loans on Dwellings For 5+ Families | F) Non-occupant Loans on < 5 Family Dwellings (A B C & D) | G) Loans On Manufactured Home Dwelling (A B C & D) | ||||||||
|---|---|---|---|---|---|---|---|---|---|---|---|---|---|---|
| Number | Average Value | Number | Average Value | Number | Average Value | Number | Average Value | Number | Average Value | Number | Average Value | Number | Average Value | |
| LOANS ORIGINATED | 225 | $88,480 | 186 | $89,177 | 1,195 | $116,042 | 100 | $25,620 | 1 | $81,000 | 87 | $71,517 | 94 | $60,170 |
| APPLICATIONS APPROVED, NOT ACCEPTED | 10 | $77,800 | 12 | $73,750 | 106 | $120,547 | 7 | $15,143 | 0 | $0 | 3 | $68,000 | 10 | $66,600 |
| APPLICATIONS DENIED | 60 | $80,150 | 59 | $64,254 | 501 | $130,469 | 61 | $38,000 | 0 | $0 | 32 | $83,406 | 46 | $66,804 |
| APPLICATIONS WITHDRAWN | 43 | $78,302 | 33 | $82,636 | 273 | $128,077 | 9 | $35,667 | 0 | $0 | 19 | $105,632 | 9 | $76,667 |
| FILES CLOSED FOR INCOMPLETENESS | 14 | $66,929 | 12 | $64,333 | 62 | $124,935 | 4 | $98,500 | 0 | $0 | 4 | $45,750 | 1 | $24,000 |
| Private Mortgage Insurance Companies Aggregated Statistics For Year 2009 (Based on 12 full tracts) | ||||||
| A) Conventional Home Purchase Loans | B) Refinancings | C) Non-occupant Loans on < 5 Family Dwellings (A & B) | ||||
|---|---|---|---|---|---|---|
| Number | Average Value | Number | Average Value | Number | Average Value | |
| LOANS ORIGINATED | 24 | $123,958 | 18 | $162,833 | 1 | $90,000 |
| APPLICATIONS APPROVED, NOT ACCEPTED | 10 | $107,700 | 10 | $162,900 | 1 | $61,000 |
| APPLICATIONS DENIED | 13 | $116,000 | 13 | $179,846 | 0 | $0 |
| APPLICATIONS WITHDRAWN | 1 | $122,000 | 2 | $167,000 | 0 | $0 |
| FILES CLOSED FOR INCOMPLETENESS | 4 | $77,250 | 1 | $155,000 | 0 | $0 |
| Most common first names in Ionia County, MI among deceased individuals | ||
| Name | Count | Lived (average) |
|---|---|---|
| John | 266 | 75.4 years |
| William | 238 | 74.8 years |
| Robert | 237 | 71.5 years |
| Mary | 236 | 79.9 years |
| Charles | 189 | 75.1 years |
| George | 187 | 76.2 years |
| Richard | 166 | 68.8 years |
| James | 164 | 71.4 years |
| Harold | 164 | 74.9 years |
| Helen | 135 | 80.0 years |
| Most common last names in Ionia County, MI among deceased individuals | ||
| Last name | Count | Lived (average) |
|---|---|---|
| Smith | 244 | 76.0 years |
| Miller | 122 | 73.6 years |
| Johnson | 90 | 78.3 years |
| Martin | 60 | 79.7 years |
| Cook | 59 | 77.7 years |
| Brown | 57 | 75.1 years |
| Clark | 56 | 74.6 years |
| Wilson | 53 | 76.8 years |
| Fox | 50 | 76.9 years |
| White | 48 | 73.4 years |
| Businesses in Ionia County, MI | ||||
| Name | Count | Name | Count | |
|---|---|---|---|---|
| Applebee's | 1 | Meijer | 1 | |
| Arby's | 2 | Menards | 1 | |
| AutoZone | 1 | Penske | 1 | |
| Burger King | 3 | Pizza Hut | 1 | |
| Chevrolet | 1 | RadioShack | 1 | |
| Dairy Queen | 1 | Rite Aid | 3 | |
| FedEx | 2 | Sears | 1 | |
| GNC | 2 | Sprint Nextel | 2 | |
| H&R Block | 2 | Subway | 6 | |
| Jimmy John's | 7 | Taco Bell | 1 | |
| Jones New York | 2 | True Value | 1 | |
| KFC | 2 | U-Haul | 3 | |
| La-Z-Boy | 1 | UPS | 4 | |
| Little Caesars Pizza | 2 | Walgreens | 1 | |
| Lowe's | 1 | Walmart | 1 | |
| MasterBrand Cabinets | 9 | Wendy's | 2 | |
| McDonald's | 4 | YMCA | 1 | |