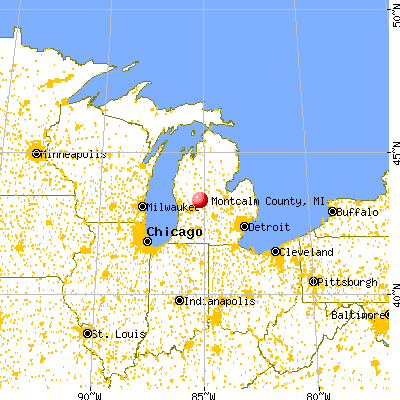
Montcalm County, Michigan (MI)
County owner-occupied free and clear houses and condos in 2010: 6,433
County owner-occupied houses and condos in 2000: 18,014
Renter-occupied apartments: 4,919 (it was 4,065 in 2000)
| % of renters here: | 18% |
| State: | 28% |
Land area: 708 sq. mi.
Water area: 12.9 sq. mi.
Population density: 95 people per square mile (average).
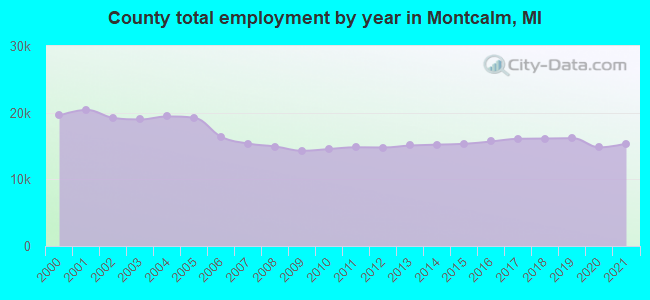
Industries providing employment: Manufacturing (22.3%), Educational, health and social services (18.5%), Retail trade (12.5%), Construction (10.5%).
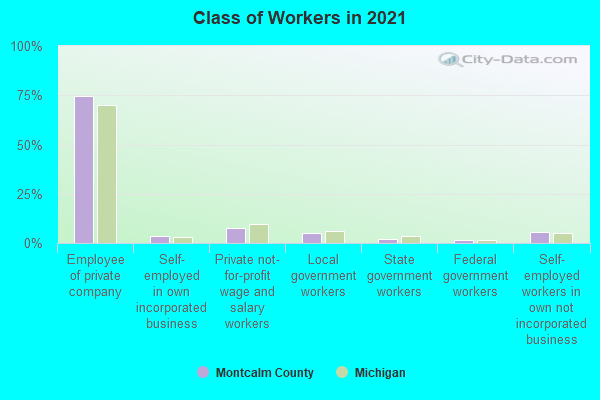
Type of workers:
- Private wage or salary: 83%
- Government: 10%
- Self-employed, not incorporated: 7%
- Unpaid family work: 0%
- OSM Map
- General Map
- Google Map
- MSN Map


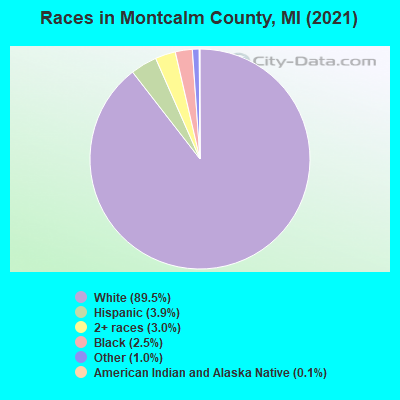
- 58,86887.3%White Non-Hispanic Alone
- 2,9564.4%Two or more races
- 2,6914.0%Hispanic or Latino
- 1,8242.7%Black Non-Hispanic Alone
- 5840.9%Asian alone
- 3680.5%American Indian and Alaska Native alone
- 1420.2%Some other race alone
| Median resident age: | 41.4 years |
| Michigan median age: | 40.3 years |
| Males: 35,547 | |
| Females: 31,886 |

 | Grand Rapids - Should get professional sports teams (62 replies) |
| Moving to Greenville? Seriously? (11 replies) |
| Moving to Michigan..... Wheres the best place? (137 replies) |
| Where are some beautiful or interesting places to visit in MI? (18 replies) |
| How about Greenville? (12 replies) |
| Looking for info about a place in Rural Michigan (4 replies) |
| Montcalm County: | 2.0 people |
| Michigan: | 2 people |
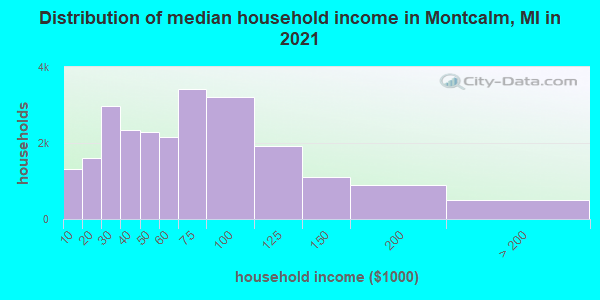
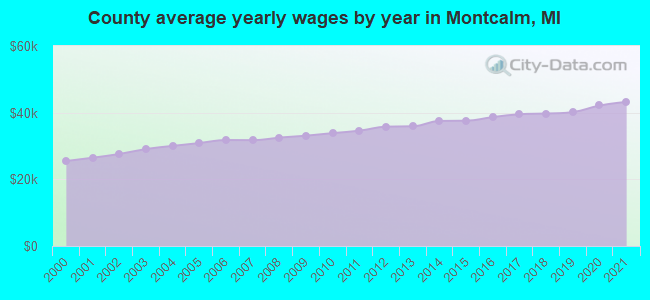
Estimated median household income in 2022: $61,967 ($37,218 in 1999)
| This county: | $61,967 |
| Michigan: | $66,986 |
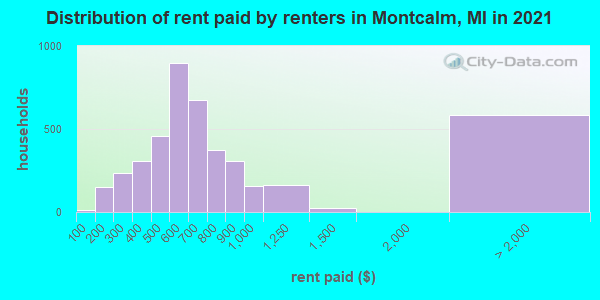
Median contract rent in 2022 for apartments: $599 (lower quartile is $436, upper quartile is $775)
| This county: | $599 |
| State: | $865 |
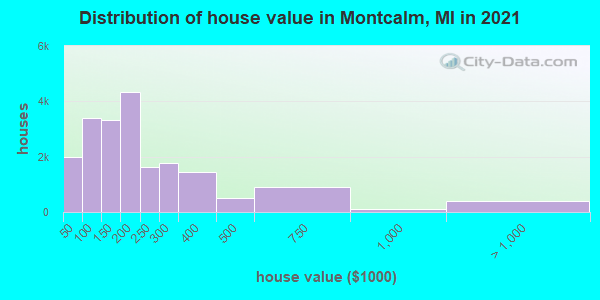
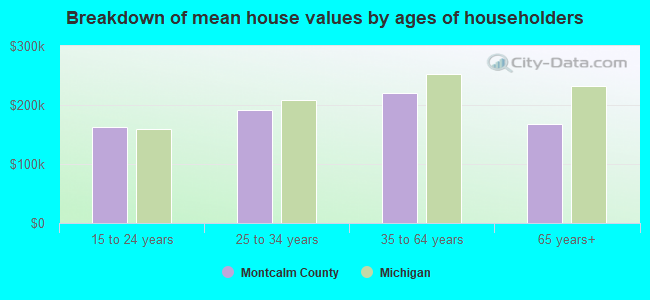
Estimated median house or condo value in 2022: $183,400 (it was $83,300 in 2000)
| Montcalm: | $183,400 |
| Michigan: | $224,400 |
Mean price in 2022:
Median monthly housing costs for homes and condos with a mortgage: $1,223Detached houses: $189,531
Here: $189,531 State: $280,038 Townhouses or other attached units: $182,636
Here: $182,636 State: $239,520 In 2-unit structures: $247,227
Here: $247,227 State: $219,481 In 3-to-4-unit structures: $172,727
Here: $172,727 State: $207,067 In 5-or-more-unit structures: $138,003
Here: $138,003 State: $192,733 Mobile homes: $118,633
Here: $118,633 State: $72,868 Occupied boats, RVs, vans, etc.: $29,251
Here: $29,251 State: $102,281
Median monthly housing costs for units without a mortgage: $474
Institutionalized population: 2,914
Crime in 2021 (reported by the sheriff's office or county police, not the county total):
- Murders: 0
- Rapes: 12
- Robberies: 0
- Assaults: 44
- Burglaries: 37
- Thefts: 183
- Auto thefts: 17
Crime in 2020 (reported by the sheriff's office or county police, not the county total):
- Murders: 0
- Rapes: 4
- Robberies: 1
- Assaults: 12
- Burglaries: 24
- Thefts: 73
- Auto thefts: 7
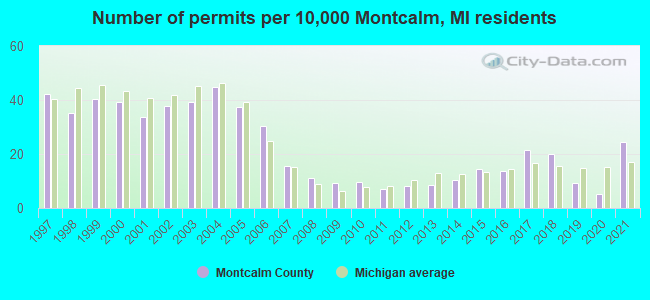
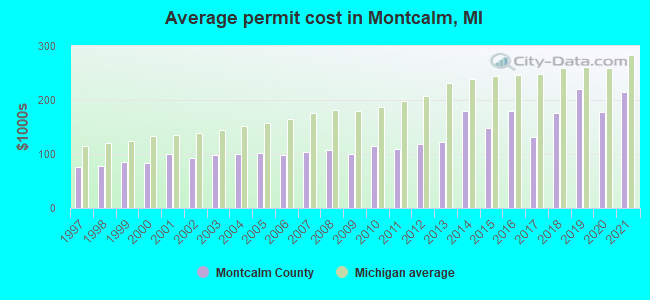
Single-family new house construction building permits:
- 2022: 155 buildings, average cost: $223,000
- 2021: 149 buildings, average cost: $214,100
- 2020: 32 buildings, average cost: $177,600
- 2019: 56 buildings, average cost: $220,900
- 2018: 123 buildings, average cost: $176,200
- 2017: 132 buildings, average cost: $131,700
- 2016: 84 buildings, average cost: $180,000
- 2015: 89 buildings, average cost: $148,000
- 2014: 63 buildings, average cost: $178,500
- 2013: 53 buildings, average cost: $121,600
- 2012: 49 buildings, average cost: $118,800
- 2011: 42 buildings, average cost: $109,700
- 2010: 59 buildings, average cost: $114,300
- 2009: 56 buildings, average cost: $100,100
- 2008: 69 buildings, average cost: $107,600
- 2007: 95 buildings, average cost: $103,000
- 2006: 187 buildings, average cost: $97,900
- 2005: 230 buildings, average cost: $101,800
- 2004: 275 buildings, average cost: $100,000
- 2003: 241 buildings, average cost: $98,500
- 2002: 232 buildings, average cost: $91,600
- 2001: 206 buildings, average cost: $99,600
- 2000: 240 buildings, average cost: $82,700
- 1999: 247 buildings, average cost: $85,400
- 1998: 215 buildings, average cost: $77,900
- 1997: 258 buildings, average cost: $76,000
Median real estate property taxes paid for housing units with mortgages in 2022: $2,010 (1.0%)
Median real estate property taxes paid for housing units with no mortgage in 2022: $1,643 (1.0%)
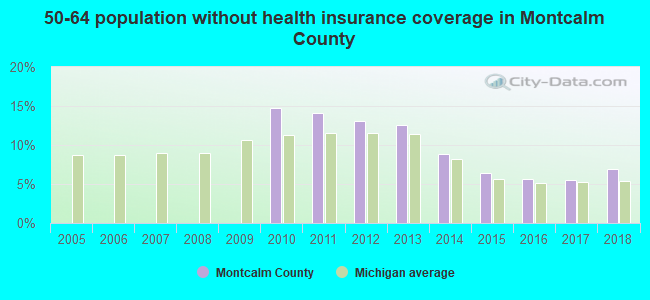
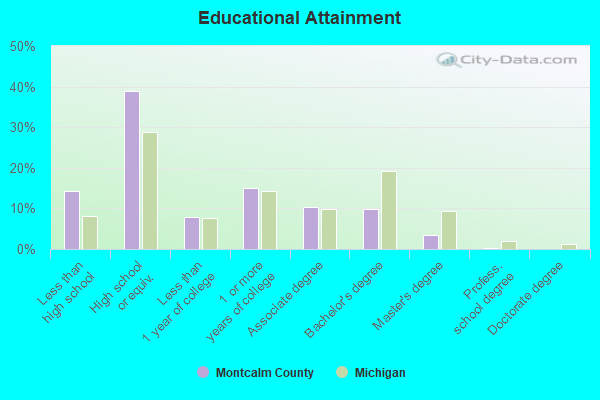
| Montcalm County: | 14.2% |
| Michigan: | 13.4% |
Median age of residents in 2022: 41.4 years old
(Males: 40.8 years old, Females: 42.2 years old)
(Median age for: White residents: 42.9 years old, Black residents: 44.2 years old, American Indian residents: 52.0 years old, Asian residents: 67.6 years old, Hispanic or Latino residents: 26.3 years old, Other race residents: 43.3 years old)
Fair market rent in 2006 for a 1-bedroom apartment in Montcalm County is $454 a month.
Fair market rent for a 2-bedroom apartment is $519 a month.
Fair market rent for a 3-bedroom apartment is $701 a month.
Cities in this county include: Greenville, Howard City, Stanton, Edmore, Carson City, Lakeview, Sheridan, McBride, Pierson.
Notable locations in this county outside city limits:
Notable locations in Montcalm County: Demott Farms (A), Bebow Dairy Farm (B), Double Eagle Dairy (C), Kridner Farms (D), Church of God Camp (E), Meridian Station (F), Pine River Country Club (G), Just In Time Campground (H), Gratiot Country Club (I), Wheeler Station (J), Leisure Lake Family Campground (K), North Star Station (L), Half Moon Lake Campground (M), Pompeii Station (N), Middleton Station (O), Overbrook Golf Course (P), Bannister Station (Q), Ola Station (R), Forest Hill Station (S), Ithaca Rest Area (T). Display/hide their locations on the map
Churches in Montcalm County include: East Washington Church (A), Ely Church (B), Emerson Church (C), First Congregational Church (D), Fulton Center Church (E), Fulton Church (F), Gladwin Cornerstone Baptist Church (G), Immanuel Church (H), Irishtown Church (I). Display/hide their locations on the map
Cemeteries: Payne Cemetery (1), Greenwood Cemetery (2), Hamilton Cemetery (3), Chapel Gardens Cemetery (4), Collier Cemetery (5), Hayes Road Cemetery (6), Collister Cemetery (7). Display/hide their locations on the map
Lakes and reservoirs: Madison Lake (A), Peterman Lake (B), Half Moon Lake (C), Rainbow Lake (D). Display/hide their locations on the map
Streams, rivers, and creeks: Bear Creek (A), Tyman Branch (B), Beaver Drain (C), Ferdon Creek (D), Halterman Creek (E), Honeyoey Creek (F), Brady Creek (G), Otter Creek (H), Shad Creek (I). Display/hide their locations on the map
Parks in Montcalm County include: West Park (1), Reed Park (2), Lumberjack Park Historical Marker (3), Lumberjack Park (4). Display/hide their locations on the map
Neighboring counties: Strafford County, New Hampshire  , Genesee County, New York , Houston County, Minnesota
  , Ionia County
  , Mecosta County
  , Muskegon County , Shiawassee County
  .
.
| Here: | 3.9% |
| Michigan: | 3.5% |
Current college students: 1,937
People 25 years of age or older with a high school degree or higher: 88.0%
People 25 years of age or older with a bachelor's degree or higher: 16.1%
Number of foreign born residents: 2,415 (38.7% naturalized citizens)
| Montcalm County: | 3.6% |
| Whole state: | 6.9% |
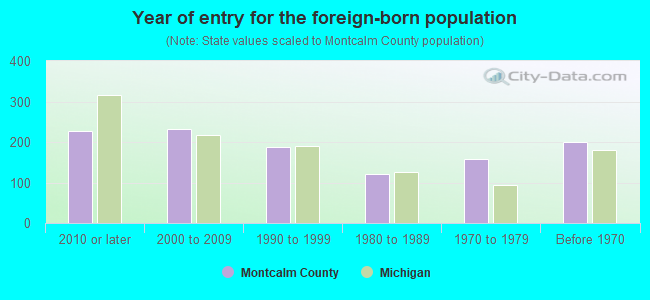
- Year of entry for the foreign-born population
- 6342010 or later
- 3322000 to 2009
- 1491990 to 1999
- 1201980 to 1989
- 1571970 to 1979
- 199Before 1970
Mean travel time to work (commute): minutes
Percentage of county residents living and working in this county: 99.9%

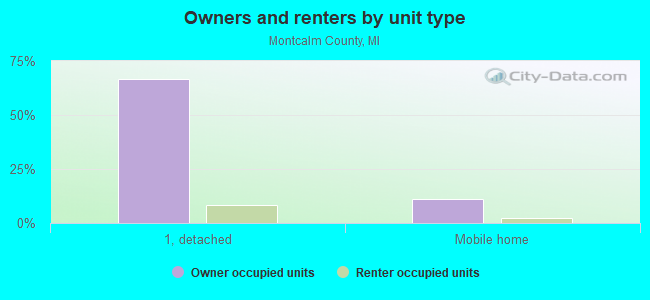
Housing units in structures:
- One, detached: 21,585
- One, attached: 275
- Two: 257
- 3 or 4: 583
- 5 to 9: 544
- 10 to 19: 416
- 20 or more: 379
- Mobile homes: 4,068
- Boats, RVs, vans, etc.: 16
Housing units in Montcalm County with a mortgage: 11,078 (1,104 second mortgage, 0 home equity loan, 1,001 both second mortgage and home equity loan)
Houses without a mortgage: 173
| Here: | 6.0% with mortgage |
| State: | 96.7% with mortgage |
Religion statistics for Montcalm County
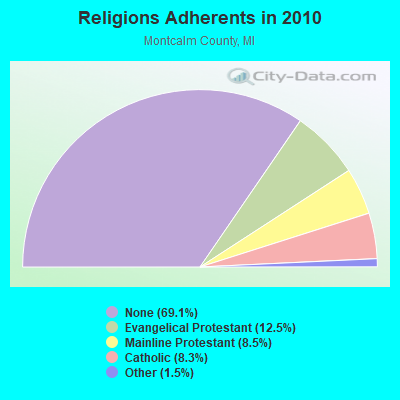
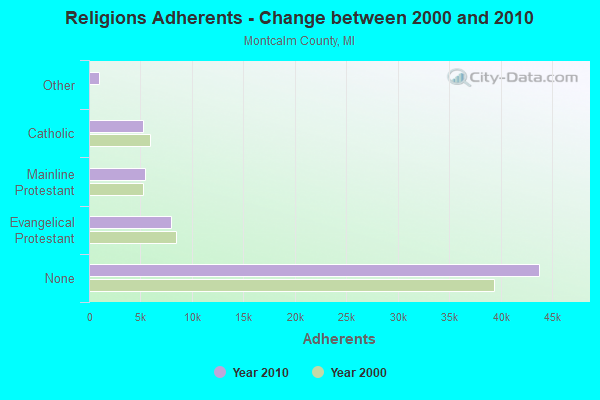
| Religion | Adherents | Congregations |
|---|---|---|
| Evangelical Protestant | 7,948 | 65 |
| Mainline Protestant | 5,404 | 23 |
| Catholic | 5,258 | 8 |
| Other | 947 | 6 |
| None | 43,785 | - |
Source: Clifford Grammich, Kirk Hadaway, Richard Houseal, Dale E.Jones, Alexei Krindatch, Richie Stanley and Richard H.Taylor. 2012. 2010 U.S.Religion Census: Religious Congregations & Membership Study. Association of Statisticians of American Religious Bodies. Jones, Dale E., et al. 2002. Congregations and Membership in the United States 2000. Nashville, TN: Glenmary Research Center.
Food Environment Statistics:
| Montcalm County: | 2.07 / 10,000 pop. |
| State: | 2.34 / 10,000 pop. |
| Here: | 0.48 / 10,000 pop. |
| Michigan: | 0.18 / 10,000 pop. |
| This county: | 0.48 / 10,000 pop. |
| Michigan: | 1.52 / 10,000 pop. |
| Montcalm County: | 4.93 / 10,000 pop. |
| Michigan: | 2.99 / 10,000 pop. |
| This county: | 5.57 / 10,000 pop. |
| State: | 6.80 / 10,000 pop. |
| Montcalm County: | 9.7% |
| Michigan: | 9.7% |
| Montcalm County: | 31.2% |
| State: | 29.7% |
| Here: | 9.3% |
| State: | 13.4% |
Agriculture in Montcalm County:
Average size of farms: 224 acresAverage value of agricultural products sold per farm: $93,338
Average value of crops sold per acre for harvested cropland: $433.26
The value of nursery, greenhouse, floriculture, and sod as a percentage of the total market value of agricultural products sold: 4.11%
The value of livestock, poultry, and their products as a percentage of the total market value of agricultural products sold: 31.66%
Average total farm production expenses per farm: $76,285
Harvested cropland as a percentage of land in farms: 65.68%
Irrigated harvested cropland as a percentage of land in farms: 28.02%
Average market value of all machinery and equipment per farm: $98,166
The percentage of farms operated by a family or individual: 90.78%
Average age of principal farm operators: 54 years
Average number of cattle and calves per 100 acres of all land in farms: 9.85
Milk cows as a percentage of all cattle and calves: 40.49%
Corn for grain: 51949 harvested acres
All wheat for grain: 16388 harvested acres
Soybeans for beans: 16336 harvested acres
Vegetables: 5,267 harvested acres
Land in orchards: 794 acres
Tornado activity:
Montcalm County historical area-adjusted tornado activity is significantly below Michigan state average. It is 3570204.2 times below overall U.S. average.Tornadoes in this county have caused 2 fatalities and 8 injuries recorded between 1950 and 2004.
On 5/12/1956, a category 2 (max. wind speeds 113-157 mph) tornado killed one person and injured 4 people and caused between $50,000 and $500,000 in damages.
Earthquake activity:
Montcalm County-area historical earthquake activity is significantly above Michigan state average. It is 39% smaller than the overall U.S. average.On 5/2/2015 at 16:23:07, a magnitude 4.2 (4.2 MW, Depth: 2.8 mi, Class: Light, Intensity: IV - V) earthquake occurred 75.3 miles away from Montcalm County center
On 1/31/1986 at 16:46:43, a magnitude 5.0 (5.0 MB, Class: Moderate, Intensity: VI - VII) earthquake occurred 236.8 miles away from the county center
On 9/25/1998 at 19:52:52, a magnitude 5.2 (4.8 MB, 4.3 MS, 5.2 LG, 4.5 MW, Depth: 3.1 mi) earthquake occurred 274.9 miles away from the county center
On 7/12/1986 at 08:19:37, a magnitude 4.5 (4.5 MB) earthquake occurred 196.2 miles away from the county center
On 4/18/2008 at 09:36:59, a magnitude 5.4 (5.1 MB, 4.8 MS, 5.4 MW, 5.2 MW) earthquake occurred 364.4 miles away from Montcalm County center
On 6/10/1987 at 23:48:54, a magnitude 5.1 (4.9 MB, 4.4 MS, 4.6 MS, 5.1 LG) earthquake occurred 340.8 miles away from the county center
Magnitude types: regional Lg-wave magnitude (LG), body-wave magnitude (MB), surface-wave magnitude (MS), moment magnitude (MW)
Most recent natural disasters:
- Michigan Covid-19 Pandemic, Incident Period: January 20, 2020, FEMA Id: 4494, Natural disaster type: Other
- Michigan Hurricane Katrina Evacuation, Incident Period: August 29, 2005 to October 01, 2005, Emergency Declared EM-3225: September 07, 2005, FEMA Id: 3225, Natural disaster type: Hurricane
- Michigan Severe Winter Storm, Incident Period: December 11, 2000 to December 31, 2000, Emergency Declared EM-3160: January 10, 2001, FEMA Id: 3160, Natural disaster type: Winter Storm
- Michigan Severe Storms And Straight-Line Winds, Incident Period: May 29, 1998 to May 31, 1998, Major Disaster (Presidential) Declared DR-1226: June 24, 1998, FEMA Id: 1226, Natural disaster type: Storm, Wind
- Michigan SEVERE STORMS, FLOODING, Incident Period: September 10, 1986 to October 10, 1986, Major Disaster (Presidential) Declared DR-774: September 18, 1986, FEMA Id: 774, Natural disaster type: Storm, Flood
- Michigan SEVERE STORMS AND FLOODING, Incident Period: September 05, 1985 to September 28, 1985, Major Disaster (Presidential) Declared DR-744: September 18, 1985, FEMA Id: 744, Natural disaster type: Storm, Flood
- Michigan Blizzards and Snowstorms, Incident Period: January 27, 1978, Emergency Declared EM-3057: January 27, 1978, FEMA Id: 3057, Natural disaster type: Snowstorm, Blizzard
- Michigan Severe Storms, Tornadoes, Icing, Flooding, Incident Period: March 19, 1976, Major Disaster (Presidential) Declared DR-495: March 19, 1976, FEMA Id: 495, Natural disaster type: Storm, Tornado, Flood
- Michigan Severe Storms, High Winds, Flooding, Incident Period: September 30, 1975, Major Disaster (Presidential) Declared DR-486: September 30, 1975, FEMA Id: 486, Natural disaster type: Storm, Flood, Wind
- Michigan TORNADOES, SEVERE STORMS, Incident Period: April 14, 1965, Major Disaster (Presidential) Declared DR-190: April 14, 1965, FEMA Id: 190, Natural disaster type: Storm, Tornado
The number of natural disasters in Montcalm County (10) is smaller than the US average (15).
Major Disasters (Presidential) Declared: 6
Emergencies Declared: 3
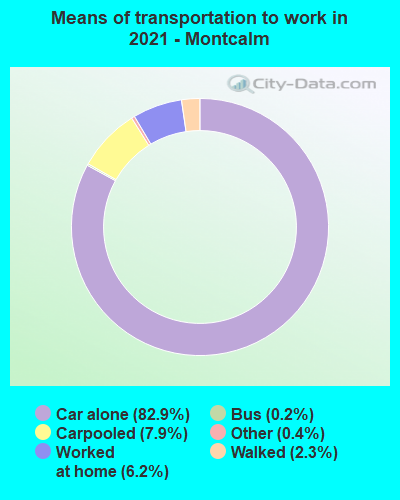
Means of transportation to work:
- Drove a car alone: 16,663 (77.3%)
- Carpooled: 1,849 (8.6%)
- Bus: 52 (0.2%)
- Taxicab, motorcycle, or other means: 224 (1.0%)
- Bicycle: 37 (0.2%)
- Walked: 542 (2.5%)
- Worked at home: 1,933 (9.0%)
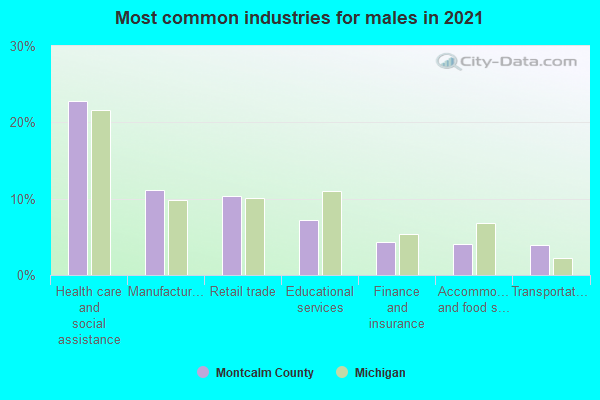
- Health care and social assistance (21%)
- Retail trade (13%)
- Manufacturing (10%)
- Educational services (6%)
- Accommodation and food services (5%)
- Finance and insurance (4%)
- Other services, except public administration (4%)
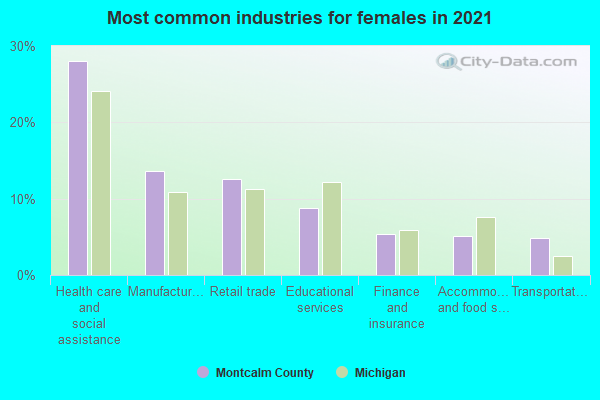
- Health care and social assistance (28%)
- Retail trade (17%)
- Manufacturing (13%)
- Educational services (8%)
- Accommodation and food services (7%)
- Finance and insurance (5%)
- Other services, except public administration (5%)
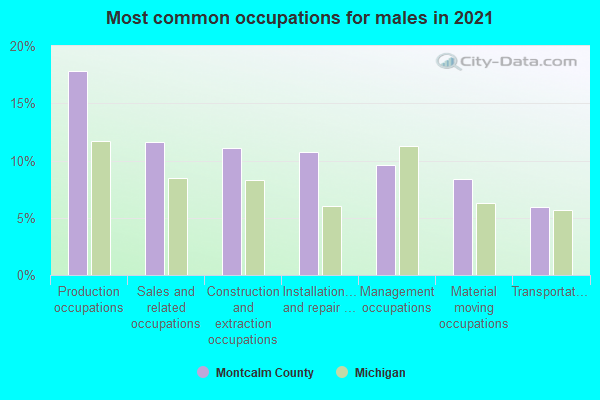
- Production occupations (25%)
- Construction and extraction occupations (14%)
- Transportation occupations (10%)
- Installation, maintenance, and repair occupations (8%)
- Management occupations (6%)
- Sales and related occupations (5%)
- Office and administrative support occupations (5%)
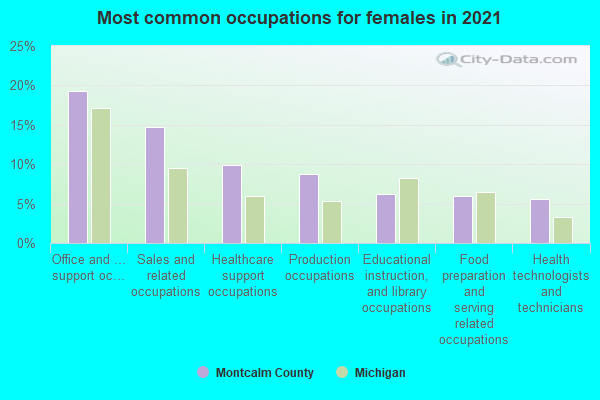
- Office and administrative support occupations (17%)
- Production occupations (12%)
- Sales and related occupations (11%)
- Management occupations (9%)
- Healthcare support occupations (7%)
- Health diagnosing and treating practitioners and other technical occupations (6%)
- Educational instruction, and library occupations (6%)
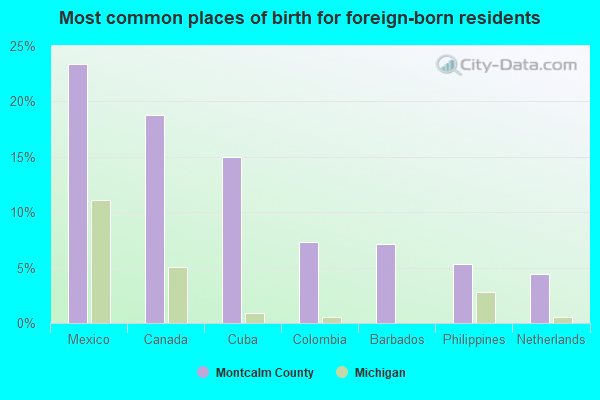
- Jamaica (21%)
- Guatemala (19%)
- Mexico (15%)
- Canada (12%)
- Cuba (6%)
- Iraq (6%)
- Philippines (4%)
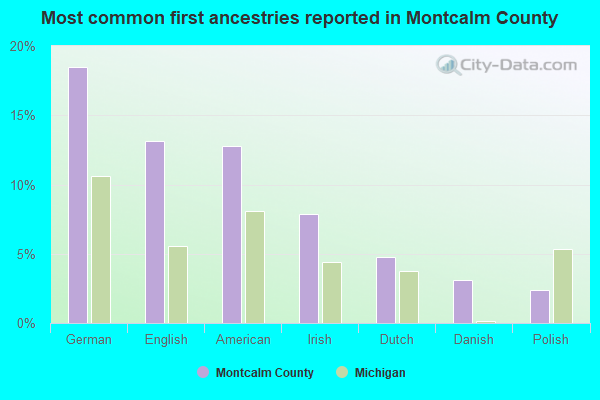
- German (16%)
- English (14%)
- American (13%)
- Irish (9%)
- Dutch (5%)
- Danish (3%)
- European (2%)
People in group quarters in Montcalm County, Michigan in 2010:
- 2,492 people in state prisons
- 241 people in nursing facilities/skilled-nursing facilities
- 198 people in group homes intended for adults
- 181 people in local jails and other municipal confinement facilities
- 20 people in other noninstitutional facilities
- 17 people in workers' group living quarters and job corps centers
- 12 people in emergency and transitional shelters (with sleeping facilities) for people experiencing homelessness
- 2 people in college/university student housing
People in group quarters in Montcalm County, Michigan in 2000:
- 2,210 people in state prisons
- 151 people in nursing homes
- 89 people in local jails and other confinement facilities (including police lockups)
- 72 people in other group homes
- 64 people in homes for the mentally ill
- 47 people in other noninstitutional group quarters
- 45 people in orthopedic wards and institutions for the physically handicapped
- 29 people in homes for the mentally retarded
- 6 people in homes for the physically handicapped
- 2 people in unknown juvenile institutions
- 2 people in agriculture workers' dormitories on farms
8.99% of this county's 2021 resident taxpayers lived in other counties in 2020 ($46,040 average adjusted gross income)
| Here: | 8.99% |
| Michigan average: | 5.83% |
10 or fewer of this county's residents moved from foreign countries.
7.81% relocated from other counties in Michigan ($39,586 average AGI)
1.18% relocated from other states ($6,453 average AGI)
Montcalm County: 1.18% Michigan average: 1.78%
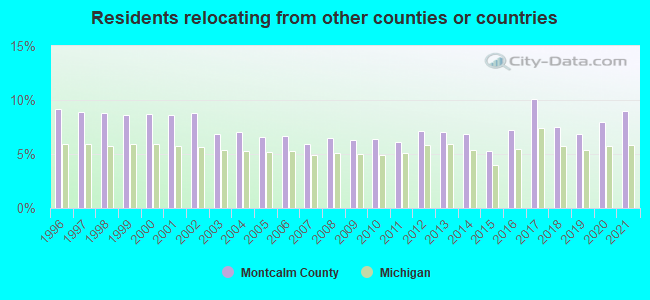
Top counties from which taxpayers relocated into this county between 2020 and 2021:
| from Kent County, MI | |
| from Ionia County, MI | |
| from Gratiot County, MI | |
| from Mecosta County, MI | |
| from Wayne County, MI | |
| from Newaygo County, MI | |
| from Ottawa County, MI |
7.14% of this county's 2020 resident taxpayers moved to other counties in 2021 ($51,676 average adjusted gross income)
| Here: | 7.14% |
| Michigan average: | 5.95% |
10 or fewer of this county's residents moved to foreign countries.
6.09% relocated to other counties in Michigan ($44,366 average AGI)
1.06% relocated to other states ($7,311 average AGI)
Montcalm County: 1.06% Michigan average: 1.91%
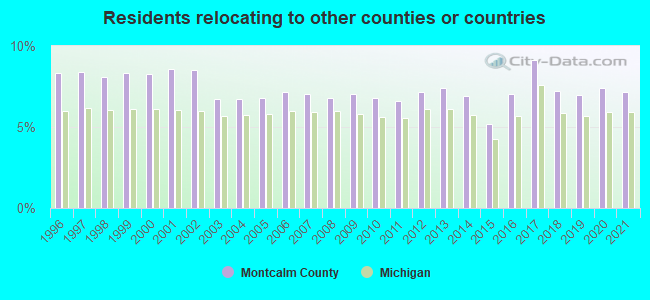
Top counties to which taxpayers relocated from this county between 2020 and 2021:
| to Kent County, MI | |
| to Ionia County, MI | |
| to Mecosta County, MI | |
| to Gratiot County, MI | |
| to Isabella County, MI | |
| to Newaygo County, MI | |
| to Ottawa County, MI |
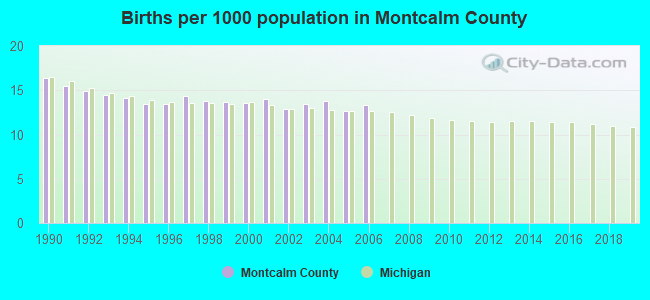
Births per 1000 population from 1990 to 1999: 14.4
Births per 1000 population from 2000 to 2006: 13.4
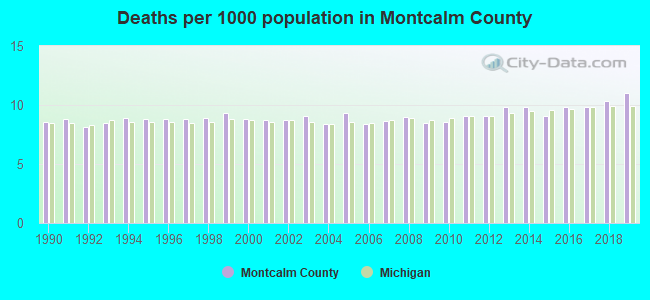
Deaths per 1000 population from 1990 to 1999: 8.8
Deaths per 1000 population from 2000 to 2009: 8.8
Deaths per 1000 population from 2010 to 2020: 9.8
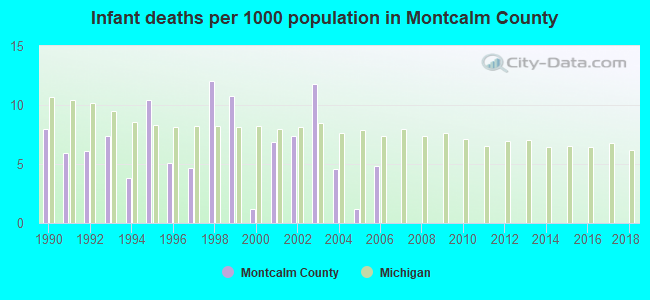
Infant deaths per 1000 live births from 1990 to 1999: 7.4
Infant deaths per 1000 live births from 2000 to 2006: 5.4
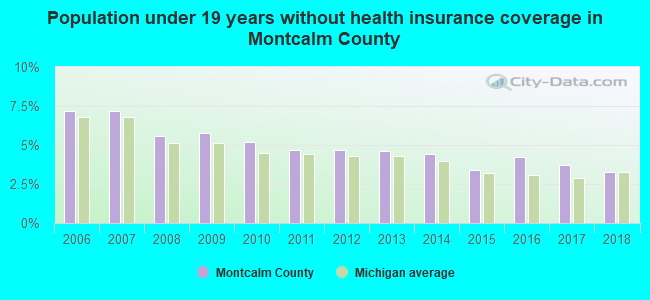
Persons under 19 years old without health insurance coverage in 2018: 3.3%
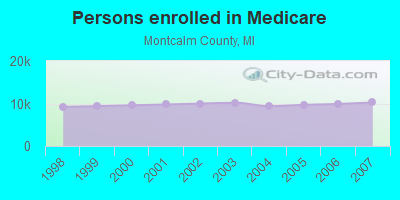
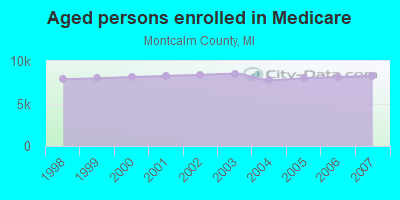
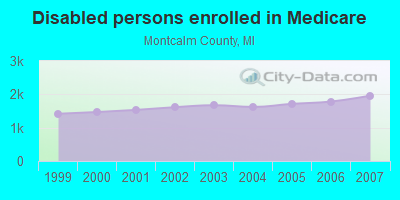
Persons enrolled in hospital insurance and/or supplemental medical insurance (Medicare) in July 1, 2007: 10,247 (8,287 aged, 1,960 disabled)
Children under 18 without health insurance coverage in 2007: 920 (6%)
Most common underlying causes of death in Montcalm County, Michigan in 1999 - 2019:
- Atherosclerotic heart disease (1,137)
- Bronchus or lung, unspecified - Malignant neoplasms (854)
- Chronic obstructive pulmonary disease, unspecified (624)
- Acute myocardial infarction, unspecified (547)
- Stroke, not specified as haemorrhage or infarction (338)
- Alzheimer disease, unspecified (329)
- Atherosclerotic cardiovascular disease, so described (290)
- Congestive heart failure (258)
- Pneumonia, unspecified (214)
- Unspecified dementia (193)
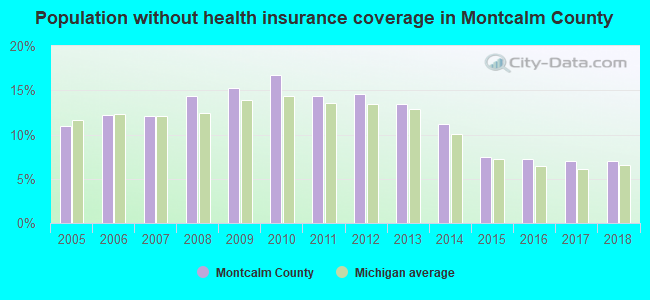
Population without health insurance coverage in 2000: 13%
Children under 18 without health insurance coverage in 2000: 9%
Short term general hospital admissions per 100,000 population in 2004: 8,644
Short term general hospital beds per 100,000 population in 2004: 270
Emergency room visits per 100,000 population in 2004: 70,745
General practice office based MDs per 100,000 population in 2005: 1,440
Medical specialist MDs per 100,000 population in 2005: 840
Dentists per 100,000 population in 1998: 2
Total births per 100,000 population, July 2005 - July 2006 : 28
Total deaths per 100,000 population, July 2005 - July 2006: 66
Limited-service eating places per 100,000 population in 2005 : 17
Suicides per 1,000,000 population from 2000 to 2006: 137.2. This is more than state average.
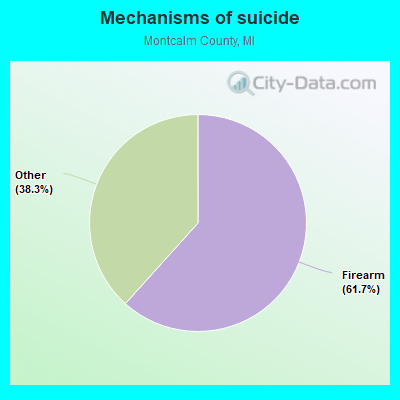
- Firearm - 84.6
- Other - 52.6
Household type by relationship:
Households: 67,433- Male householders: 13,547 (2,305 living alone), Female householders: 11,671 (3,171 living alone)
13,269 spouses (13,223 opposite-sex spouses), 2,642 unmarried partners, (2,558 opposite-sex unmarried partners), 18,593 children (16,369 natural, 620 adopted, 1,604 stepchildren), 1,754 grandchildren, 642 brothers or sisters, 535 parents, 23 foster children, 767 other relatives, 1,664 non-relatives
- In group quarters: 2,326
Size of family households: 9,080 2-persons, 3,857 3-persons, 2,809 4-persons, 1,094 5-persons, 650 6-persons, 485 7-or-more-persons.
Size of nonfamily households: 5,476 1-person, 1,516 2-persons, 146 3-persons, 105 4-persons.
8,092 married couples with children.
4,087 single-parent households (1,329 men, 2,758 women).
96.1% of residents of Montcalm speak English at home.
1.7% of residents speak Spanish at home (52% speak English very well, 20% speak English well, 23% speak English not well, 5% don't speak English at all).
1.3% of residents speak other Indo-European language at home (73% speak English very well, 19% speak English well, 8% speak English not well).
0.5% of residents speak Asian or Pacific Island language at home (80% speak English very well, 12% speak English well, 8% speak English not well).
0.2% of residents speak other language at home (15% speak English very well, 72% speak English well, 6% speak English not well, 7% don't speak English at all).
In fiscal year 2004:
Federal Government expenditure: $298,752,000 ($4,695 per capita)
Department of Defense expenditure: $8,295,000
Federal direct payments to individuals for retirement and disability: $145,966,000
Federal other direct payments to individuals: $70,394,000
Federal direct payments not to individuals: $5,209,000
Federal grants: $62,040,000
Federal procurement contracts: $4,274,000 ($1,980,000 Department of Defense)
Federal salaries and wages: $10,869,000 ($2,247,000 Department of Defense)
Federal Government direct loans: $2,502,000
Federal guaranteed/insured loans: $27,728,000
Federal Government insurance: $21,556,000
Population change from April 1, 2000 to July 1, 2005:
Births: 4,377| Here: | 69 per 1000 residents |
| State: | 68 per 1000 residents |
Deaths: 2,952
| Here: | 46 per 1000 residents |
| State: | 45 per 1000 residents |
Net international migration: +106
| Here: | +2 per 1000 residents |
| State: | +12 per 1000 residents |
Net internal migration: +1,168
| Here: | |
| State: |
Total withdrawal of fresh water for public supply: 3.67 millions of gallons per day (all from ground)
| Here: | 6.3 |
| State: | 6.5 |
| Here: | 4.7 |
| State: | 4.3 |

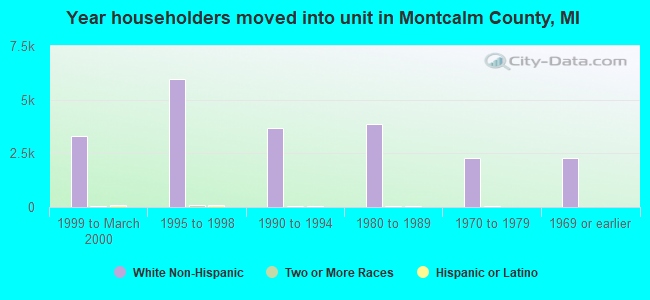
- Year house built in Montcalm County, Michigan
- 6712020 or later
- 1,4212010 to 2019
- 3,5382000 to 2009
- 4,4381990 to 1999
- 2,6041980 to 1989
- 3,3851970 to 1979
- 3,2501960 to 1969
- 3,2161950 to 1959
- 1,4481940 to 1949
- 4,1521939 or earlier
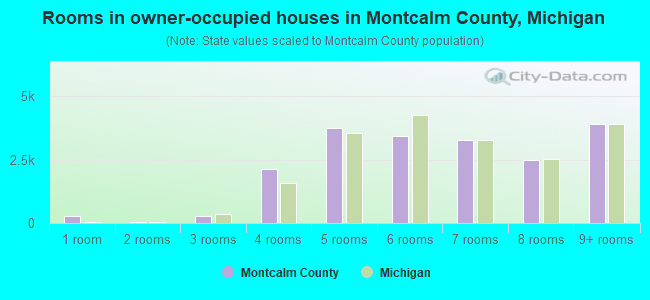
- Rooms in owner-occupied houses in Montcalm County, Michigan
- 01 room
- 1082 rooms
- 5603 rooms
- 1,8394 rooms
- 3,7015 rooms
- 5,1366 rooms
- 3,4067 rooms
- 2,7828 rooms
- 3,1049+ rooms
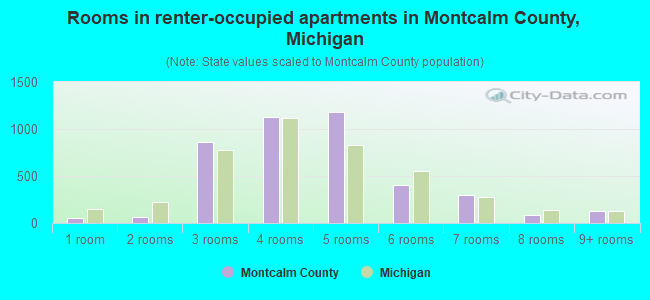
- Rooms in renter-occupied apartments in Montcalm County, Michigan
- 621 room
- 2632 rooms
- 6383 rooms
- 1,0954 rooms
- 1,1135 rooms
- 7726 rooms
- 3007 rooms
- 1808 rooms
- 1599+ rooms
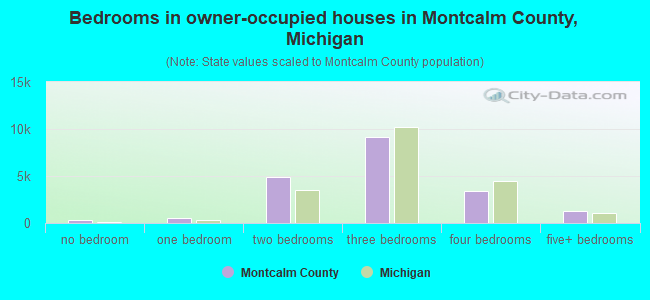
- Bedrooms in owner-occupied houses in Montcalm County, Michigan
- 0no bedroom
- 7551 bedroom
- 4,3712 bedrooms
- 10,9093 bedrooms
- 3,3724 bedrooms
- 1,2295+ bedrooms
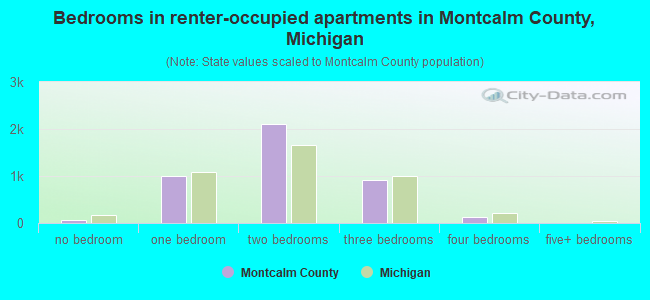
- Bedrooms in renter-occupied apartments in Montcalm County, Michigan
- 83no bedroom
- 1,0491 bedroom
- 2,1052 bedrooms
- 1,1103 bedrooms
- 2354 bedrooms
- 05+ bedrooms
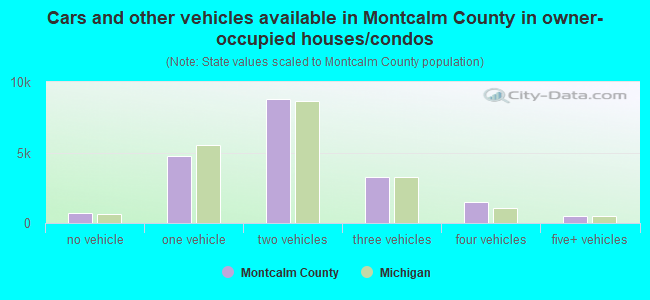
- Cars and other vehicles available in Montcalm County in owner-occupied houses/condos
- 787no vehicle
- 4,1861 vehicle
- 9,5652 vehicles
- 4,1613 vehicles
- 1,2444 vehicles
- 6935+ vehicles
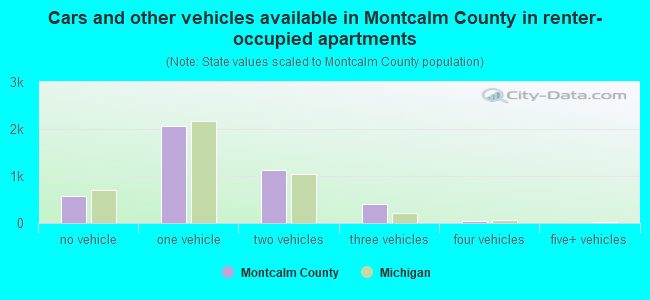
- Cars and other vehicles available in Montcalm County in renter-occupied apartments
- 1,113no vehicle
- 2,1331 vehicle
- 1,0482 vehicles
- 683 vehicles
- 1654 vehicles
- 555+ vehicles
90.4% of Montcalm County residents lived in the same house 1 years ago.
Out of people who lived in different houses, 28% lived in this county.
Out of people who lived in different counties, 84% lived in Michigan.
| Montcalm County: | 90.4% |
| State average: | 88.4% |
Place of birth for U.S.-born residents:
- This state: 57,318
- Other state: 7,606
- Northeast: 621
- Midwest: 4,116
- South: 2,063
- West: 806
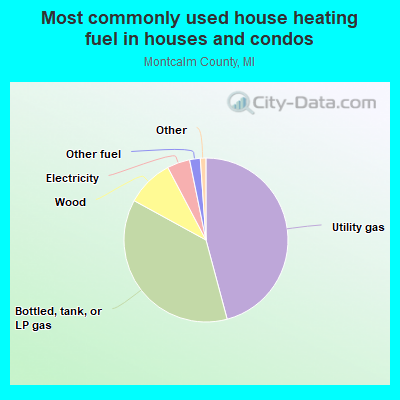
- 49.5%Utility gas
- 33.4%Bottled, tank, or LP gas
- 8.9%Wood
- 3.7%Electricity
- 2.3%Other fuel
- 2.2%Fuel oil, kerosene, etc.
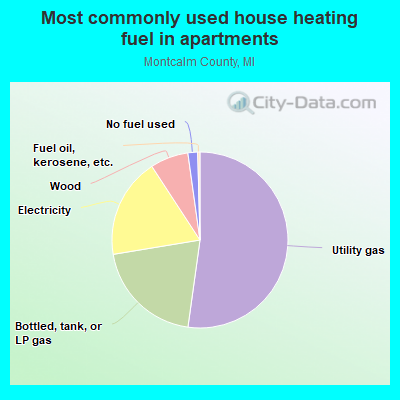
- 59.5%Utility gas
- 20.8%Bottled, tank, or LP gas
- 12.6%Electricity
- 3.6%Wood
- 2.9%No fuel used
- 0.6%Other fuel
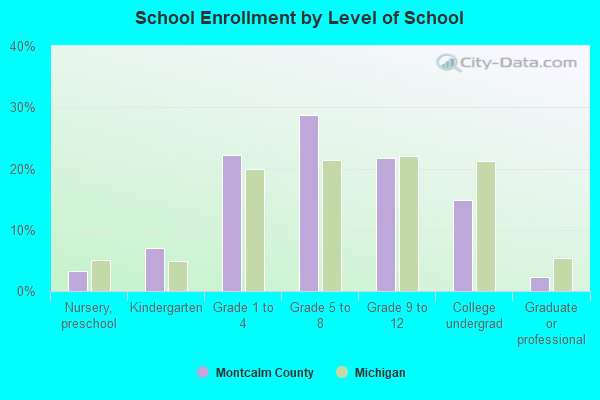
Private vs. public school enrollment:
| Here: | 25.0% |
| Michigan: | 12.4% |
| Here: | 1.7% |
| Michigan: | 9.8% |
| Here: | 8.9% |
| Michigan: | 14.9% |
Montcalm County government finances - Expenditure in 2018:
- Charges - Other: $11,934,000
Regular Highways: $1,328,000
Solid Waste Management: $201,000
Housing and Community Development: $122,000
Parks and Recreation: $14,000
- Construction - Housing and Community Development: $8,000
- Current Operations - Regular Highways: $10,524,000
General - Other: $8,882,000
Health - Other: $8,813,000
Judicial and Legal Services: $3,688,000
Correctional Institutions: $2,561,000
Public Welfare - Other: $2,394,000
Police Protection: $2,118,000
Housing and Community Development: $2,115,000
Central Staff Services: $1,515,000
Libraries: $863,000
General Public Buildings: $758,000
Financial Administration: $663,000
Protective Inspection and Regulation - Other: $360,000
Natural Resources - Other: $220,000
Solid Waste Management: $170,000
Parks and Recreation: $11,000
- Federal Intergovernmental - Housing and Community Development: $943,000
Health and Hospitals: $846,000
Other: $99,000
- General - Interest on Debt: $177,000
- Intergovernmental to Local - Other - Housing and Community Development: $11,000
- Local Intergovernmental - Highways: $12,315,000
Other: $1,638,000
Housing and Community Development: $931,000
- Long Term Debt - Outstanding Unspecified Public Purpose: $8,661,000
Beginning Outstanding - Unspecified Public Purpose: $7,435,000
Issue, Unspecified Public Purpose: $6,130,000
Retired Unspecified Public Purpose: $4,904,000
- Miscellaneous - Rents: $901,000
General Revenue - Other: $313,000
Interest Earnings: $106,000
Fines and Forfeits: $96,000
Sale of Property: $92,000
- Other Capital Outlay - General - Other: $101,000
- Other Funds - Cash and Securities: $19,350,000
- State Intergovernmental - Other: $1,597,000
General Local Government Support: $1,255,000
Public Welfare: $242,000
- Tax - Property: $11,545,000
Other License: $156,000
- Total Salaries and Wages: $8,832,000
Montcalm County government finances - Revenue in 2018:
- Charges - Other: $11,934,000
Regular Highways: $1,328,000
Solid Waste Management: $201,000
Housing and Community Development: $122,000
Parks and Recreation: $14,000
- Construction - Housing and Community Development: $8,000
- Current Operations - Regular Highways: $10,524,000
General - Other: $8,882,000
Health - Other: $8,813,000
Judicial and Legal Services: $3,688,000
Correctional Institutions: $2,561,000
Public Welfare - Other: $2,394,000
Police Protection: $2,118,000
Housing and Community Development: $2,115,000
Central Staff Services: $1,515,000
Libraries: $863,000
General Public Buildings: $758,000
Financial Administration: $663,000
Protective Inspection and Regulation - Other: $360,000
Natural Resources - Other: $220,000
Solid Waste Management: $170,000
Parks and Recreation: $11,000
- Federal Intergovernmental - Housing and Community Development: $943,000
Health and Hospitals: $846,000
Other: $99,000
- General - Interest on Debt: $177,000
- Intergovernmental to Local - Other - Housing and Community Development: $11,000
- Local Intergovernmental - Highways: $12,315,000
Other: $1,638,000
Housing and Community Development: $931,000
- Long Term Debt - Outstanding Unspecified Public Purpose: $8,661,000
Beginning Outstanding - Unspecified Public Purpose: $7,435,000
Issue, Unspecified Public Purpose: $6,130,000
Retired Unspecified Public Purpose: $4,904,000
- Miscellaneous - Rents: $901,000
General Revenue - Other: $313,000
Interest Earnings: $106,000
Fines and Forfeits: $96,000
Sale of Property: $92,000
- Other Capital Outlay - General - Other: $101,000
- Other Funds - Cash and Securities: $19,350,000
- State Intergovernmental - Other: $1,597,000
General Local Government Support: $1,255,000
Public Welfare: $242,000
- Tax - Property: $11,545,000
Other License: $156,000
- Total Salaries and Wages: $8,832,000
Montcalm County government finances - Debt in 2018:
- Charges - Other: $11,934,000
Regular Highways: $1,328,000
Solid Waste Management: $201,000
Housing and Community Development: $122,000
Parks and Recreation: $14,000
- Construction - Housing and Community Development: $8,000
- Current Operations - Regular Highways: $10,524,000
General - Other: $8,882,000
Health - Other: $8,813,000
Judicial and Legal Services: $3,688,000
Correctional Institutions: $2,561,000
Public Welfare - Other: $2,394,000
Police Protection: $2,118,000
Housing and Community Development: $2,115,000
Central Staff Services: $1,515,000
Libraries: $863,000
General Public Buildings: $758,000
Financial Administration: $663,000
Protective Inspection and Regulation - Other: $360,000
Natural Resources - Other: $220,000
Solid Waste Management: $170,000
Parks and Recreation: $11,000
- Federal Intergovernmental - Housing and Community Development: $943,000
Health and Hospitals: $846,000
Other: $99,000
- General - Interest on Debt: $177,000
- Intergovernmental to Local - Other - Housing and Community Development: $11,000
- Local Intergovernmental - Highways: $12,315,000
Other: $1,638,000
Housing and Community Development: $931,000
- Long Term Debt - Outstanding Unspecified Public Purpose: $8,661,000
Beginning Outstanding - Unspecified Public Purpose: $7,435,000
Issue, Unspecified Public Purpose: $6,130,000
Retired Unspecified Public Purpose: $4,904,000
- Miscellaneous - Rents: $901,000
General Revenue - Other: $313,000
Interest Earnings: $106,000
Fines and Forfeits: $96,000
Sale of Property: $92,000
- Other Capital Outlay - General - Other: $101,000
- Other Funds - Cash and Securities: $19,350,000
- State Intergovernmental - Other: $1,597,000
General Local Government Support: $1,255,000
Public Welfare: $242,000
- Tax - Property: $11,545,000
Other License: $156,000
- Total Salaries and Wages: $8,832,000
Montcalm County government finances - Cash and Securities in 2018:
- Charges - Other: $11,934,000
Regular Highways: $1,328,000
Solid Waste Management: $201,000
Housing and Community Development: $122,000
Parks and Recreation: $14,000
- Construction - Housing and Community Development: $8,000
- Current Operations - Regular Highways: $10,524,000
General - Other: $8,882,000
Health - Other: $8,813,000
Judicial and Legal Services: $3,688,000
Correctional Institutions: $2,561,000
Public Welfare - Other: $2,394,000
Police Protection: $2,118,000
Housing and Community Development: $2,115,000
Central Staff Services: $1,515,000
Libraries: $863,000
General Public Buildings: $758,000
Financial Administration: $663,000
Protective Inspection and Regulation - Other: $360,000
Natural Resources - Other: $220,000
Solid Waste Management: $170,000
Parks and Recreation: $11,000
- Federal Intergovernmental - Housing and Community Development: $943,000
Health and Hospitals: $846,000
Other: $99,000
- General - Interest on Debt: $177,000
- Intergovernmental to Local - Other - Housing and Community Development: $11,000
- Local Intergovernmental - Highways: $12,315,000
Other: $1,638,000
Housing and Community Development: $931,000
- Long Term Debt - Outstanding Unspecified Public Purpose: $8,661,000
Beginning Outstanding - Unspecified Public Purpose: $7,435,000
Issue, Unspecified Public Purpose: $6,130,000
Retired Unspecified Public Purpose: $4,904,000
- Miscellaneous - Rents: $901,000
General Revenue - Other: $313,000
Interest Earnings: $106,000
Fines and Forfeits: $96,000
Sale of Property: $92,000
- Other Capital Outlay - General - Other: $101,000
- Other Funds - Cash and Securities: $19,350,000
- State Intergovernmental - Other: $1,597,000
General Local Government Support: $1,255,000
Public Welfare: $242,000
- Tax - Property: $11,545,000
Other License: $156,000
- Total Salaries and Wages: $8,832,000
Supplemental Security Income (SSI) in 2006:
- Total number of recipients: 1,463
- Number of aged recipients: 65
- Number of blind and disabled recipients: 1,398
- Number of recipients under 18: 265
- Number of recipients between 18 and 64: 1,030
- Number of recipients older than 64: 168
- Number of recipients also receiving OASDI: 525
- Amount of payments (thousands of dollars): 698
| Most common first names in Montcalm County, MI among deceased individuals | ||
| Name | Count | Lived (average) |
|---|---|---|
| John | 233 | 74.0 years |
| William | 226 | 75.3 years |
| Robert | 201 | 72.0 years |
| Mary | 179 | 79.6 years |
| Charles | 155 | 76.8 years |
| George | 149 | 76.1 years |
| Donald | 148 | 72.7 years |
| James | 147 | 69.4 years |
| Helen | 113 | 78.9 years |
| Richard | 107 | 68.8 years |
| Most common last names in Montcalm County, MI among deceased individuals | ||
| Last name | Count | Lived (average) |
|---|---|---|
| Smith | 157 | 76.5 years |
| Hansen | 143 | 78.9 years |
| Johnson | 127 | 78.4 years |
| Jensen | 94 | 78.2 years |
| Miller | 83 | 73.6 years |
| Petersen | 81 | 78.8 years |
| Christensen | 73 | 79.1 years |
| Nelson | 64 | 78.6 years |
| Wilson | 57 | 76.1 years |
| Anderson | 56 | 79.1 years |
| Businesses in Montcalm County, MI | ||||
| Name | Count | Name | Count | |
|---|---|---|---|---|
| AT&T | 1 | Kmart | 1 | |
| Ace Hardware | 1 | La-Z-Boy | 1 | |
| Advance Auto Parts | 1 | Lane Furniture | 3 | |
| AmericInn | 1 | Little Caesars Pizza | 1 | |
| Applebee's | 1 | MasterBrand Cabinets | 5 | |
| Arby's | 1 | Maurices | 1 | |
| AutoZone | 1 | McDonald's | 6 | |
| Blockbuster | 1 | Meijer | 1 | |
| Burger King | 2 | Penske | 1 | |
| Chevrolet | 2 | Pizza Hut | 1 | |
| Curves | 1 | RadioShack | 2 | |
| Dairy Queen | 1 | Rite Aid | 2 | |
| Fashion Bug | 1 | Sears | 1 | |
| FedEx | 2 | Sprint Nextel | 2 | |
| Ford | 1 | Subway | 6 | |
| GameStop | 1 | Taco Bell | 1 | |
| Goodwill | 2 | True Value | 5 | |
| H&R Block | 2 | U-Haul | 2 | |
| JCPenney | 1 | UPS | 7 | |
| Jimmy John's | 1 | Walgreens | 1 | |
| Jones New York | 3 | Walmart | 1 | |
| KFC | 1 | Wendy's | 1 | |
Montcalm County on our top lists:
- #78 on the list of "Top 101 counties with the lowest total withdrawal of fresh water for public supply (pop. 50,000+)"