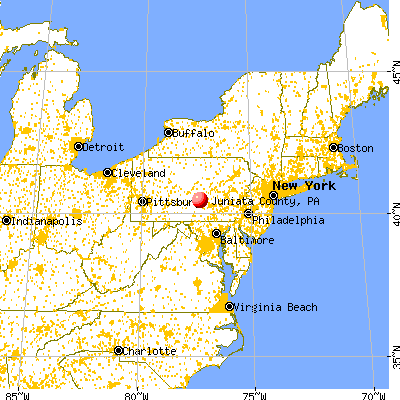
Juniata County, Pennsylvania (PA)
County owner-occupied free and clear houses and condos in 2010: 3,137
County owner-occupied houses and condos in 2000: 6,671
Renter-occupied apartments: 2,263 (it was 1,913 in 2000)
| % of renters here: | 22% |
| State: | 30% |
Land area: 392 sq. mi.
Water area: 2.0 sq. mi.
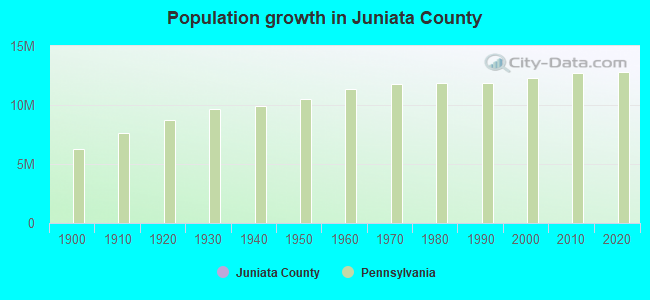
Population density: 60 people per square mile (average).
Industries providing employment: Manufacturing (17.8%), Educational, health and social services (16.6%), Retail trade (13.7%), Construction (11.5%).
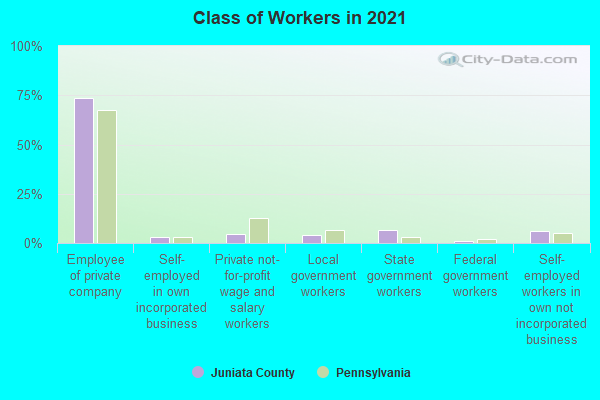
Type of workers:
- Private wage or salary: 80%
- Government: 13%
- Self-employed, not incorporated: 7%
- Unpaid family work: 0%
- OSM Map
- General Map
- Google Map
- MSN Map


- 21,43192.1%White Non-Hispanic Alone
- 1,0414.5%Hispanic or Latino
- 3521.5%Two or more races
- 2701.2%Black Non-Hispanic Alone
- 1030.4%Asian alone
- 640.3%Some other race alone

| Median resident age: | 42.8 years |
| Pennsylvania median age: | 40.9 years |
| Males: 11,784 | |
| Females: 11,719 |

 | COVID-19 is coming to our area (317 replies) |
| Pennsyltucky? (155 replies) |
| Single-use plastic bag ban in City (18 replies) |
| PA City/Borough Population Estimates (2017) (28 replies) |
| PA City and County Poverty Levels (37 replies) |
| Suburb of the week: West Mifflin (0 replies) |
| Juniata County: | 2.0 people |
| Pennsylvania: | 2 people |
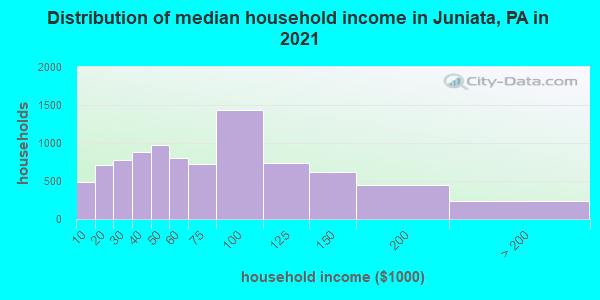
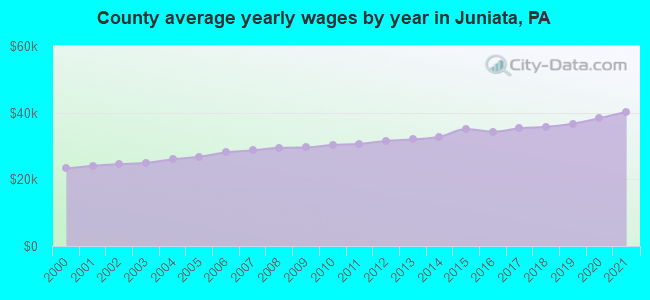
Estimated median household income in 2022: $60,754 ($34,698 in 1999)
| This county: | $60,754 |
| Pennsylvania: | $71,798 |
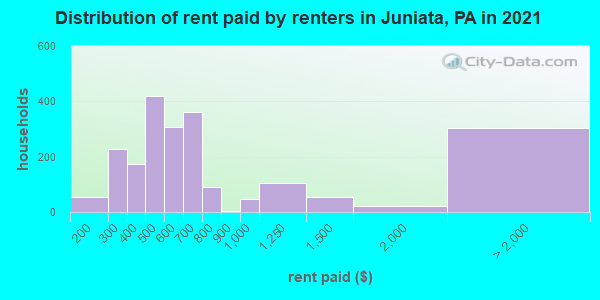
Median contract rent in 2022 for apartments: $543 (lower quartile is $412, upper quartile is $715)
| This county: | $543 |
| State: | $922 |
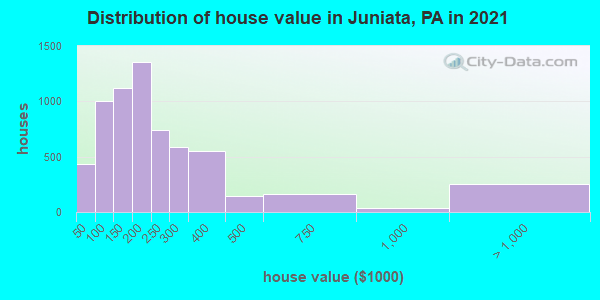
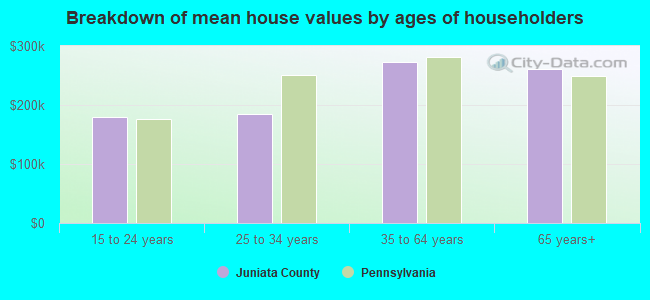
Estimated median house or condo value in 2022: $201,761 (it was $86,900 in 2000)
| Juniata: | $201,761 |
| Pennsylvania: | $245,500 |
Median monthly housing costs for homes and condos with a mortgage: $1,233
Median monthly housing costs for units without a mortgage: $478
Institutionalized population: 258
Crime in 2020 (reported by the sheriff's office or county police, not the county total):
- Murders: 0
- Rapes: 0
- Robberies: 0
- Assaults: 0
- Burglaries: 0
- Thefts: 0
- Auto thefts: 0
Crime in 2019 (reported by the sheriff's office or county police, not the county total):
- Murders: 0
- Rapes: 0
- Robberies: 0
- Assaults: 0
- Burglaries: 0
- Thefts: 0
- Auto thefts: 0
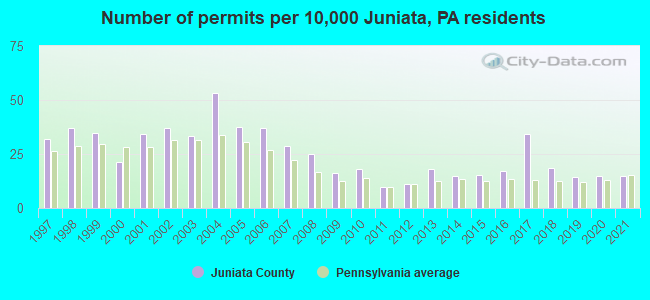
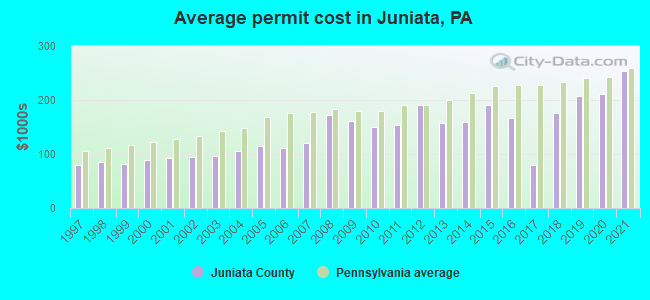
Single-family new house construction building permits:
- 2022: 53 buildings, average cost: $264,700
- 2021: 34 buildings, average cost: $254,300
- 2020: 34 buildings, average cost: $210,900
- 2019: 33 buildings, average cost: $207,200
- 2018: 42 buildings, average cost: $175,700
- 2017: 78 buildings, average cost: $79,500
- 2016: 39 buildings, average cost: $166,600
- 2015: 35 buildings, average cost: $190,300
- 2014: 34 buildings, average cost: $160,200
- 2013: 41 buildings, average cost: $157,700
- 2012: 25 buildings, average cost: $189,500
- 2011: 22 buildings, average cost: $153,800
- 2010: 41 buildings, average cost: $149,500
- 2009: 37 buildings, average cost: $162,300
- 2008: 57 buildings, average cost: $171,700
- 2007: 65 buildings, average cost: $120,600
- 2006: 84 buildings, average cost: $111,600
- 2005: 86 buildings, average cost: $114,500
- 2004: 122 buildings, average cost: $105,100
- 2003: 76 buildings, average cost: $96,300
- 2002: 84 buildings, average cost: $93,500
- 2001: 78 buildings, average cost: $92,000
- 2000: 49 buildings, average cost: $88,400
- 1999: 79 buildings, average cost: $81,500
- 1998: 85 buildings, average cost: $84,500
- 1997: 73 buildings, average cost: $79,200
Median real estate property taxes paid for housing units with mortgages in 2022: $2,041 (1.0%)
Median real estate property taxes paid for housing units with no mortgage in 2022: $1,922 (1.0%)
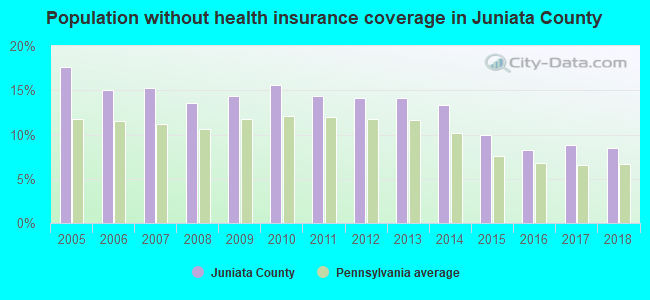
| Juniata County: | 9.0% |
| Pennsylvania: | 11.8% |
Median age of residents in 2022: 42.8 years old
(Males: 42.5 years old, Females: 43.3 years old)
(Median age for: White residents: 44.6 years old, Black residents: 23.1 years old, Asian residents: 35.2 years old, Hispanic or Latino residents: 25.3 years old, Other race residents: 24.3 years old)
Fair market rent in 2006 for a 1-bedroom apartment in Juniata County is $410 a month.
Fair market rent for a 2-bedroom apartment is $493 a month.
Fair market rent for a 3-bedroom apartment is $670 a month.
Cities in this county include: Port Royal, Mifflintown, McAlisterville, Thompsontown, Mifflin, Richfield, Mexico, East Salem, East Rutherford.
Neighboring counties: Adams County, Indiana  , Mifflin County , Monroe County
  , Nodaway County, Missouri .
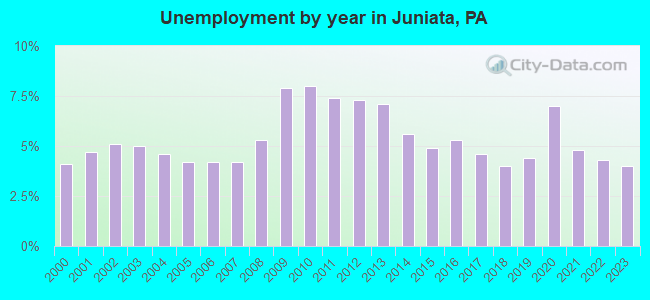
| Here: | 3.3% |
| Pennsylvania: | 2.9% |
Current college students: 433
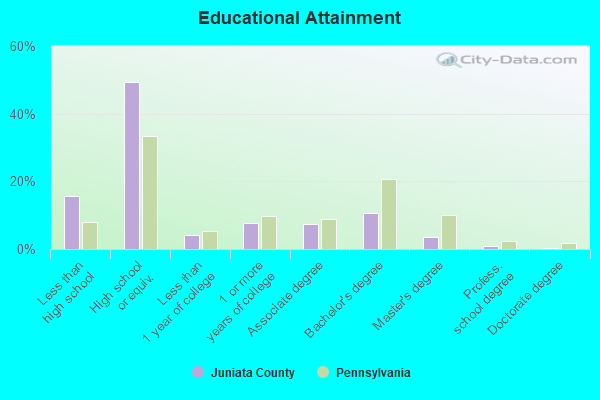
People 25 years of age or older with a high school degree or higher: 83.0%
People 25 years of age or older with a bachelor's degree or higher: 14.3%
Number of foreign born residents: 611 (26.8% naturalized citizens)
| Juniata County: | 2.6% |
| Whole state: | 7.5% |
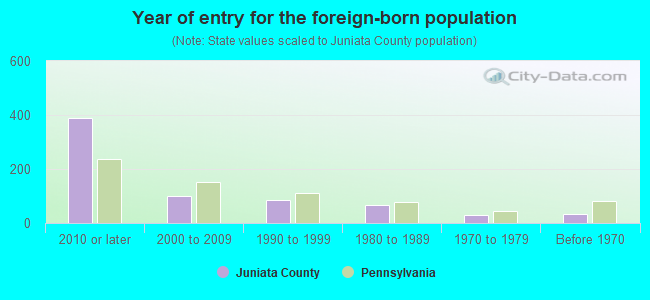
- Year of entry for the foreign-born population
- 3342010 or later
- 1462000 to 2009
- 831990 to 1999
- 671980 to 1989
- 301970 to 1979
- 35Before 1970
Mean travel time to work (commute): minutes
Percentage of county residents living and working in this county: 99.9%
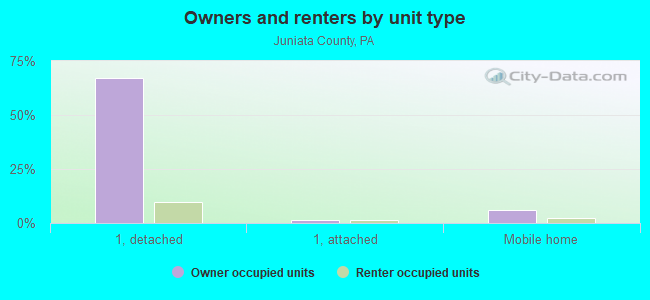
Housing units in structures:
- One, detached: 8,057
- One, attached: 262
- Two: 192
- 3 or 4: 219
- 5 to 9: 253
- 10 to 19: 309
- 20 to 49: 173
- 50 or more: 70
- Mobile homes: 1,039
- Boats, RVs, vans, etc.: 2
Housing units in Juniata County with a mortgage: 3,317 (426 second mortgage, 11 home equity loan, 394 both second mortgage and home equity loan)
Houses without a mortgage: 345
| Here: | 0.9% with mortgage |
| State: | 93.8% with mortgage |
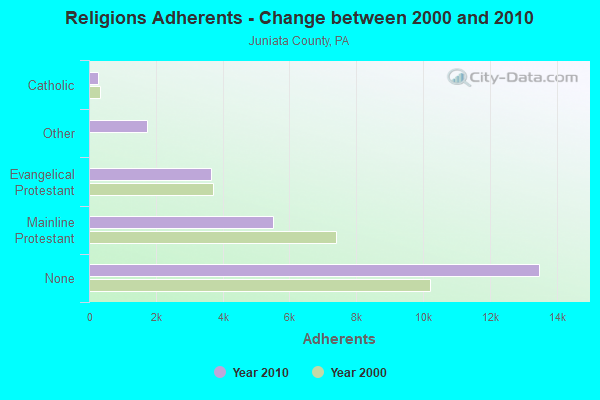
Religion statistics for Juniata County
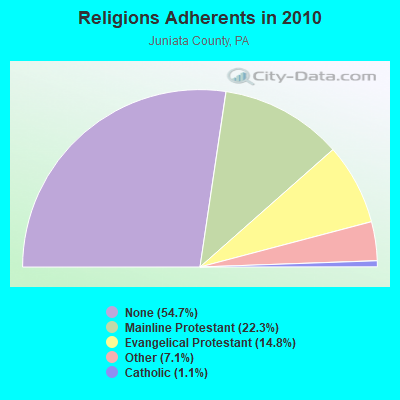
| Religion | Adherents | Congregations |
|---|---|---|
| Mainline Protestant | 5,497 | 33 |
| Evangelical Protestant | 3,645 | 31 |
| Other | 1,747 | 3 |
| Catholic | 264 | 1 |
| None | 13,483 | - |
Source: Clifford Grammich, Kirk Hadaway, Richard Houseal, Dale E.Jones, Alexei Krindatch, Richie Stanley and Richard H.Taylor. 2012. 2010 U.S.Religion Census: Religious Congregations & Membership Study. Association of Statisticians of American Religious Bodies. Jones, Dale E., et al. 2002. Congregations and Membership in the United States 2000. Nashville, TN: Glenmary Research Center.
Food Environment Statistics:
| Juniata County: | 2.17 / 10,000 pop. |
| State: | 2.04 / 10,000 pop. |
| This county: | 1.30 / 10,000 pop. |
| Pennsylvania: | 0.88 / 10,000 pop. |
| Juniata County: | 4.76 / 10,000 pop. |
| Pennsylvania: | 2.52 / 10,000 pop. |
| This county: | 6.50 / 10,000 pop. |
| State: | 7.12 / 10,000 pop. |
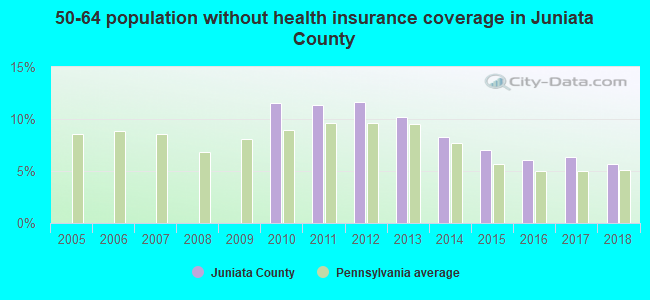
| Juniata County: | 9.4% |
| Pennsylvania: | 9.1% |
| Juniata County: | 29.4% |
| State: | 27.2% |
| Here: | 13.6% |
| State: | 11.5% |
Agriculture in Juniata County:
Average size of farms: 134 acresAverage value of agricultural products sold per farm: $104,999
Average value of crops sold per acre for harvested cropland: $103.48
The value of nursery, greenhouse, floriculture, and sod as a percentage of the total market value of agricultural products sold: 1.70%
The value of livestock, poultry, and their products as a percentage of the total market value of agricultural products sold: 93.17%
Average total farm production expenses per farm: $83,839
Harvested cropland as a percentage of land in farms: 51.78%
Irrigated harvested cropland as a percentage of land in farms: 0.63%
Average market value of all machinery and equipment per farm: $62,032
The percentage of farms operated by a family or individual: 95.19%
Average age of principal farm operators: 51 years
Average number of cattle and calves per 100 acres of all land in farms: 22.66
Milk cows as a percentage of all cattle and calves: 40.36%
Corn for grain: 7996 harvested acres
All wheat for grain: 2202 harvested acres
Soybeans for beans: 4897 harvested acres
Vegetables: 46 harvested acres
Land in orchards: 396 acres
Earthquake activity:
Juniata County-area historical earthquake activity is significantly above Pennsylvania state average. It is 62% smaller than the overall U.S. average.On 8/23/2011 at 17:51:04, a magnitude 5.8 (5.8 MW, Depth: 3.7 mi, Class: Moderate, Intensity: VI - VII) earthquake occurred 185.8 miles away from Juniata County center
On 9/25/1998 at 19:52:52, a magnitude 5.2 (4.8 MB, 4.3 MS, 5.2 LG, 4.5 MW, Depth: 3.1 mi) earthquake occurred 171.9 miles away from the county center
On 1/16/1994 at 01:49:16, a magnitude 4.6 (4.6 MB, 4.6 LG, Depth: 3.1 mi, Class: Light, Intensity: IV - V) earthquake occurred 70.5 miles away from the county center
On 1/31/1986 at 16:46:43, a magnitude 5.0 (5.0 MB) earthquake occurred 211.7 miles away from the county center
On 10/7/1983 at 10:18:46, a magnitude 5.3 (5.1 MB, 5.3 LG, 5.1 ML) earthquake occurred 280.7 miles away from Juniata County center
On 1/16/1994 at 00:42:43, a magnitude 4.2 (4.2 MB, 4.0 LG, Depth: 3.1 mi) earthquake occurred 72.1 miles away from the county center
Magnitude types: regional Lg-wave magnitude (LG), body-wave magnitude (MB), local magnitude (ML), surface-wave magnitude (MS), moment magnitude (MW)
Most recent natural disasters:
- Pennsylvania Covid-19 Pandemic, Incident Period: January 20, 2020, Major Disaster (Presidential) Declared DR-4506-PA: March 30, 2020, FEMA Id: 4506, Natural disaster type: Other
- Pennsylvania Severe Winter Storm and Snowstorm, Incident Period: January 22, 2016 to January 23, 2016, Major Disaster (Presidential) Declared DR-4267: March 23, 2016, FEMA Id: 4267, Natural disaster type: Snowstorm, Winter Storm
- Pennsylvania Hurricane Sandy, Incident Period: October 26, 2012 to November 08, 2012, Emergency Declared EM-3356: October 29, 2012, FEMA Id: 3356, Natural disaster type: Hurricane
- Pennsylvania Hurricane Sandy, Incident Period: October 26, 2012 to November 08, 2012, Major Disaster (Presidential) Declared DR-4099: January 10, 2013, FEMA Id: 4099, Natural disaster type: Hurricane
- Pennsylvania Remnants of Tropical Storm Lee, Incident Period: September 03, 2011 to October 15, 2011, Major Disaster (Presidential) Declared EM-3340: September 08, 2011, FEMA Id: 3340, Natural disaster type: Tropical Storm
- Pennsylvania Tropical Storm Lee, Incident Period: September 03, 2011 to October 15, 2011, Major Disaster (Presidential) Declared DR-4030: September 12, 2011, FEMA Id: 4030, Natural disaster type: Tropical Storm
- Pennsylvania Severe Winter Storms and Snowstorms, Incident Period: February 05, 2010 to February 11, 2010, Major Disaster (Presidential) Declared DR-1898: April 16, 2010, FEMA Id: 1898, Natural disaster type: Snowstorm, Winter Storm
- Pennsylvania Hurricane Katrina Evacuation, Incident Period: August 29, 2005 to October 01, 2005, Emergency Declared EM-3235: September 10, 2005, FEMA Id: 3235, Natural disaster type: Hurricane
- Pennsylvania Tropical Depression Ivan, Incident Period: September 17, 2004 to October 01, 2004, Major Disaster (Presidential) Declared DR-1557: September 19, 2004, FEMA Id: 1557, Natural disaster type: Tropical Depression
- Pennsylvania Snowstorm, Incident Period: February 14, 2003 to February 19, 2003, Emergency Declared EM-3180: March 14, 2003, FEMA Id: 3180, Natural disaster type: Snowstorm
- 8 other natural disasters have been reported since 1953.
The number of natural disasters in Juniata County (18) is near the US average (15).
Major Disasters (Presidential) Declared: 14
Emergencies Declared: 4
Causes of natural disasters: Floods: 4, Hurricanes: 4, Snowstorms: 3, Storms: 3, Tropical Storms: 3, Winter Storms: 3, Blizzard: 1, Heavy Rain: 1, Snowfall: 1, Tropical Depression: 1, Other: 1 (Note: some incidents may be assigned to more than one category).
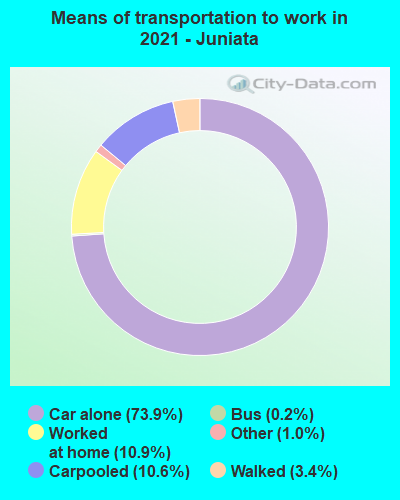
Means of transportation to work:
- Drove a car alone: 5,827 (69.5%)
- Carpooled: 997 (11.9%)
- Bus: 6 (0.1%)
- Taxicab, motorcycle, or other means: 98 (1.2%)
- Bicycle: 16 (0.2%)
- Walked: 210 (2.5%)
- Worked at home: 1,280 (15.3%)
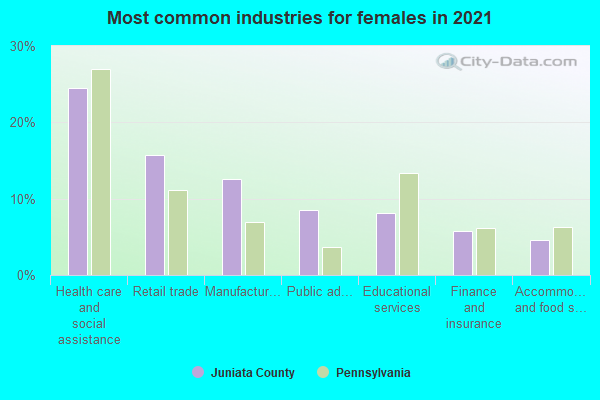
- Health care and social assistance (18%)
- Retail trade (12%)
- Manufacturing (8%)
- Public administration (6%)
- Educational services (6%)
- Finance and insurance (4%)
- Other services, except public administration (4%)
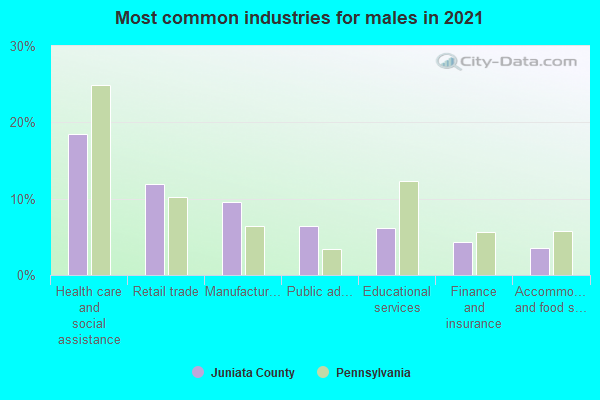
- Health care and social assistance (24%)
- Retail trade (17%)
- Manufacturing (11%)
- Public administration (8%)
- Educational services (8%)
- Finance and insurance (5%)
- Other services, except public administration (5%)
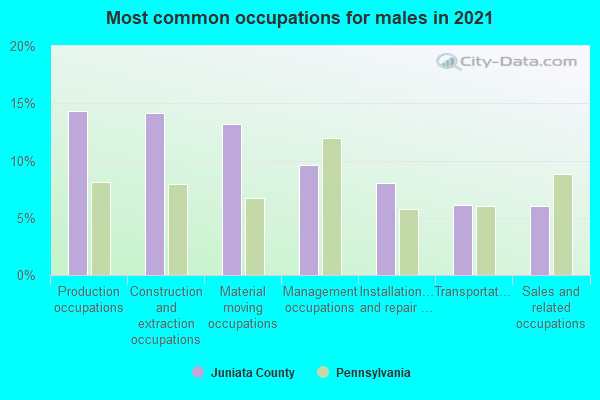
- Construction and extraction occupations (14%)
- Production occupations (14%)
- Material moving occupations (12%)
- Management occupations (11%)
- Installation, maintenance, and repair occupations (8%)
- Transportation occupations (8%)
- Sales and related occupations (7%)
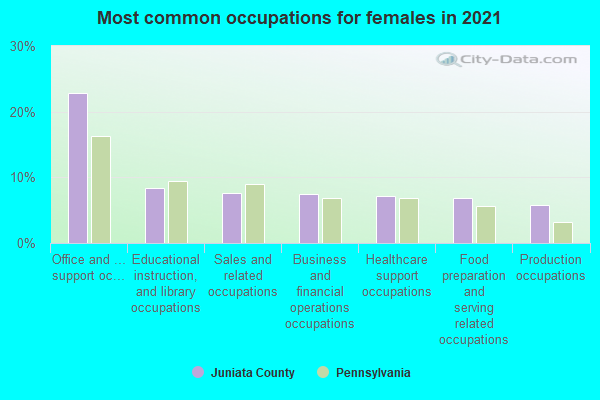
- Office and administrative support occupations (21%)
- Sales and related occupations (9%)
- Educational instruction, and library occupations (9%)
- Business and financial operations occupations (7%)
- Food preparation and serving related occupations (7%)
- Healthcare support occupations (7%)
- Material moving occupations (7%)
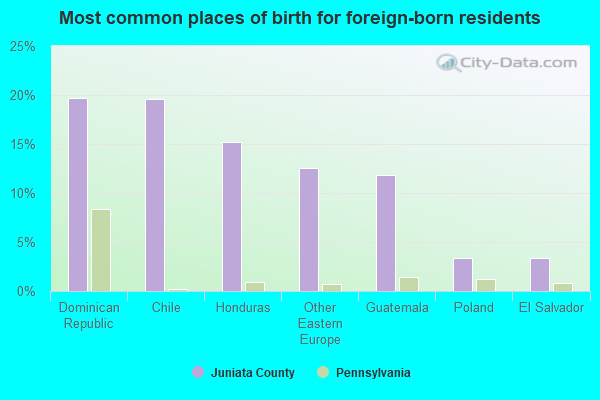
- El Salvador (27%)
- Other Eastern Europe (16%)
- Chile (11%)
- Dominican Republic (9%)
- Honduras (8%)
- Guatemala (8%)
- Algeria (5%)
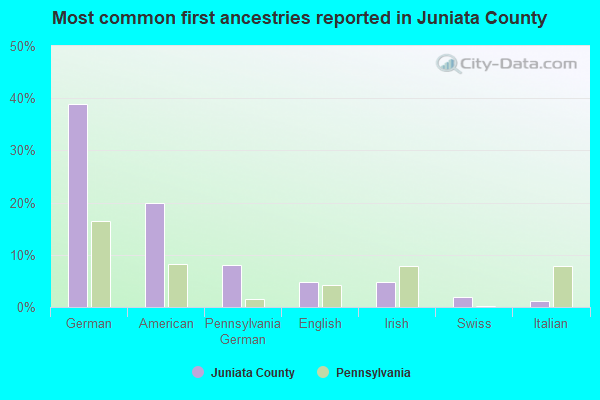
- German (37%)
- American (20%)
- Pennsylvania German (10%)
- Irish (5%)
- English (5%)
- Swiss (1%)
- Italian (1%)
People in group quarters in Juniata County, Pennsylvania in 2010:
- 219 people in nursing facilities/skilled-nursing facilities
- 39 people in local jails and other municipal confinement facilities
- 23 people in group homes intended for adults
- 6 people in other noninstitutional facilities
- 5 people in emergency and transitional shelters (with sleeping facilities) for people experiencing homelessness
People in group quarters in Juniata County, Pennsylvania in 2000:
- 424 people in nursing homes
- 24 people in local jails and other confinement facilities (including police lockups)
- 16 people in other nonhousehold living situations
- 14 people in homes for the mentally retarded
- 9 people in other noninstitutional group quarters
3.62% of this county's 2021 resident taxpayers lived in other counties in 2020 ($47,818 average adjusted gross income)
| Here: | 3.62% |
| Pennsylvania average: | 5.27% |
10 or fewer of this county's residents moved from foreign countries.
3.31% relocated from other counties in Pennsylvania ($42,467 average AGI)
0.31% relocated from other states ($5,352 average AGI)
Juniata County: 0.31% Pennsylvania average: 2.30%
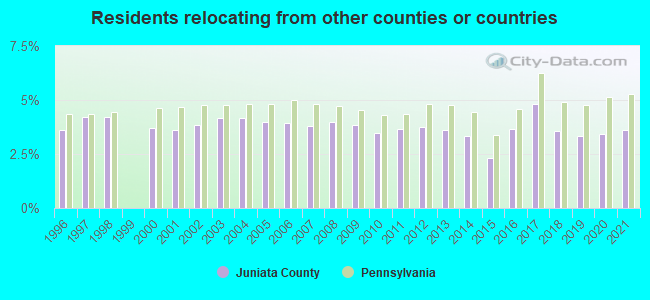
Top counties from which taxpayers relocated into this county between 2020 and 2021:
| from Mifflin County, PA | |
| from Perry County, PA | |
| from Snyder County, PA | |
| from Dauphin County, PA | |
| from Cumberland County, PA |
3.93% of this county's 2020 resident taxpayers moved to other counties in 2021 ($45,405 average adjusted gross income)
| Here: | 3.93% |
| Pennsylvania average: | 5.44% |
10 or fewer of this county's residents moved to foreign countries.
3.40% relocated to other counties in Pennsylvania ($39,918 average AGI)
0.53% relocated to other states ($5,484 average AGI)
Juniata County: 0.53% Pennsylvania average: 2.47%

Top counties to which taxpayers relocated from this county between 2020 and 2021:
| to Mifflin County, PA | |
| to Perry County, PA | |
| to Snyder County, PA | |
| to Cumberland County, PA |
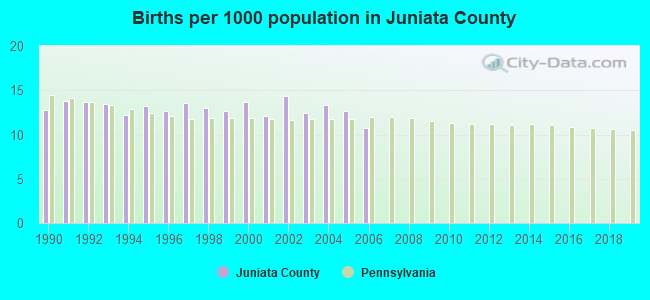
Births per 1000 population from 1990 to 1999: 13.1
Births per 1000 population from 2000 to 2006: 12.7
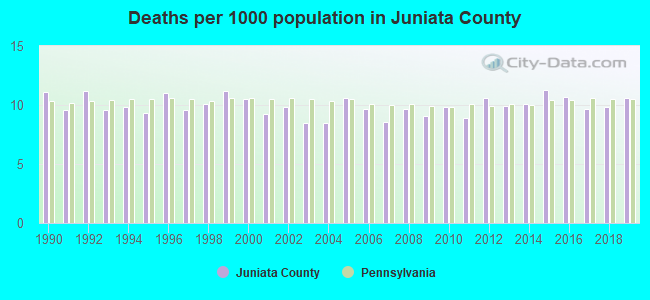
Deaths per 1000 population from 1990 to 1999: 10.2
Deaths per 1000 population from 2000 to 2009: 9.4
Deaths per 1000 population from 2010 to 2020: 10.5
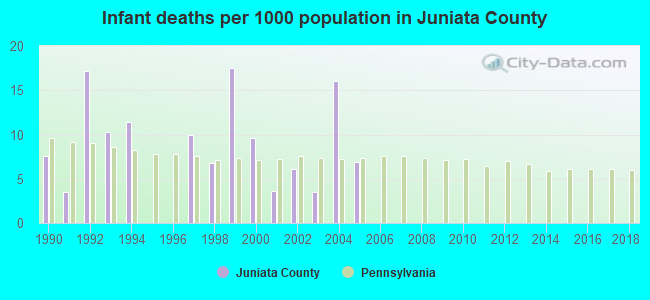
Infant deaths per 1000 live births from 1990 to 1999: 8.4
Infant deaths per 1000 live births from 2000 to 2006: 6.5
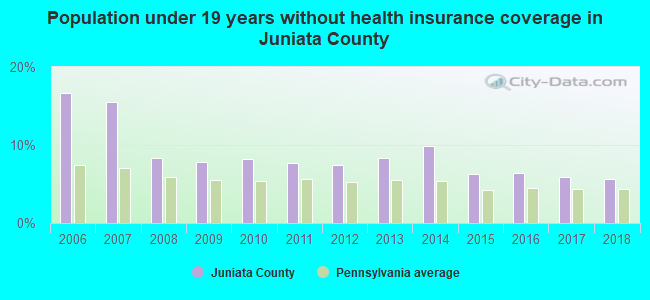
Persons under 19 years old without health insurance coverage in 2018: 5.7%
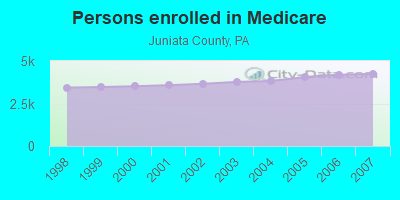
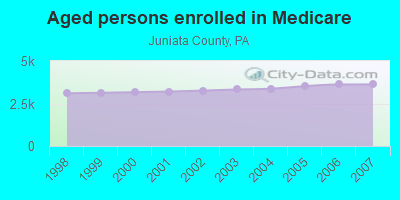
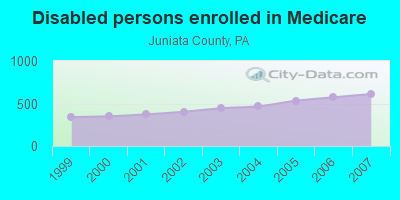
Persons enrolled in hospital insurance and/or supplemental medical insurance (Medicare) in July 1, 2007: 4,236 (3,624 aged, 612 disabled)
Children under 18 without health insurance coverage in 2007: 608 (11%)
Most common underlying causes of death in Juniata County, Pennsylvania in 1999 - 2019:
- Atherosclerotic heart disease (374)
- Acute myocardial infarction, unspecified (335)
- Bronchus or lung, unspecified - Malignant neoplasms (244)
- Chronic obstructive pulmonary disease, unspecified (144)
- Unspecified dementia (127)
- Congestive heart failure (94)
- Stroke, not specified as haemorrhage or infarction (53)
- Colon, unspecified - Malignant neoplasms (11)
- Alzheimer disease, unspecified (10)
- Generalized and unspecified atherosclerosis (10)
Population without health insurance coverage in 2000: 11%
Children under 18 without health insurance coverage in 2000: 8%
Medical specialist MDs per 100,000 population in 2005: 821
Dentists per 100,000 population in 1998: 17
Total births per 100,000 population, July 2005 - July 2006 : 18
Total deaths per 100,000 population, July 2005 - July 2006: 55
Limited-service eating places per 100,000 population in 2005 : 9
Household type by relationship:
Households: 23,503- Male householders: 4,841 (1,130 living alone), Female householders: 4,168 (1,206 living alone)
5,167 spouses (5,127 opposite-sex spouses), 783 unmarried partners, (756 opposite-sex unmarried partners), 6,918 children (6,453 natural, 202 adopted, 260 stepchildren), 326 grandchildren, 106 brothers or sisters, 304 parents, 14 foster children, 151 other relatives, 400 non-relatives
- In group quarters: 287
Size of family households: 3,081 2-persons, 1,194 3-persons, 952 4-persons, 523 5-persons, 143 6-persons, 256 7-or-more-persons.
Size of nonfamily households: 2,337 1-person, 457 2-persons, 64 3-persons, 12 4-persons.
3,829 married couples with children.
976 single-parent households (302 men, 674 women).
88.4% of residents of Juniata speak English at home.
4.1% of residents speak Spanish at home (50% speak English very well, 13% speak English well, 28% speak English not well, 9% don't speak English at all).
7.3% of residents speak other Indo-European language at home (75% speak English very well, 21% speak English well, 4% speak English not well).
0.2% of residents speak Asian or Pacific Island language at home (52% speak English very well, 8% speak English well, 40% speak English not well).
In fiscal year 2004:
Federal Government expenditure: $110,123,000 ($4,708 per capita)
Department of Defense expenditure: $1,897,000
Federal direct payments to individuals for retirement and disability: $56,693,000
Federal other direct payments to individuals: $25,253,000
Federal direct payments not to individuals: $1,870,000
Federal grants: $20,308,000
Federal procurement contracts: $968,000 ($8,000 Department of Defense)
Federal salaries and wages: $5,031,000 ($0,000 Department of Defense)
Federal Government direct loans: $1,110,000
Federal guaranteed/insured loans: $9,431,000
Federal Government insurance: $14,054,000
Population change from April 1, 2000 to July 1, 2005:
Births: 1,536| Here: | 65 per 1000 residents |
| State: | 61 per 1000 residents |
Deaths: 1,092
| Here: | 46 per 1000 residents |
| State: | 54 per 1000 residents |
Net international migration: +33
| Here: | +1 per 1000 residents |
| State: | +8 per 1000 residents |
Net internal migration: +233
| Here: | |
| State: |
Total withdrawal of fresh water for public supply: 0.87 millions of gallons per day (36% from ground, 64% from surface)
| Here: | 6.5 |
| State: | 6.8 |
| Here: | 4.5 |
| State: | 4.3 |
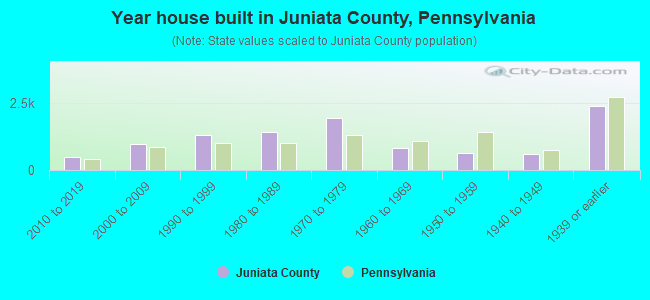
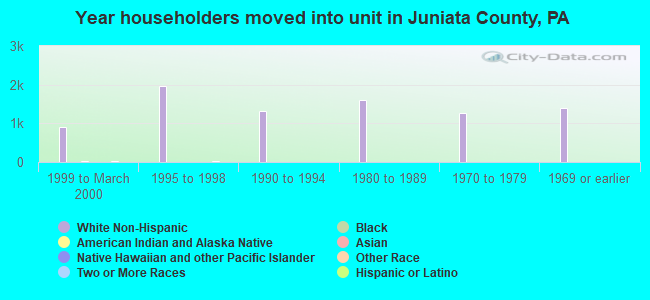
- Year house built in Juniata County, Pennsylvania
- 332020 or later
- 5362010 to 2019
- 1,0412000 to 2009
- 1,3131990 to 1999
- 1,3371980 to 1989
- 1,9101970 to 1979
- 7121960 to 1969
- 5861950 to 1959
- 5721940 to 1949
- 2,4841939 or earlier
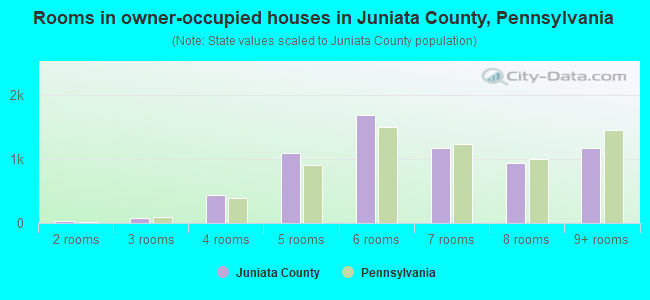
- Rooms in owner-occupied houses in Juniata County, Pennsylvania
- 71 room
- 292 rooms
- 1033 rooms
- 4344 rooms
- 1,0705 rooms
- 1,6946 rooms
- 1,2187 rooms
- 8238 rooms
- 1,1989+ rooms
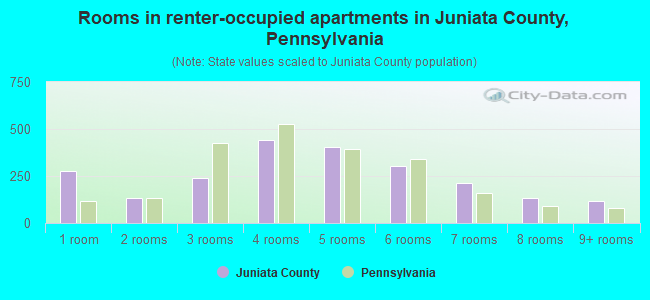
- Rooms in renter-occupied apartments in Juniata County, Pennsylvania
- 3051 room
- 1472 rooms
- 2763 rooms
- 5274 rooms
- 4245 rooms
- 2626 rooms
- 2247 rooms
- 1298 rooms
- 1559+ rooms
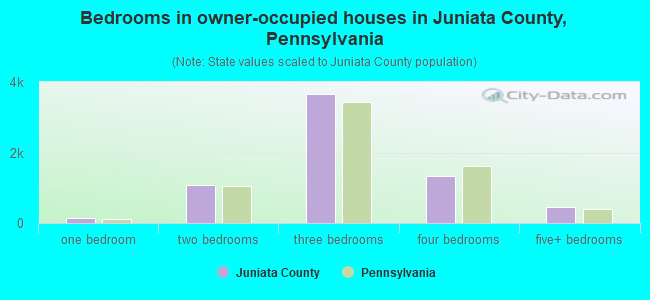
- Bedrooms in owner-occupied houses in Juniata County, Pennsylvania
- 13no bedroom
- 1701 bedroom
- 9702 bedrooms
- 3,6933 bedrooms
- 1,3494 bedrooms
- 3795+ bedrooms
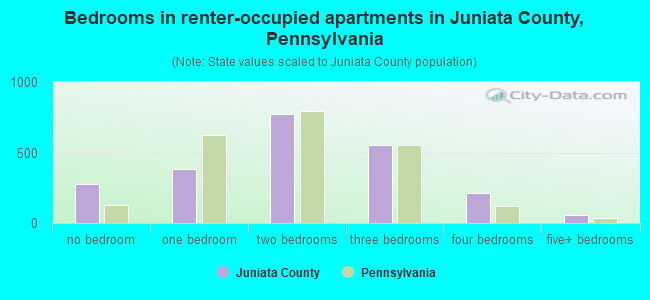
- Bedrooms in renter-occupied apartments in Juniata County, Pennsylvania
- 313no bedroom
- 4101 bedroom
- 9252 bedrooms
- 5413 bedrooms
- 1954 bedrooms
- 645+ bedrooms
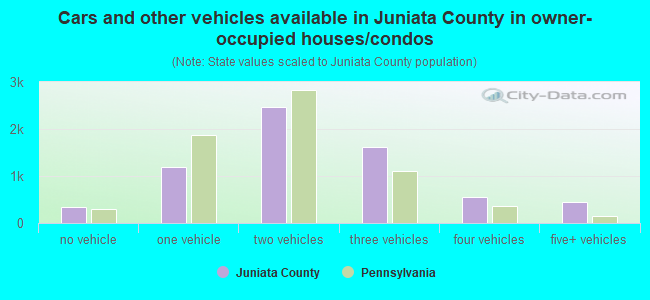
- Cars and other vehicles available in Juniata County in owner-occupied houses/condos
- 357no vehicle
- 1,1301 vehicle
- 2,3812 vehicles
- 1,7133 vehicles
- 4834 vehicles
- 4695+ vehicles
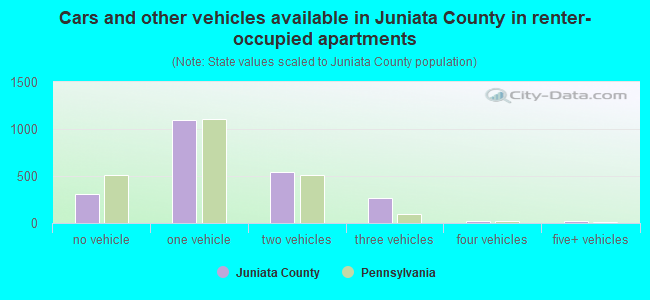
- Cars and other vehicles available in Juniata County in renter-occupied apartments
- 359no vehicle
- 1,1981 vehicle
- 5332 vehicles
- 2983 vehicles
- 394 vehicles
- 145+ vehicles
93.8% of Juniata County residents lived in the same house 1 years ago.
Out of people who lived in different houses, 36% lived in this county.
Out of people who lived in different counties, 88% lived in Pennsylvania.
| Juniata County: | 93.8% |
| State average: | 89.3% |
Place of birth for U.S.-born residents:
- This state: 20,719
- Other state: 1,634
- Northeast: 567
- Midwest: 284
- South: 621
- West: 162
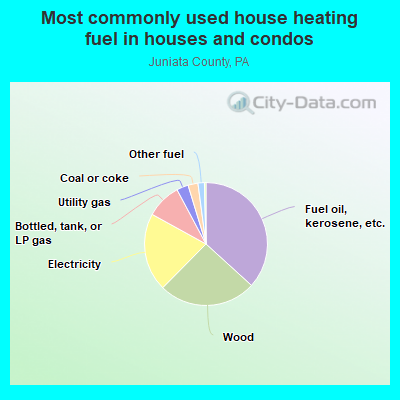
- 38.3%Fuel oil, kerosene, etc.
- 24.4%Wood
- 20.7%Electricity
- 9.1%Bottled, tank, or LP gas
- 2.4%Other fuel
- 2.3%Utility gas
- 2.3%Coal or coke
- 0.3%Solar energy
- 0.3%No fuel used
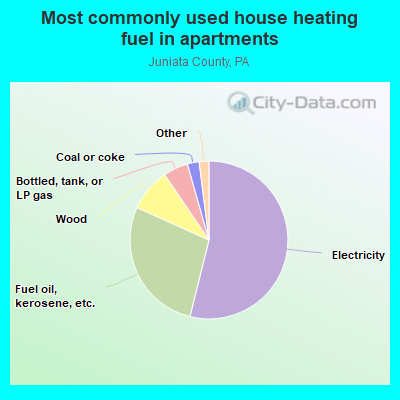
- 54.7%Electricity
- 26.5%Fuel oil, kerosene, etc.
- 9.1%Wood
- 5.1%Bottled, tank, or LP gas
- 2.4%Coal or coke
- 1.0%Utility gas
- 0.8%No fuel used
- 0.4%Other fuel
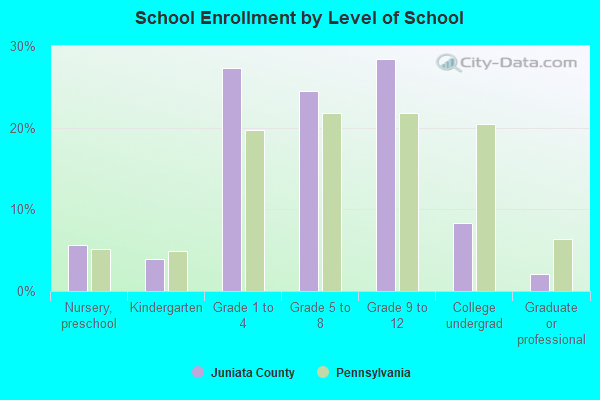
Private vs. public school enrollment:
| Here: | 39.3% |
| Pennsylvania: | 15.7% |
| Here: | 12.5% |
| Pennsylvania: | 13.4% |
| Here: | 30.7% |
| Pennsylvania: | 39.8% |
Juniata County government finances - Expenditure in 2018:
- Charges - Other: $2,076,000
Other: $1,996,000
- Current Operations - Public Welfare - Other: $12,162,000
Public Welfare - Other: $12,097,000
Central Staff Services: $2,818,000
Central Staff Services: $2,803,000
Financial Administration: $2,498,000
Financial Administration: $2,485,000
Correctional Institutions: $2,163,000
Correctional Institutions: $2,152,000
Health - Other: $1,183,000
Judicial and Legal Services: $1,179,000
Health - Other: $1,176,000
Judicial and Legal Services: $1,172,000
General Public Buildings: $1,132,000
General Public Buildings: $1,126,000
Police Protection: $443,000
Police Protection: $441,000
General - Other: $387,000
General - Other: $384,000
Housing and Community Development: $298,000
Housing and Community Development: $296,000
Parks and Recreation: $167,000
Parks and Recreation: $166,000
Libraries: $151,000
Libraries: $150,000
Regular Highways: $140,000
Regular Highways: $139,000
Natural Resources - Other: $86,000
Natural Resources - Other: $85,000
Corrections - Other: $34,000
Corrections - Other: $34,000
- General - Interest on Debt: $7,000
Interest on Debt: $1,000
- Local Intergovernmental - Public Welfare: $1,307,000
Public Welfare: $1,307,000
Other: $1,125,000
Other: $1,125,000
- Long Term Debt - Beginning Outstanding - Unspecified Public Purpose: $99,000
Outstanding Unspecified Public Purpose: $58,000
Retired Unspecified Public Purpose: $41,000
Retired Unspecified Public Purpose: $17,000
Beginning Outstanding - Unspecified Public Purpose: $17,000
- Miscellaneous - General Revenue - Other: $950,000
General Revenue - Other: $680,000
Fines and Forfeits: $297,000
Rents: $263,000
Fines and Forfeits: $213,000
Rents: $188,000
Interest Earnings: $32,000
Interest Earnings: $23,000
- Other Capital Outlay - Judicial and Legal Services: $117,000
Judicial and Legal Services: $85,000
Police Protection: $67,000
Police Protection: $48,000
- Other Funds - Cash and Securities: $5,439,000
Cash and Securities: $5,249,000
- State Intergovernmental - Public Welfare: $12,771,000
Public Welfare: $12,665,000
Other: $1,001,000
Other: $992,000
General Local Government Support: $751,000
General Local Government Support: $745,000
Highways: $112,000
Highways: $111,000
Housing and Community Development: $58,000
Housing and Community Development: $58,000
- Tax - Property: $8,751,000
Property: $8,516,000
Other Selective Sales: $166,000
Other Selective Sales: $162,000
Other: $162,000
Other: $158,000
Other License: $37,000
Other License: $36,000
- Total Salaries and Wages: $5,430,000
: $5,190,000
Juniata County government finances - Revenue in 2018:
- Charges - Other: $2,076,000
Other: $1,996,000
- Current Operations - Public Welfare - Other: $12,162,000
Public Welfare - Other: $12,097,000
Central Staff Services: $2,818,000
Central Staff Services: $2,803,000
Financial Administration: $2,498,000
Financial Administration: $2,485,000
Correctional Institutions: $2,163,000
Correctional Institutions: $2,152,000
Health - Other: $1,183,000
Judicial and Legal Services: $1,179,000
Health - Other: $1,176,000
Judicial and Legal Services: $1,172,000
General Public Buildings: $1,132,000
General Public Buildings: $1,126,000
Police Protection: $443,000
Police Protection: $441,000
General - Other: $387,000
General - Other: $384,000
Housing and Community Development: $298,000
Housing and Community Development: $296,000
Parks and Recreation: $167,000
Parks and Recreation: $166,000
Libraries: $151,000
Libraries: $150,000
Regular Highways: $140,000
Regular Highways: $139,000
Natural Resources - Other: $86,000
Natural Resources - Other: $85,000
Corrections - Other: $34,000
Corrections - Other: $34,000
- General - Interest on Debt: $7,000
Interest on Debt: $1,000
- Local Intergovernmental - Public Welfare: $1,307,000
Public Welfare: $1,307,000
Other: $1,125,000
Other: $1,125,000
- Long Term Debt - Beginning Outstanding - Unspecified Public Purpose: $99,000
Outstanding Unspecified Public Purpose: $58,000
Retired Unspecified Public Purpose: $41,000
Retired Unspecified Public Purpose: $17,000
Beginning Outstanding - Unspecified Public Purpose: $17,000
- Miscellaneous - General Revenue - Other: $950,000
General Revenue - Other: $680,000
Fines and Forfeits: $297,000
Rents: $263,000
Fines and Forfeits: $213,000
Rents: $188,000
Interest Earnings: $32,000
Interest Earnings: $23,000
- Other Capital Outlay - Judicial and Legal Services: $117,000
Judicial and Legal Services: $85,000
Police Protection: $67,000
Police Protection: $48,000
- Other Funds - Cash and Securities: $5,439,000
Cash and Securities: $5,249,000
- State Intergovernmental - Public Welfare: $12,771,000
Public Welfare: $12,665,000
Other: $1,001,000
Other: $992,000
General Local Government Support: $751,000
General Local Government Support: $745,000
Highways: $112,000
Highways: $111,000
Housing and Community Development: $58,000
Housing and Community Development: $58,000
- Tax - Property: $8,751,000
Property: $8,516,000
Other Selective Sales: $166,000
Other Selective Sales: $162,000
Other: $162,000
Other: $158,000
Other License: $37,000
Other License: $36,000
- Total Salaries and Wages: $5,430,000
: $5,190,000
Juniata County government finances - Debt in 2018:
- Charges - Other: $2,076,000
Other: $1,996,000
- Current Operations - Public Welfare - Other: $12,162,000
Public Welfare - Other: $12,097,000
Central Staff Services: $2,818,000
Central Staff Services: $2,803,000
Financial Administration: $2,498,000
Financial Administration: $2,485,000
Correctional Institutions: $2,163,000
Correctional Institutions: $2,152,000
Health - Other: $1,183,000
Judicial and Legal Services: $1,179,000
Health - Other: $1,176,000
Judicial and Legal Services: $1,172,000
General Public Buildings: $1,132,000
General Public Buildings: $1,126,000
Police Protection: $443,000
Police Protection: $441,000
General - Other: $387,000
General - Other: $384,000
Housing and Community Development: $298,000
Housing and Community Development: $296,000
Parks and Recreation: $167,000
Parks and Recreation: $166,000
Libraries: $151,000
Libraries: $150,000
Regular Highways: $140,000
Regular Highways: $139,000
Natural Resources - Other: $86,000
Natural Resources - Other: $85,000
Corrections - Other: $34,000
Corrections - Other: $34,000
- General - Interest on Debt: $7,000
Interest on Debt: $1,000
- Local Intergovernmental - Public Welfare: $1,307,000
Public Welfare: $1,307,000
Other: $1,125,000
Other: $1,125,000
- Long Term Debt - Beginning Outstanding - Unspecified Public Purpose: $99,000
Outstanding Unspecified Public Purpose: $58,000
Retired Unspecified Public Purpose: $41,000
Retired Unspecified Public Purpose: $17,000
Beginning Outstanding - Unspecified Public Purpose: $17,000
- Miscellaneous - General Revenue - Other: $950,000
General Revenue - Other: $680,000
Fines and Forfeits: $297,000
Rents: $263,000
Fines and Forfeits: $213,000
Rents: $188,000
Interest Earnings: $32,000
Interest Earnings: $23,000
- Other Capital Outlay - Judicial and Legal Services: $117,000
Judicial and Legal Services: $85,000
Police Protection: $67,000
Police Protection: $48,000
- Other Funds - Cash and Securities: $5,439,000
Cash and Securities: $5,249,000
- State Intergovernmental - Public Welfare: $12,771,000
Public Welfare: $12,665,000
Other: $1,001,000
Other: $992,000
General Local Government Support: $751,000
General Local Government Support: $745,000
Highways: $112,000
Highways: $111,000
Housing and Community Development: $58,000
Housing and Community Development: $58,000
- Tax - Property: $8,751,000
Property: $8,516,000
Other Selective Sales: $166,000
Other Selective Sales: $162,000
Other: $162,000
Other: $158,000
Other License: $37,000
Other License: $36,000
- Total Salaries and Wages: $5,430,000
: $5,190,000
Juniata County government finances - Cash and Securities in 2018:
- Charges - Other: $2,076,000
Other: $1,996,000
- Current Operations - Public Welfare - Other: $12,162,000
Public Welfare - Other: $12,097,000
Central Staff Services: $2,818,000
Central Staff Services: $2,803,000
Financial Administration: $2,498,000
Financial Administration: $2,485,000
Correctional Institutions: $2,163,000
Correctional Institutions: $2,152,000
Health - Other: $1,183,000
Judicial and Legal Services: $1,179,000
Health - Other: $1,176,000
Judicial and Legal Services: $1,172,000
General Public Buildings: $1,132,000
General Public Buildings: $1,126,000
Police Protection: $443,000
Police Protection: $441,000
General - Other: $387,000
General - Other: $384,000
Housing and Community Development: $298,000
Housing and Community Development: $296,000
Parks and Recreation: $167,000
Parks and Recreation: $166,000
Libraries: $151,000
Libraries: $150,000
Regular Highways: $140,000
Regular Highways: $139,000
Natural Resources - Other: $86,000
Natural Resources - Other: $85,000
Corrections - Other: $34,000
Corrections - Other: $34,000
- General - Interest on Debt: $7,000
Interest on Debt: $1,000
- Local Intergovernmental - Public Welfare: $1,307,000
Public Welfare: $1,307,000
Other: $1,125,000
Other: $1,125,000
- Long Term Debt - Beginning Outstanding - Unspecified Public Purpose: $99,000
Outstanding Unspecified Public Purpose: $58,000
Retired Unspecified Public Purpose: $41,000
Retired Unspecified Public Purpose: $17,000
Beginning Outstanding - Unspecified Public Purpose: $17,000
- Miscellaneous - General Revenue - Other: $950,000
General Revenue - Other: $680,000
Fines and Forfeits: $297,000
Rents: $263,000
Fines and Forfeits: $213,000
Rents: $188,000
Interest Earnings: $32,000
Interest Earnings: $23,000
- Other Capital Outlay - Judicial and Legal Services: $117,000
Judicial and Legal Services: $85,000
Police Protection: $67,000
Police Protection: $48,000
- Other Funds - Cash and Securities: $5,439,000
Cash and Securities: $5,249,000
- State Intergovernmental - Public Welfare: $12,771,000
Public Welfare: $12,665,000
Other: $1,001,000
Other: $992,000
General Local Government Support: $751,000
General Local Government Support: $745,000
Highways: $112,000
Highways: $111,000
Housing and Community Development: $58,000
Housing and Community Development: $58,000
- Tax - Property: $8,751,000
Property: $8,516,000
Other Selective Sales: $166,000
Other Selective Sales: $162,000
Other: $162,000
Other: $158,000
Other License: $37,000
Other License: $36,000
- Total Salaries and Wages: $5,430,000
: $5,190,000
Supplemental Security Income (SSI) in 2006:
- Total number of recipients: 461
- Number of aged recipients: 36
- Number of blind and disabled recipients: 425
- Number of recipients under 18: 93
- Number of recipients between 18 and 64: 281
- Number of recipients older than 64: 87
- Number of recipients also receiving OASDI: 187
- Amount of payments (thousands of dollars): 223
| Most common first names in Juniata County, PA among deceased individuals | ||
| Name | Count | Lived (average) |
|---|---|---|
| Mary | 192 | 81.2 years |
| John | 182 | 75.6 years |
| William | 162 | 75.5 years |
| Charles | 124 | 72.6 years |
| Robert | 121 | 72.0 years |
| James | 97 | 73.2 years |
| Ruth | 91 | 79.4 years |
| Helen | 77 | 80.4 years |
| George | 73 | 76.4 years |
| Paul | 69 | 75.2 years |
| Most common last names in Juniata County, PA among deceased individuals | ||
| Last name | Count | Lived (average) |
|---|---|---|
| Smith | 75 | 78.4 years |
| Swartz | 71 | 75.1 years |
| Lauver | 58 | 75.3 years |
| Graybill | 54 | 77.3 years |
| Benner | 49 | 77.2 years |
| Varner | 47 | 78.5 years |
| Kauffman | 47 | 80.6 years |
| Miller | 37 | 84.2 years |
| Brubaker | 36 | 81.6 years |
| Leister | 32 | 74.3 years |
| Businesses in Juniata County, PA | ||||
| Name | Count | Name | Count | |
|---|---|---|---|---|
| AT&T | 1 | H&R Block | 2 | |
| Burger King | 1 | McDonald's | 1 | |
| Chevrolet | 1 | Subway | 1 | |
| Curves | 1 | True Value | 1 | |
| Econo Lodge | 1 | U-Haul | 1 | |
| FedEx | 1 | UPS | 3 | |
Juniata County on our top lists:
- #24 on the list of "Top 101 counties with the lowest percentage of residents relocating to other counties in 2011"
- #88 on the list of "Top 101 counties with the lowest percentage of residents relocating from other counties between 2010 and 2011"