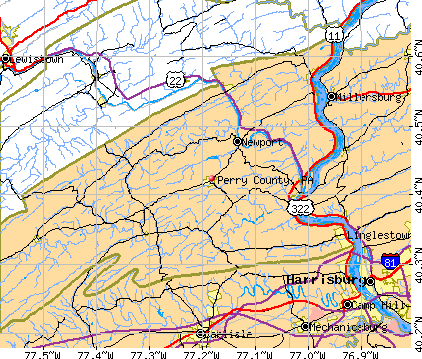
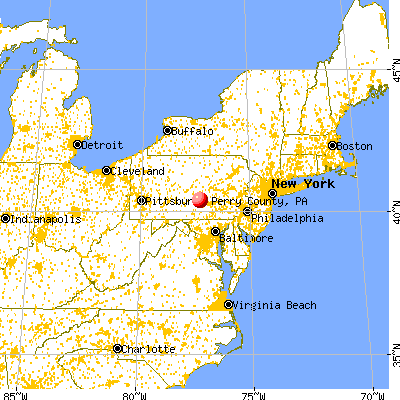
Perry County, Pennsylvania (PA)
County owner-occupied free and clear houses and condos in 2010: 5,087
County owner-occupied houses and condos in 2000: 13,288
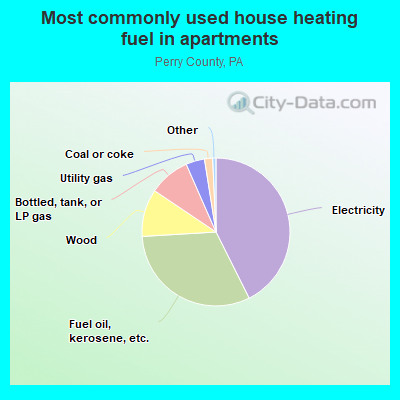
Renter-occupied apartments: 3,693 (it was 3,407 in 2000)
| % of renters here: | 20% |
| State: | 30% |
Land area: 554 sq. mi.
Water area: 2.2 sq. mi.
Population density: 83 people per square mile (average).
Industries providing employment: Educational, health and social services (20.3%), Construction (11.5%), Retail trade (11.2%).
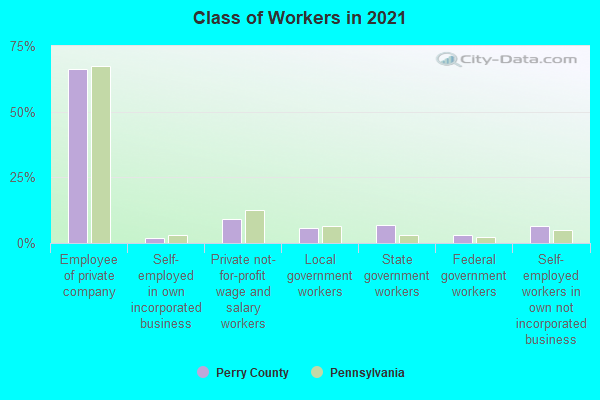
Type of workers:
- Private wage or salary: 79%
- Government: 15%
- Self-employed, not incorporated: 7%
- Unpaid family work: 0%
- OSM Map
- General Map
- Google Map
- MSN Map

- 42,44693.4%White Non-Hispanic Alone
- 1,2822.8%Two or more races
- 1,1472.5%Hispanic or Latino
- 3660.8%Black Non-Hispanic Alone
- 1580.3%Asian alone
- 410.09%American Indian and Alaska Native alone
- 250.05%Some other race alone

| Median resident age: | 43.8 years |
| Pennsylvania median age: | 40.9 years |
| Males: 23,328 | |
| Females: 22,552 |

 | Pros & Cons of East Shore vs. West Shore vs. Upper Dauphin/Perry County (2 replies) |
| Carson Long Academy (3 replies) |
| Relocating to the state, need advice please (6 replies) |
| Moving to Harrisburg, PA: Where to live? (17 replies) |
| Relocate to North of Harrisburg Region (20 replies) |
| easiest commute into Harrisburg? (11 replies) |
| Perry County: | 2.0 people |
| Pennsylvania: | 2 people |
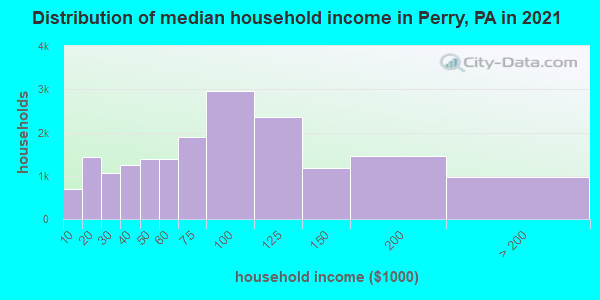
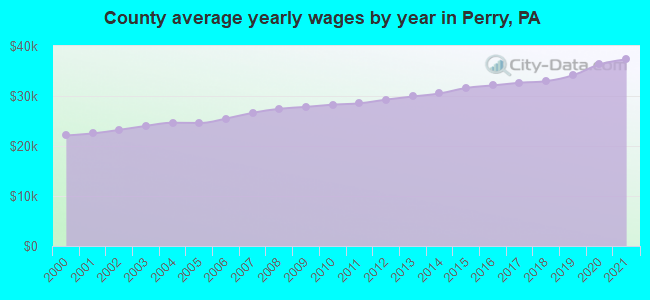
Estimated median household income in 2022: $74,676 ($41,909 in 1999)
| This county: | $74,676 |
| Pennsylvania: | $71,798 |
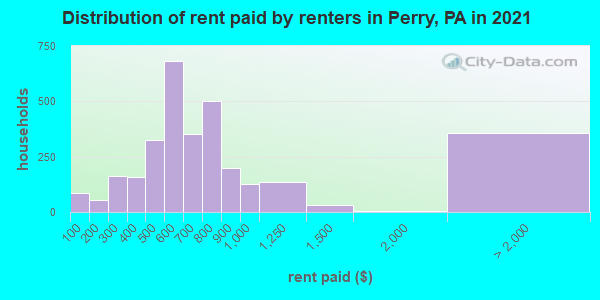
Median contract rent in 2022 for apartments: $619 (lower quartile is $481, upper quartile is $801)
| This county: | $619 |
| State: | $922 |
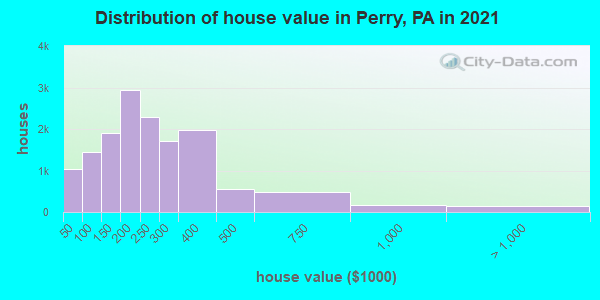
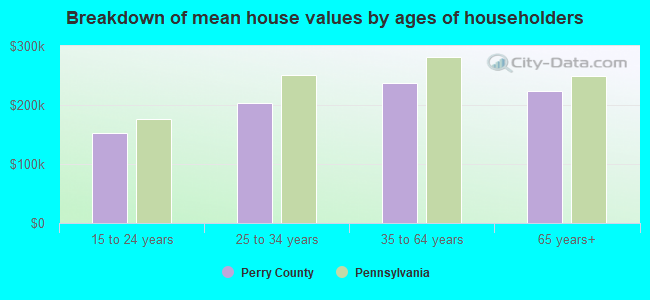
Estimated median house or condo value in 2022: $228,569 (it was $95,000 in 2000)
| Perry: | $228,569 |
| Pennsylvania: | $245,500 |
Mean price in 2022:
Median monthly housing costs for homes and condos with a mortgage: $1,469Detached houses: $266,950
Here: $266,950 State: $317,202 Townhouses or other attached units: $146,538
Here: $146,538 State: $254,369 In 2-unit structures: $128,544
Here: $128,544 State: $249,182 In 3-to-4-unit structures: $272,207
Here: $272,207 State: $297,446 In 5-or-more-unit structures: $411,403
Here: $411,403 State: $320,068 Mobile homes: $77,994
Here: $77,994 State: $92,414
Median monthly housing costs for units without a mortgage: $561
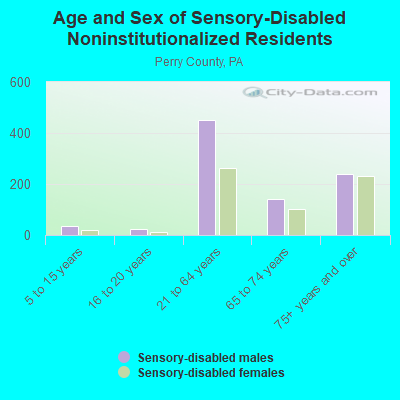
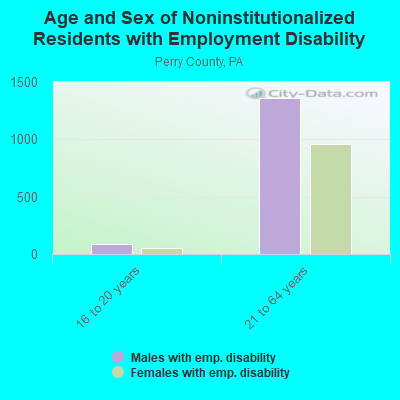
Institutionalized population: 494
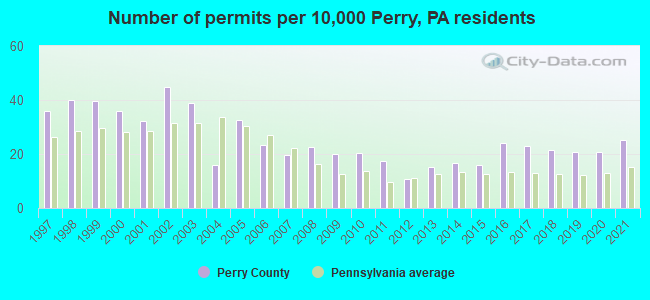
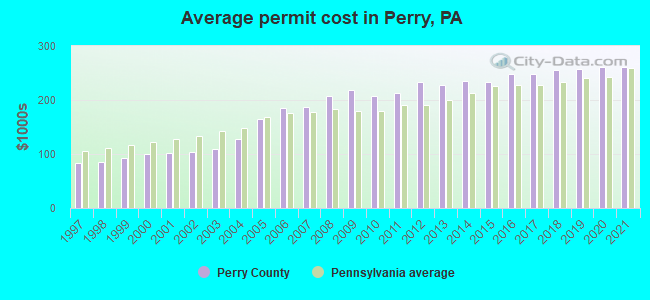
Single-family new house construction building permits:
- 2022: 120 buildings, average cost: $304,700
- 2021: 110 buildings, average cost: $262,300
- 2020: 91 buildings, average cost: $261,000
- 2019: 90 buildings, average cost: $257,500
- 2018: 94 buildings, average cost: $255,100
- 2017: 100 buildings, average cost: $248,700
- 2016: 105 buildings, average cost: $247,800
- 2015: 69 buildings, average cost: $233,000
- 2014: 72 buildings, average cost: $236,000
- 2013: 67 buildings, average cost: $227,900
- 2012: 47 buildings, average cost: $233,100
- 2011: 76 buildings, average cost: $213,300
- 2010: 89 buildings, average cost: $208,300
- 2009: 88 buildings, average cost: $218,600
- 2008: 98 buildings, average cost: $206,900
- 2007: 85 buildings, average cost: $187,000
- 2006: 101 buildings, average cost: $185,300
- 2005: 142 buildings, average cost: $163,600
- 2004: 70 buildings, average cost: $128,200
- 2003: 169 buildings, average cost: $109,700
- 2002: 196 buildings, average cost: $103,200
- 2001: 140 buildings, average cost: $101,400
- 2000: 156 buildings, average cost: $99,500
- 1999: 173 buildings, average cost: $92,400
- 1998: 175 buildings, average cost: $86,200
- 1997: 157 buildings, average cost: $84,000
Median real estate property taxes paid for housing units with mortgages in 2022: $2,724 (1.1%)
Median real estate property taxes paid for housing units with no mortgage in 2022: $2,386 (1.1%)
| Perry County: | 8.2% |
| Pennsylvania: | 11.8% |
Median age of residents in 2022: 43.8 years old
(Males: 42.8 years old, Females: 45.0 years old)
(Median age for: White residents: 44.6 years old, Black residents: 33.6 years old, American Indian residents: 60.1 years old, Asian residents: 44.1 years old, Hispanic or Latino residents: 24.9 years old, Other race residents: 37.8 years old)
Area name: Harrisburg-Carlisle, PA MSA
Fair market rent in 2006 for a 1-bedroom apartment in Perry County is $550 a month.
Fair market rent for a 2-bedroom apartment is $693 a month.
Fair market rent for a 3-bedroom apartment is $875 a month.
Cities in this county include: Marysville, Duncannon, Newport, Liverpool, Millerstown, Blain, Landisburg, New Buffalo.
Neighboring counties: Bucks County  , Hardin County, Ohio
  , Richmond County, New York , Randolph County, Indiana , Page County, Iowa , Richardson County, Nebraska .
| Here: | 2.4% |
| Pennsylvania: | 2.9% |

Current college students: 982
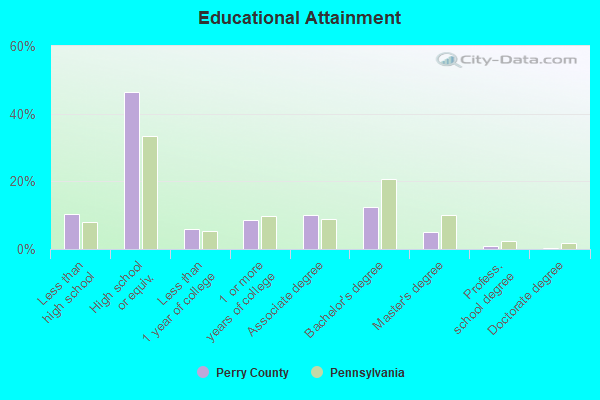
People 25 years of age or older with a high school degree or higher: 89.1%
People 25 years of age or older with a bachelor's degree or higher: 18.3%
Number of foreign born residents: 575 (41.3% naturalized citizens)
| Perry County: | 1.3% |
| Whole state: | 7.5% |
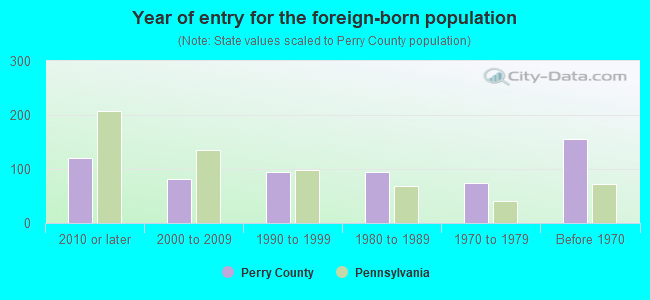
- Year of entry for the foreign-born population
- 2892010 or later
- 582000 to 2009
- 1191990 to 1999
- 951980 to 1989
- 741970 to 1979
- 155Before 1970
Mean travel time to work (commute): minutes
Percentage of county residents living and working in this county: 99.6%
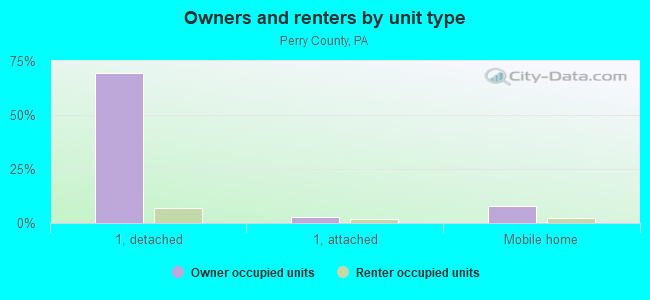
Housing units in structures:
- One, detached: 15,598
- One, attached: 874
- Two: 295
- 3 or 4: 471
- 5 to 9: 484
- 10 to 19: 137
- 20 or more: 220
- Mobile homes: 1,961
- Boats, RVs, vans, etc.: 18
Housing units in Perry County with a mortgage: 8,982 (1,301 second mortgage, 37 home equity loan, 1,184 both second mortgage and home equity loan)
Houses without a mortgage: 503
| Here: | 1.6% with mortgage |
| State: | 93.8% with mortgage |
Religion statistics for Perry County
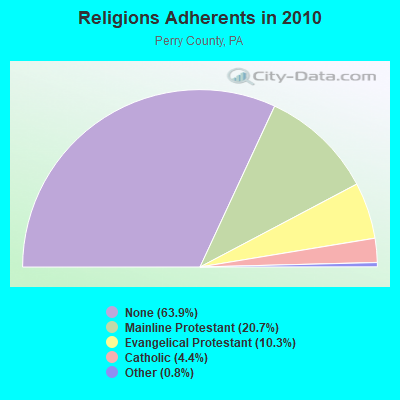
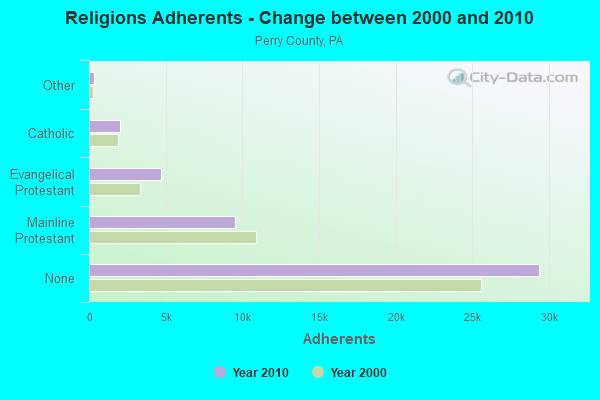
| Religion | Adherents | Congregations |
|---|---|---|
| Mainline Protestant | 9,527 | 56 |
| Evangelical Protestant | 4,714 | 50 |
| Catholic | 2,000 | 3 |
| Other | 346 | 2 |
| None | 29,382 | - |
Source: Clifford Grammich, Kirk Hadaway, Richard Houseal, Dale E.Jones, Alexei Krindatch, Richie Stanley and Richard H.Taylor. 2012. 2010 U.S.Religion Census: Religious Congregations & Membership Study. Association of Statisticians of American Religious Bodies. Jones, Dale E., et al. 2002. Congregations and Membership in the United States 2000. Nashville, TN: Glenmary Research Center.
Food Environment Statistics:
| Perry County: | 2.22 / 10,000 pop. |
| State: | 2.04 / 10,000 pop. |
| This county: | 0.67 / 10,000 pop. |
| Pennsylvania: | 0.88 / 10,000 pop. |
| Perry County: | 3.55 / 10,000 pop. |
| Pennsylvania: | 2.52 / 10,000 pop. |
| This county: | 5.55 / 10,000 pop. |
| State: | 7.12 / 10,000 pop. |
| Perry County: | 9.6% |
| Pennsylvania: | 9.1% |
| Perry County: | 29.3% |
| State: | 27.2% |
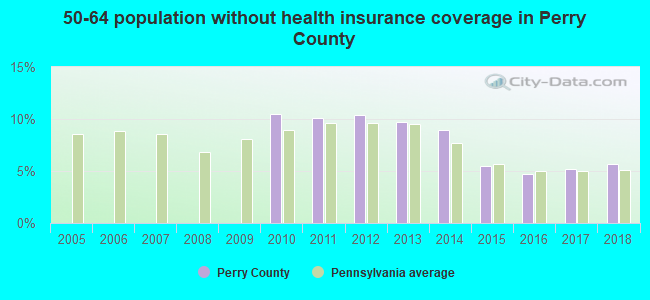
| Here: | 8.0% |
| State: | 11.5% |
Agriculture in Perry County:
Average size of farms: 172 acresAverage value of agricultural products sold per farm: $92,784
Average value of crops sold per acre for harvested cropland: $133.15
The value of nursery, greenhouse, floriculture, and sod as a percentage of the total market value of agricultural products sold: 1.85%
The value of livestock, poultry, and their products as a percentage of the total market value of agricultural products sold: 86.73%
Average total farm production expenses per farm: $79,220
Harvested cropland as a percentage of land in farms: 53.86%
Irrigated harvested cropland as a percentage of land in farms: 0.71%
Average market value of all machinery and equipment per farm: $57,438
The percentage of farms operated by a family or individual: 94.15%
Average age of principal farm operators: 54 years
Average number of cattle and calves per 100 acres of all land in farms: 18.45
Milk cows as a percentage of all cattle and calves: 35.10%
Corn for grain: 8293 harvested acres
All wheat for grain: 4004 harvested acres
Soybeans for beans: 6948 harvested acres
Vegetables: 353 harvested acres
Land in orchards: 71 acres
Earthquake activity:
Perry County-area historical earthquake activity is significantly above Pennsylvania state average. It is 63% smaller than the overall U.S. average.On 8/23/2011 at 17:51:04, a magnitude 5.8 (5.8 MW, Depth: 3.7 mi, Class: Moderate, Intensity: VI - VII) earthquake occurred 178.4 miles away from Perry County center
On 9/25/1998 at 19:52:52, a magnitude 5.2 (4.8 MB, 4.3 MS, 5.2 LG, 4.5 MW, Depth: 3.1 mi) earthquake occurred 183.3 miles away from the county center
On 1/16/1994 at 01:49:16, a magnitude 4.6 (4.6 MB, 4.6 LG, Depth: 3.1 mi, Class: Light, Intensity: IV - V) earthquake occurred 60.8 miles away from the county center
On 1/31/1986 at 16:46:43, a magnitude 5.0 (5.0 MB) earthquake occurred 222.9 miles away from the county center
On 1/16/1994 at 00:42:43, a magnitude 4.2 (4.2 MB, 4.0 LG, Depth: 3.1 mi) earthquake occurred 62.4 miles away from Perry County center
On 10/7/1983 at 10:18:46, a magnitude 5.3 (5.1 MB, 5.3 LG, 5.1 ML) earthquake occurred 284.3 miles away from the county center
Magnitude types: regional Lg-wave magnitude (LG), body-wave magnitude (MB), local magnitude (ML), surface-wave magnitude (MS), moment magnitude (MW)
Most recent natural disasters:
- Pennsylvania Covid-19 Pandemic, Incident Period: January 20, 2020, Major Disaster (Presidential) Declared DR-4506-PA: March 30, 2020, FEMA Id: 4506, Natural disaster type: Other
- Pennsylvania Severe Winter Storm and Snowstorm, Incident Period: January 22, 2016 to January 23, 2016, Major Disaster (Presidential) Declared DR-4267: March 23, 2016, FEMA Id: 4267, Natural disaster type: Snowstorm, Winter Storm
- Pennsylvania Hurricane Sandy, Incident Period: October 26, 2012 to November 08, 2012, Emergency Declared EM-3356: October 29, 2012, FEMA Id: 3356, Natural disaster type: Hurricane
- Pennsylvania Remnants of Tropical Storm Lee, Incident Period: September 03, 2011 to October 15, 2011, Major Disaster (Presidential) Declared EM-3340: September 08, 2011, FEMA Id: 3340, Natural disaster type: Tropical Storm
- Pennsylvania Tropical Storm Lee, Incident Period: September 03, 2011 to October 15, 2011, Major Disaster (Presidential) Declared DR-4030: September 12, 2011, FEMA Id: 4030, Natural disaster type: Tropical Storm
- Pennsylvania Severe Winter Storms and Snowstorms, Incident Period: February 05, 2010 to February 11, 2010, Major Disaster (Presidential) Declared DR-1898: April 16, 2010, FEMA Id: 1898, Natural disaster type: Snowstorm, Winter Storm
- Pennsylvania Severe Storms, Flooding, and Mudslides, Incident Period: June 23, 2006 to July 10, 2006, Major Disaster (Presidential) Declared DR-1649: June 30, 2006, FEMA Id: 1649, Natural disaster type: Storm, Mudslide, Flood
- Pennsylvania Hurricane Katrina Evacuation, Incident Period: August 29, 2005 to October 01, 2005, Emergency Declared EM-3235: September 10, 2005, FEMA Id: 3235, Natural disaster type: Hurricane
- Pennsylvania Tropical Depression Ivan, Incident Period: September 17, 2004 to October 01, 2004, Major Disaster (Presidential) Declared DR-1557: September 19, 2004, FEMA Id: 1557, Natural disaster type: Tropical Depression
- Pennsylvania Snowstorm, Incident Period: February 14, 2003 to February 19, 2003, Emergency Declared EM-3180: March 14, 2003, FEMA Id: 3180, Natural disaster type: Snowstorm
- 8 other natural disasters have been reported since 1953.
The number of natural disasters in Perry County (18) is near the US average (15).
Major Disasters (Presidential) Declared: 14
Emergencies Declared: 4
Causes of natural disasters: Floods: 4, Storms: 4, Winter Storms: 4, Hurricanes: 3, Snowstorms: 3, Tropical Storms: 3, Blizzard: 1, Heavy Rain: 1, Mudslide: 1, Snowfall: 1, Tropical Depression: 1, Other: 1 (Note: some incidents may be assigned to more than one category).
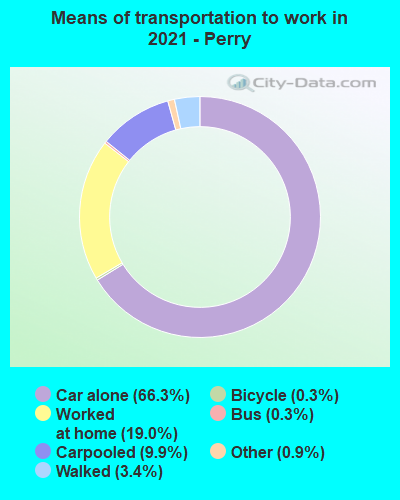
Means of transportation to work:
- Drove a car alone: 6,864 (63.4%)
- Carpooled: 904 (8.4%)
- Bus: 23 (0.2%)
- Taxicab, motorcycle, or other means: 124 (1.1%)
- Bicycle: 34 (0.3%)
- Walked: 323 (3.0%)
- Worked at home: 2,944 (27.2%)
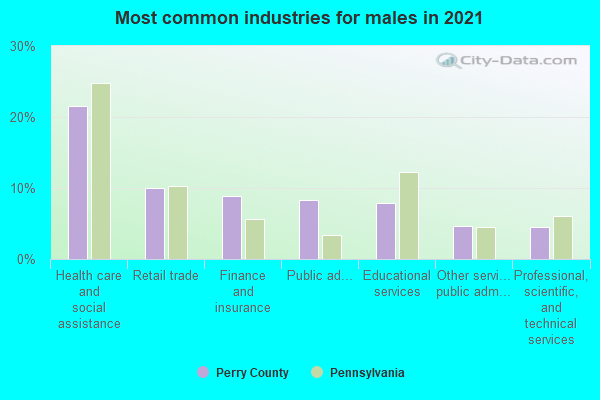
- Health care and social assistance (23%)
- Retail trade (10%)
- Finance and insurance (9%)
- Educational services (7%)
- Public administration (7%)
- Other services, except public administration (5%)
- Accommodation and food services (4%)
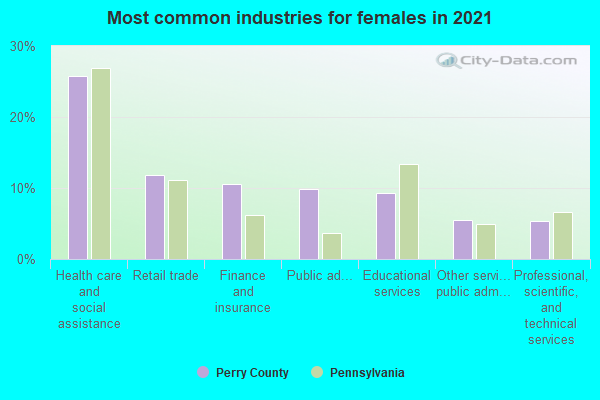
- Health care and social assistance (27%)
- Retail trade (12%)
- Finance and insurance (11%)
- Educational services (9%)
- Public administration (9%)
- Other services, except public administration (6%)
- Accommodation and food services (5%)
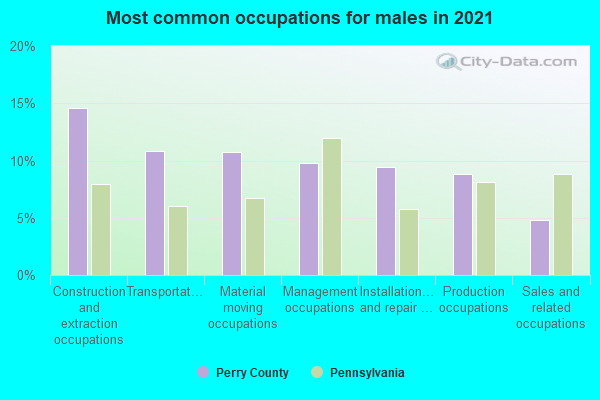
- Construction and extraction occupations (14%)
- Transportation occupations (11%)
- Material moving occupations (10%)
- Management occupations (10%)
- Installation, maintenance, and repair occupations (10%)
- Production occupations (9%)
- Sales and related occupations (5%)
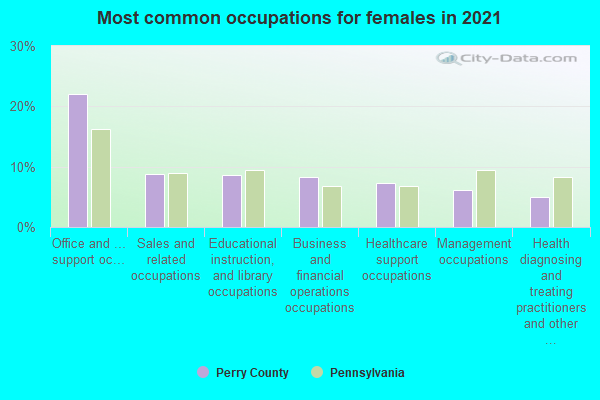
- Office and administrative support occupations (22%)
- Business and financial operations occupations (9%)
- Educational instruction, and library occupations (9%)
- Sales and related occupations (8%)
- Healthcare support occupations (8%)
- Management occupations (7%)
- Food preparation and serving related occupations (5%)
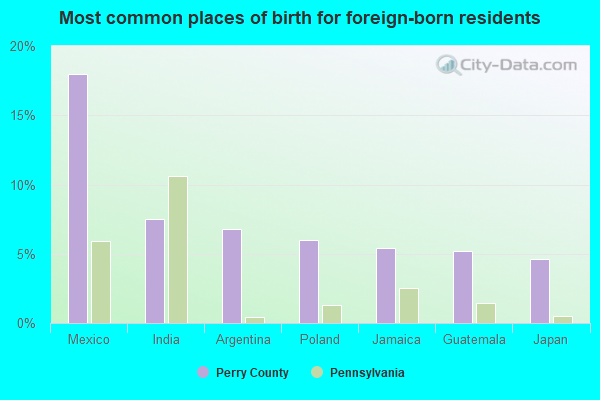
- Mexico (12%)
- Uruguay (11%)
- Guatemala (9%)
- Asia, n.e.c. (5%)
- Poland (5%)
- Ireland (4%)
- India (4%)
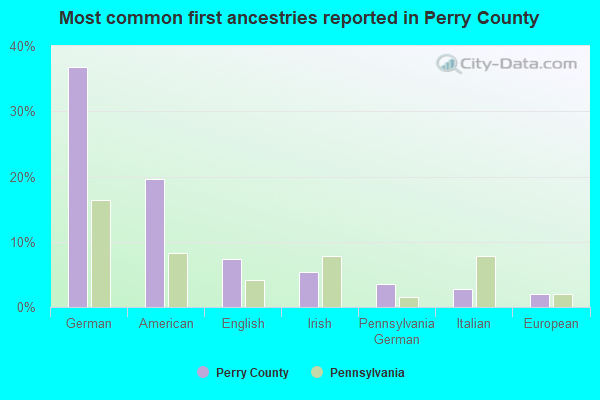
- German (36%)
- American (18%)
- English (7%)
- Irish (6%)
- Pennsylvania German (5%)
- Italian (3%)
- Polish (2%)
People in group quarters in Perry County, Pennsylvania in 2010:
- 278 people in nursing facilities/skilled-nursing facilities
- 141 people in workers' group living quarters and job corps centers
- 113 people in local jails and other municipal confinement facilities
- 103 people in correctional facilities intended for juveniles
- 22 people in group homes intended for adults
People in group quarters in Perry County, Pennsylvania in 2000:
- 276 people in nursing homes
- 92 people in training schools for juvenile delinquents
- 76 people in local jails and other confinement facilities (including police lockups)
- 18 people in unknown juvenile institutions
- 17 people in other noninstitutional group quarters
- 10 people in other nonhousehold living situations
- 8 people in schools, hospitals, or wards for the intellectually disabled
- 5 people in homes for the mentally retarded
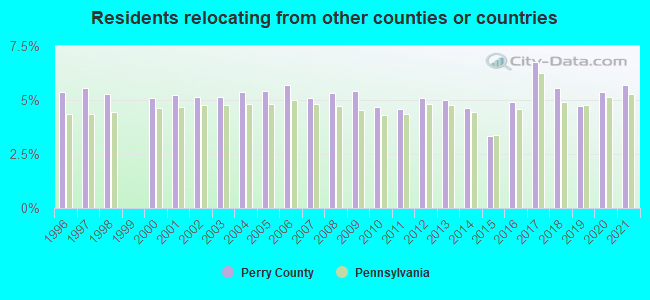
5.68% of this county's 2021 resident taxpayers lived in other counties in 2020 ($51,195 average adjusted gross income)
| Here: | 5.68% |
| Pennsylvania average: | 5.27% |
10 or fewer of this county's residents moved from foreign countries.
4.76% relocated from other counties in Pennsylvania ($42,931 average AGI)
0.92% relocated from other states ($8,264 average AGI)
Perry County: 0.92% Pennsylvania average: 2.30%
Top counties from which taxpayers relocated into this county between 2020 and 2021:
| from Cumberland County, PA | |
| from Dauphin County, PA | |
| from York County, PA | |
| from Juniata County, PA | |
| from Lancaster County, PA | |
| from Lebanon County, PA |
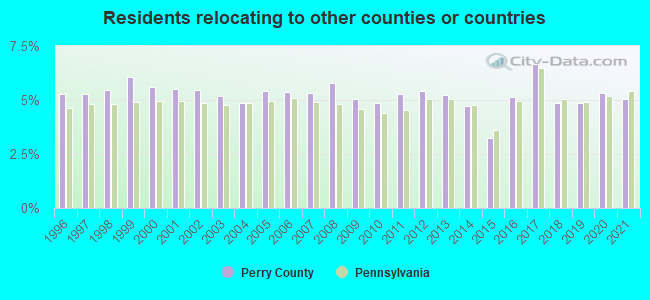
5.04% of this county's 2020 resident taxpayers moved to other counties in 2021 ($47,997 average adjusted gross income)
| Here: | 5.04% |
| Pennsylvania average: | 5.44% |
10 or fewer of this county's residents moved to foreign countries.
4.18% relocated to other counties in Pennsylvania ($38,494 average AGI)
0.86% relocated to other states ($9,503 average AGI)
Perry County: 0.86% Pennsylvania average: 2.47%
Top counties to which taxpayers relocated from this county between 2020 and 2021:
| to Cumberland County, PA | |
| to Dauphin County, PA | |
| to York County, PA | |
| to Juniata County, PA | |
| to Lancaster County, PA |
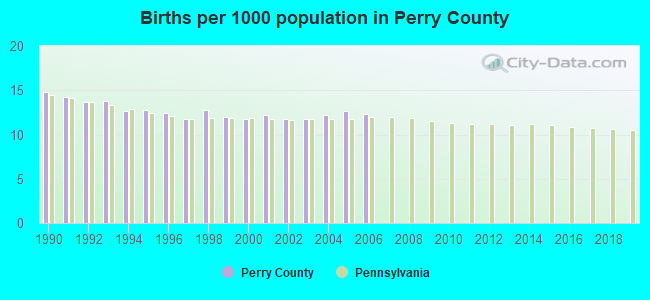
Births per 1000 population from 1990 to 1999: 13.1
Births per 1000 population from 2000 to 2006: 12.1
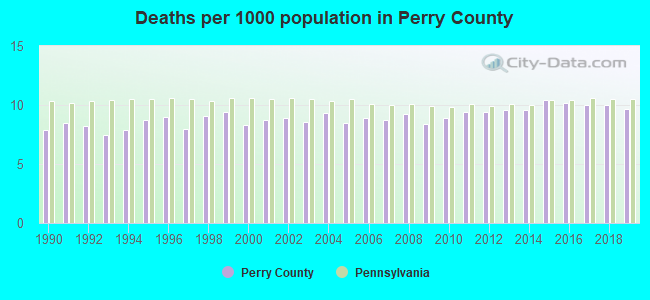
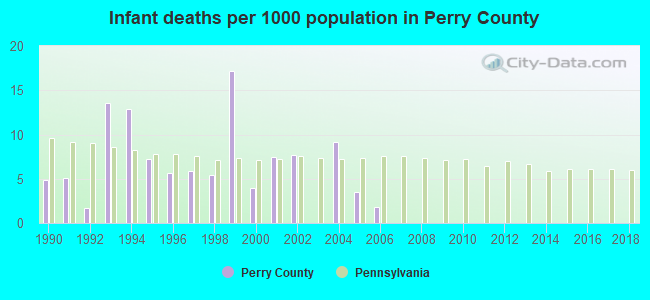
Deaths per 1000 population from 1990 to 1999: 8.4
Deaths per 1000 population from 2000 to 2009: 8.7
Deaths per 1000 population from 2010 to 2020: 9.9
Infant deaths per 1000 live births from 1990 to 1999: 7.9
Infant deaths per 1000 live births from 2000 to 2006: 4.8
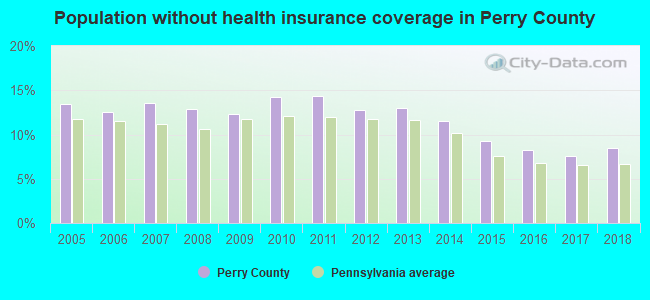
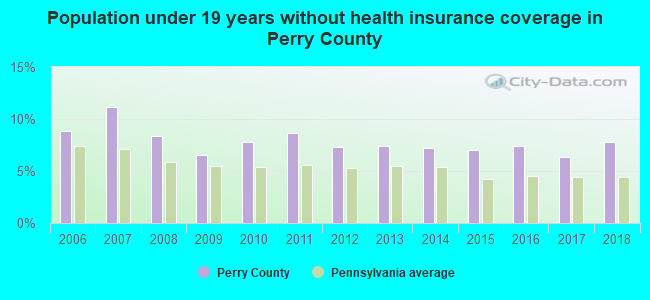
Persons under 19 years old without health insurance coverage in 2018: 7.8%
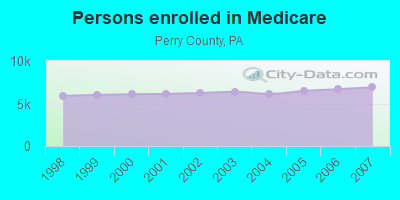
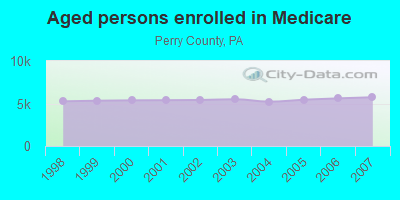
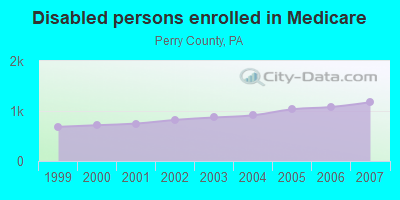
Persons enrolled in hospital insurance and/or supplemental medical insurance (Medicare) in July 1, 2007: 6,912 (5,736 aged, 1,176 disabled)
Children under 18 without health insurance coverage in 2007: 673 (6%)
Most common underlying causes of death in Perry County, Pennsylvania in 1999 - 2019:
- Acute myocardial infarction, unspecified (716)
- Atherosclerotic heart disease (596)
- Bronchus or lung, unspecified - Malignant neoplasms (576)
- Chronic obstructive pulmonary disease, unspecified (341)
- Pneumonia, unspecified (193)
- Stroke, not specified as haemorrhage or infarction (185)
- Congestive heart failure (152)
- Unspecified dementia (141)
- Alzheimer disease, unspecified (138)
- Septicaemia, unspecified (80)
Population without health insurance coverage in 2000: 8%
Children under 18 without health insurance coverage in 2000: 6%
Medical specialist MDs per 100,000 population in 2005: 952
Dentists per 100,000 population in 1998: 18
Total births per 100,000 population, July 2005 - July 2006 : 20
Total deaths per 100,000 population, July 2005 - July 2006: 49
Limited-service eating places per 100,000 population in 2005 : 16
Beer, wine & liquor stores per 100,000 population in 2005: 1
Suicides per 1,000,000 population from 2000 to 2006: 136.0. This is more than state average.
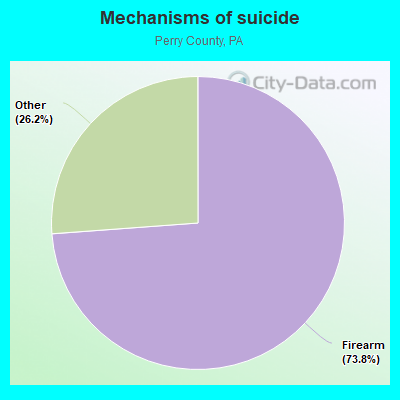
- Firearm - 100.4
- Other - 35.6
Household type by relationship:
Households: 45,880- Male householders: 9,319 (2,326 living alone), Female householders: 9,084 (2,416 living alone)
10,300 spouses (10,221 opposite-sex spouses), 1,478 unmarried partners, (1,446 opposite-sex unmarried partners), 12,416 children (11,498 natural, 264 adopted, 652 stepchildren), 886 grandchildren, 148 brothers or sisters, 554 parents, 34 foster children, 459 other relatives, 662 non-relatives
- In group quarters: 538
Size of family households: 6,319 2-persons, 2,595 3-persons, 1,987 4-persons, 1,071 5-persons, 354 6-persons, 365 7-or-more-persons.
Size of nonfamily households: 4,742 1-person, 894 2-persons, 25 3-persons, 14 4-persons, 16 5-persons, 4 7-or-more-persons.
6,627 married couples with children.
1,929 single-parent households (692 men, 1,237 women).
93.5% of residents of Perry speak English at home.
1.5% of residents speak Spanish at home (74% speak English very well, 6% speak English well, 8% speak English not well, 12% don't speak English at all).
4.3% of residents speak other Indo-European language at home (79% speak English very well, 17% speak English well, 4% speak English not well).
0.3% of residents speak Asian or Pacific Island language at home (72% speak English very well, 6% speak English well, 21% speak English not well).
0.1% of residents speak other language at home (83% speak English very well, 17% speak English well).
In fiscal year 2004:
Federal Government expenditure: $204,538,000 ($4,581 per capita)
Department of Defense expenditure: $7,235,000
Federal direct payments to individuals for retirement and disability: $111,048,000
Federal other direct payments to individuals: $46,473,000
Federal direct payments not to individuals: $2,052,000
Federal grants: $34,487,000
Federal procurement contracts: $4,452,000 ($2,821,000 Department of Defense)
Federal salaries and wages: $6,026,000 ($0,000 Department of Defense)
Federal Government direct loans: $1,221,000
Federal guaranteed/insured loans: $12,047,000
Federal Government insurance: $39,816,000
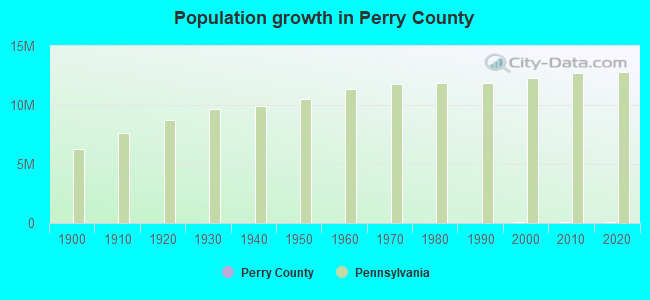
Population change from April 1, 2000 to July 1, 2005:
Births: 2,709| Here: | 61 per 1000 residents |
| State: | 61 per 1000 residents |
Deaths: 1,981
| Here: | 44 per 1000 residents |
| State: | 54 per 1000 residents |
Net international migration: +23
| Here: | +1 per 1000 residents |
| State: | +8 per 1000 residents |
Net internal migration: +436
| Here: | |
| State: |
Total withdrawal of fresh water for public supply: 0.89 millions of gallons per day (74% from ground, 26% from surface)
| Here: | 6.5 |
| State: | 6.8 |
| Here: | 4.6 |
| State: | 4.3 |
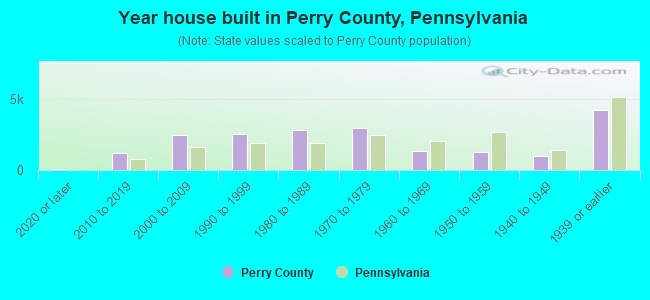
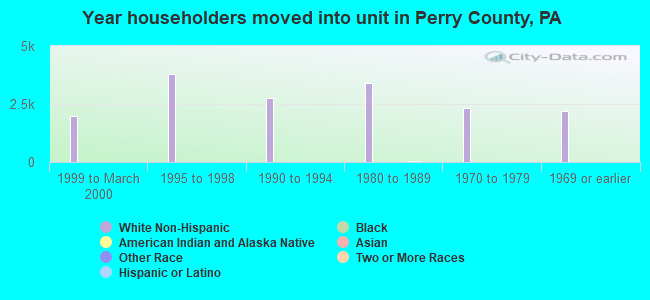
- Year house built in Perry County, Pennsylvania
- 1162020 or later
- 1,4502010 to 2019
- 2,3422000 to 2009
- 2,4201990 to 1999
- 2,8151980 to 1989
- 2,9751970 to 1979
- 1,3811960 to 1969
- 1,4041950 to 1959
- 8661940 to 1949
- 4,3441939 or earlier
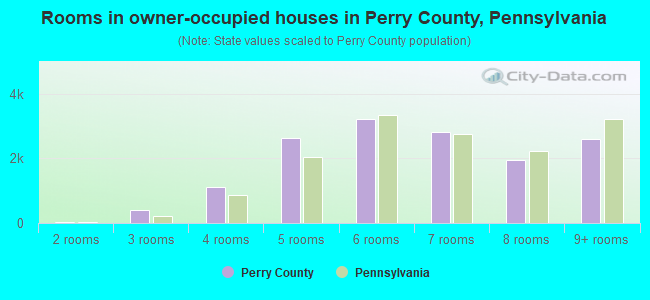
- Rooms in owner-occupied houses in Perry County, Pennsylvania
- 371 room
- 232 rooms
- 3323 rooms
- 1,2384 rooms
- 2,5685 rooms
- 3,2806 rooms
- 2,7017 rooms
- 1,9828 rooms
- 2,6879+ rooms
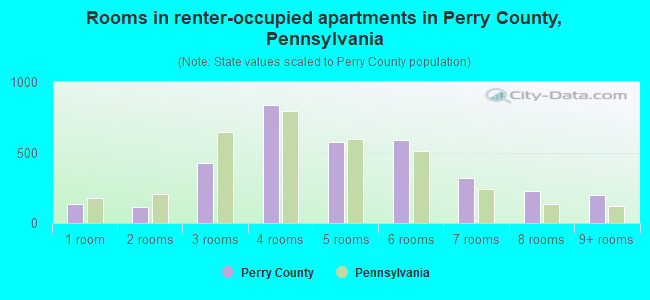
- Rooms in renter-occupied apartments in Perry County, Pennsylvania
- 2161 room
- 1382 rooms
- 3963 rooms
- 1,0154 rooms
- 5775 rooms
- 4796 rooms
- 3287 rooms
- 2128 rooms
- 1839+ rooms
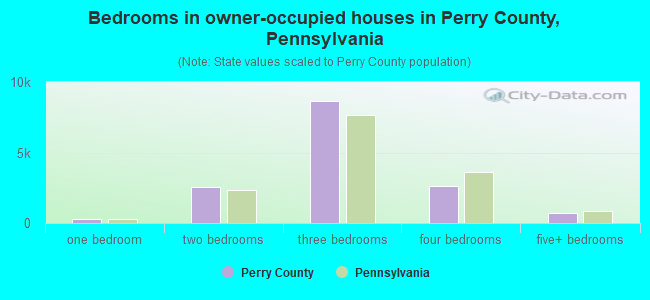
- Bedrooms in owner-occupied houses in Perry County, Pennsylvania
- 42no bedroom
- 2651 bedroom
- 2,5552 bedrooms
- 8,5813 bedrooms
- 2,6644 bedrooms
- 6965+ bedrooms
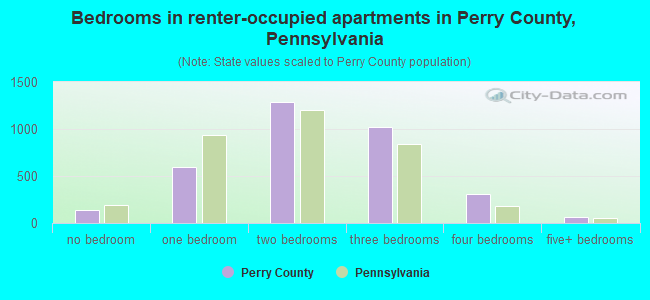
- Bedrooms in renter-occupied apartments in Perry County, Pennsylvania
- 220no bedroom
- 6421 bedroom
- 1,4002 bedrooms
- 9333 bedrooms
- 2964 bedrooms
- 605+ bedrooms
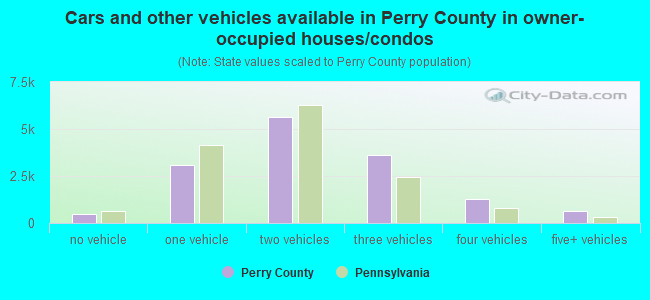
- Cars and other vehicles available in Perry County in owner-occupied houses/condos
- 607no vehicle
- 2,9221 vehicle
- 5,7712 vehicles
- 3,5573 vehicles
- 1,2274 vehicles
- 6565+ vehicles
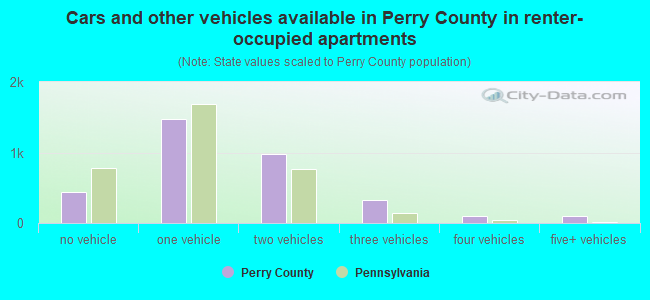
- Cars and other vehicles available in Perry County in renter-occupied apartments
- 425no vehicle
- 1,7051 vehicle
- 9802 vehicles
- 2883 vehicles
- 654 vehicles
- 1365+ vehicles
94.7% of Perry County residents lived in the same house 1 years ago.
Out of people who lived in different houses, 34% lived in this county.
Out of people who lived in different counties, 86% lived in Pennsylvania.
| Perry County: | 94.7% |
| State average: | 89.3% |
Place of birth for U.S.-born residents:
- This state: 39,275
- Other state: 5,390
- Northeast: 1,695
- Midwest: 774
- South: 2,286
- West: 640
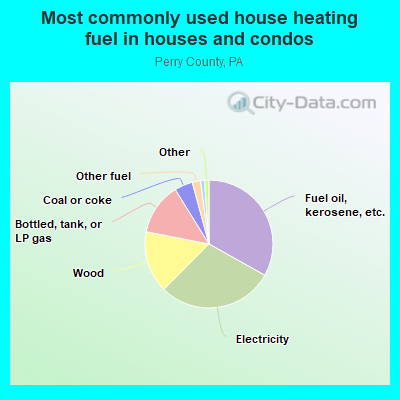
- 33.1%Fuel oil, kerosene, etc.
- 29.4%Electricity
- 14.7%Wood
- 13.8%Bottled, tank, or LP gas
- 4.7%Coal or coke
- 2.0%Other fuel
- 1.2%Utility gas
- 0.9%No fuel used
- 0.2%Solar energy
- 45.6%Electricity
- 31.3%Fuel oil, kerosene, etc.
- 9.4%Wood
- 7.8%Bottled, tank, or LP gas
- 3.6%Utility gas
- 1.8%Coal or coke
- 0.4%Other fuel
- 0.2%No fuel used
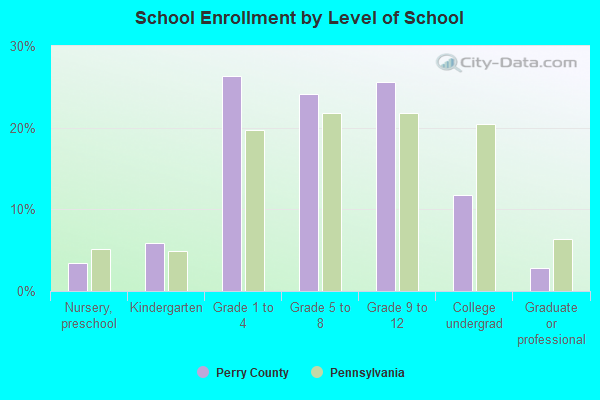
Private vs. public school enrollment:
| Here: | 24.7% |
| Pennsylvania: | 15.7% |
| Here: | 10.9% |
| Pennsylvania: | 13.4% |
| Here: | 22.4% |
| Pennsylvania: | 39.8% |
Perry County government finances - Expenditure in 2020:
- Charges - Other: $3,725,000
Other: $3,337,000
- Construction - General Public Buildings: $14,000
- Current Operations - Public Welfare, Vendor Payments for Medical Care: $8,305,000
Public Welfare - Other: $7,107,000
Public Welfare - Other: $6,638,000
Correctional Institutions: $5,683,000
Central Staff Services: $5,589,000
Public Welfare, Vendor Payments for Medical Care: $5,029,000
Correctional Institutions: $4,480,000
Central Staff Services: $4,029,000
Health - Other: $1,947,000
Judicial and Legal Services: $1,691,000
Natural Resources - Other: $1,492,000
Natural Resources - Other: $1,462,000
Financial Administration: $1,129,000
Judicial and Legal Services: $1,096,000
Corrections - Other: $954,000
Corrections - Other: $951,000
General Public Buildings: $890,000
Police Protection: $870,000
General - Other: $870,000
Financial Administration: $690,000
Police Protection: $655,000
General Public Buildings: $639,000
Health - Other: $477,000
Regular Highways: $215,000
Regular Highways: $36,000
- Miscellaneous - General Revenue - Other: $326,000
Interest Earnings: $323,000
Interest Earnings: $172,000
Fines and Forfeits: $25,000
Fines and Forfeits: $23,000
- Other Capital Outlay - Central Staff Services: $1,691,000
Central Staff Services: $976,000
Correctional Institutions: $11,000
Health - Other: $2,000
- Other Funds - Cash and Securities: $16,882,000
Cash and Securities: $16,760,000
- State Intergovernmental - Public Welfare: $8,305,000
General Local Government Support: $7,225,000
General Local Government Support: $6,092,000
Public Welfare: $5,029,000
Other: $3,873,000
Other: $3,519,000
- Tax - Property: $9,991,000
Property: $9,760,000
Other License: $11,000
Other License: $9,000
- Total Salaries and Wages: $8,602,000
: $7,537,000
Perry County government finances - Revenue in 2020:
- Charges - Other: $3,725,000
Other: $3,337,000
- Construction - General Public Buildings: $14,000
- Current Operations - Public Welfare, Vendor Payments for Medical Care: $8,305,000
Public Welfare - Other: $7,107,000
Public Welfare - Other: $6,638,000
Correctional Institutions: $5,683,000
Central Staff Services: $5,589,000
Public Welfare, Vendor Payments for Medical Care: $5,029,000
Correctional Institutions: $4,480,000
Central Staff Services: $4,029,000
Health - Other: $1,947,000
Judicial and Legal Services: $1,691,000
Natural Resources - Other: $1,492,000
Natural Resources - Other: $1,462,000
Financial Administration: $1,129,000
Judicial and Legal Services: $1,096,000
Corrections - Other: $954,000
Corrections - Other: $951,000
General Public Buildings: $890,000
Police Protection: $870,000
General - Other: $870,000
Financial Administration: $690,000
Police Protection: $655,000
General Public Buildings: $639,000
Health - Other: $477,000
Regular Highways: $215,000
Regular Highways: $36,000
- Miscellaneous - General Revenue - Other: $326,000
Interest Earnings: $323,000
Interest Earnings: $172,000
Fines and Forfeits: $25,000
Fines and Forfeits: $23,000
- Other Capital Outlay - Central Staff Services: $1,691,000
Central Staff Services: $976,000
Correctional Institutions: $11,000
Health - Other: $2,000
- Other Funds - Cash and Securities: $16,882,000
Cash and Securities: $16,760,000
- State Intergovernmental - Public Welfare: $8,305,000
General Local Government Support: $7,225,000
General Local Government Support: $6,092,000
Public Welfare: $5,029,000
Other: $3,873,000
Other: $3,519,000
- Tax - Property: $9,991,000
Property: $9,760,000
Other License: $11,000
Other License: $9,000
- Total Salaries and Wages: $8,602,000
: $7,537,000
Perry County government finances - Debt in 2020:
- Charges - Other: $3,725,000
Other: $3,337,000
- Construction - General Public Buildings: $14,000
- Current Operations - Public Welfare, Vendor Payments for Medical Care: $8,305,000
Public Welfare - Other: $7,107,000
Public Welfare - Other: $6,638,000
Correctional Institutions: $5,683,000
Central Staff Services: $5,589,000
Public Welfare, Vendor Payments for Medical Care: $5,029,000
Correctional Institutions: $4,480,000
Central Staff Services: $4,029,000
Health - Other: $1,947,000
Judicial and Legal Services: $1,691,000
Natural Resources - Other: $1,492,000
Natural Resources - Other: $1,462,000
Financial Administration: $1,129,000
Judicial and Legal Services: $1,096,000
Corrections - Other: $954,000
Corrections - Other: $951,000
General Public Buildings: $890,000
Police Protection: $870,000
General - Other: $870,000
Financial Administration: $690,000
Police Protection: $655,000
General Public Buildings: $639,000
Health - Other: $477,000
Regular Highways: $215,000
Regular Highways: $36,000
- Miscellaneous - General Revenue - Other: $326,000
Interest Earnings: $323,000
Interest Earnings: $172,000
Fines and Forfeits: $25,000
Fines and Forfeits: $23,000
- Other Capital Outlay - Central Staff Services: $1,691,000
Central Staff Services: $976,000
Correctional Institutions: $11,000
Health - Other: $2,000
- Other Funds - Cash and Securities: $16,882,000
Cash and Securities: $16,760,000
- State Intergovernmental - Public Welfare: $8,305,000
General Local Government Support: $7,225,000
General Local Government Support: $6,092,000
Public Welfare: $5,029,000
Other: $3,873,000
Other: $3,519,000
- Tax - Property: $9,991,000
Property: $9,760,000
Other License: $11,000
Other License: $9,000
- Total Salaries and Wages: $8,602,000
: $7,537,000
Perry County government finances - Cash and Securities in 2020:
- Charges - Other: $3,725,000
Other: $3,337,000
- Construction - General Public Buildings: $14,000
- Current Operations - Public Welfare, Vendor Payments for Medical Care: $8,305,000
Public Welfare - Other: $7,107,000
Public Welfare - Other: $6,638,000
Correctional Institutions: $5,683,000
Central Staff Services: $5,589,000
Public Welfare, Vendor Payments for Medical Care: $5,029,000
Correctional Institutions: $4,480,000
Central Staff Services: $4,029,000
Health - Other: $1,947,000
Judicial and Legal Services: $1,691,000
Natural Resources - Other: $1,492,000
Natural Resources - Other: $1,462,000
Financial Administration: $1,129,000
Judicial and Legal Services: $1,096,000
Corrections - Other: $954,000
Corrections - Other: $951,000
General Public Buildings: $890,000
Police Protection: $870,000
General - Other: $870,000
Financial Administration: $690,000
Police Protection: $655,000
General Public Buildings: $639,000
Health - Other: $477,000
Regular Highways: $215,000
Regular Highways: $36,000
- Miscellaneous - General Revenue - Other: $326,000
Interest Earnings: $323,000
Interest Earnings: $172,000
Fines and Forfeits: $25,000
Fines and Forfeits: $23,000
- Other Capital Outlay - Central Staff Services: $1,691,000
Central Staff Services: $976,000
Correctional Institutions: $11,000
Health - Other: $2,000
- Other Funds - Cash and Securities: $16,882,000
Cash and Securities: $16,760,000
- State Intergovernmental - Public Welfare: $8,305,000
General Local Government Support: $7,225,000
General Local Government Support: $6,092,000
Public Welfare: $5,029,000
Other: $3,873,000
Other: $3,519,000
- Tax - Property: $9,991,000
Property: $9,760,000
Other License: $11,000
Other License: $9,000
- Total Salaries and Wages: $8,602,000
: $7,537,000
Supplemental Security Income (SSI) in 2006:
- Total number of recipients: 619
- Number of aged recipients: 38
- Number of blind and disabled recipients: 581
- Number of recipients under 18: 108
- Number of recipients between 18 and 64: 416
- Number of recipients older than 64: 95
- Number of recipients also receiving OASDI: 220
- Amount of payments (thousands of dollars): 273
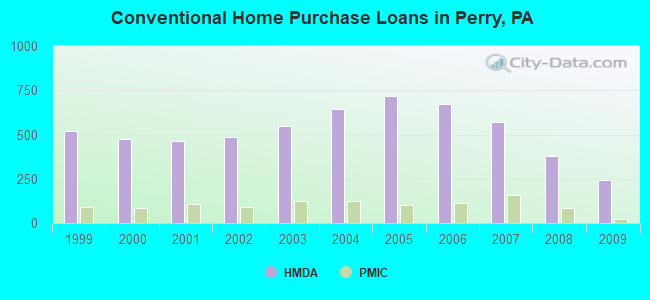
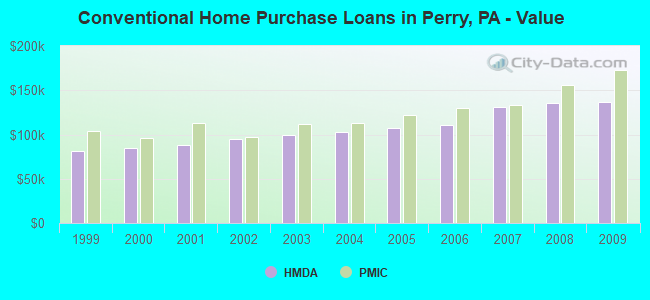
| Home Mortgage Disclosure Act Aggregated Statistics For Year 2009 (Based on 9 full tracts) | ||||||||||||||
| A) FHA, FSA/RHS & VA Home Purchase Loans | B) Conventional Home Purchase Loans | C) Refinancings | D) Home Improvement Loans | E) Loans on Dwellings For 5+ Families | F) Non-occupant Loans on < 5 Family Dwellings (A B C & D) | G) Loans On Manufactured Home Dwelling (A B C & D) | ||||||||
|---|---|---|---|---|---|---|---|---|---|---|---|---|---|---|
| Number | Average Value | Number | Average Value | Number | Average Value | Number | Average Value | Number | Average Value | Number | Average Value | Number | Average Value | |
| LOANS ORIGINATED | 136 | $152,632 | 245 | $136,486 | 1,215 | $127,072 | 250 | $51,456 | 3 | $1,329,333 | 75 | $109,253 | 78 | $53,731 |
| APPLICATIONS APPROVED, NOT ACCEPTED | 7 | $111,429 | 9 | $96,444 | 85 | $134,035 | 15 | $48,333 | 0 | $0 | 5 | $99,600 | 6 | $50,000 |
| APPLICATIONS DENIED | 14 | $138,214 | 74 | $104,297 | 416 | $152,486 | 69 | $38,377 | 0 | $0 | 20 | $85,300 | 45 | $50,711 |
| APPLICATIONS WITHDRAWN | 11 | $159,091 | 45 | $107,467 | 217 | $155,977 | 16 | $76,875 | 0 | $0 | 12 | $96,500 | 15 | $60,400 |
| FILES CLOSED FOR INCOMPLETENESS | 3 | $119,667 | 6 | $112,333 | 48 | $154,792 | 5 | $73,400 | 0 | $0 | 2 | $317,000 | 3 | $64,333 |
| Private Mortgage Insurance Companies Aggregated Statistics For Year 2009 (Based on 9 full tracts) | ||||||
| A) Conventional Home Purchase Loans | B) Refinancings | C) Non-occupant Loans on < 5 Family Dwellings (A & B) | ||||
|---|---|---|---|---|---|---|
| Number | Average Value | Number | Average Value | Number | Average Value | |
| LOANS ORIGINATED | 23 | $173,174 | 21 | $186,667 | 2 | $186,000 |
| APPLICATIONS APPROVED, NOT ACCEPTED | 8 | $188,750 | 14 | $189,643 | 0 | $0 |
| APPLICATIONS DENIED | 2 | $175,500 | 6 | $237,833 | 0 | $0 |
| APPLICATIONS WITHDRAWN | 3 | $237,333 | 0 | $0 | 0 | $0 |
| FILES CLOSED FOR INCOMPLETENESS | 1 | $68,000 | 1 | $140,000 | 1 | $68,000 |
| Most common first names in Perry County, PA among deceased individuals | ||
| Name | Count | Lived (average) |
|---|---|---|
| John | 234 | 76.3 years |
| Mary | 227 | 78.8 years |
| William | 180 | 75.3 years |
| Charles | 175 | 74.1 years |
| George | 158 | 75.5 years |
| Robert | 136 | 70.0 years |
| James | 123 | 71.5 years |
| Ruth | 101 | 78.8 years |
| Helen | 91 | 78.7 years |
| Margaret | 85 | 80.2 years |
| Most common last names in Perry County, PA among deceased individuals | ||
| Last name | Count | Lived (average) |
|---|---|---|
| Smith | 141 | 77.5 years |
| Miller | 101 | 75.7 years |
| Campbell | 53 | 73.3 years |
| Snyder | 51 | 78.5 years |
| Myers | 46 | 73.9 years |
| Baker | 46 | 76.6 years |
| Sheaffer | 44 | 73.1 years |
| Wright | 36 | 74.6 years |
| Swartz | 36 | 70.0 years |
| Jones | 33 | 73.3 years |
| Businesses in Perry County, PA | ||||
| Name | Count | Name | Count | |
|---|---|---|---|---|
| AT&T | 1 | Goodwill | 1 | |
| Blockbuster | 1 | H&R Block | 2 | |
| Curves | 1 | La-Z-Boy | 1 | |
| Decora Cabinetry | 1 | MasterBrand Cabinets | 1 | |
| Dunkin Donuts | 1 | McDonald's | 1 | |
| FedEx | 1 | Rite Aid | 2 | |
| Ford | 1 | Subway | 3 | |
| GNC | 1 | True Value | 2 | |
| Giant | 1 | U-Haul | 2 | |
Perry County on our top lists:
- #47 on the list of "Top 101 counties with the lowest Nitrogen Dioxide air pollution readings in 2012 (ppm)"
- #50 on the list of "Top 101 counties with the lowest Sulfur Oxides Annual air pollution readings in 2012 (µg/m3)"
- #74 on the list of "Top 101 counties with the lowest Ozone (1-hour) air pollution readings in 2012 (ppm)"