Linn County, Kansas (KS)
County owner-occupied free and clear houses and condos in 2010: 1,426
County owner-occupied houses and condos in 2000: 3,142
Renter-occupied apartments: 799 (it was 665 in 2000)
| % of renters here: | 17% |
| State: | 32% |
Land area: 599 sq. mi.
Water area: 7.6 sq. mi.
Population density: 16 people per square mile (low).
Industries providing employment: Educational, health and social services (21.9%), Construction (14.2%), Retail trade (12.0%).
Type of workers:
- Private wage or salary: 69%
- Government: 20%
- Self-employed, not incorporated: 10%
- Unpaid family work: 0%
- OSM Map
- General Map
- Google Map
- MSN Map

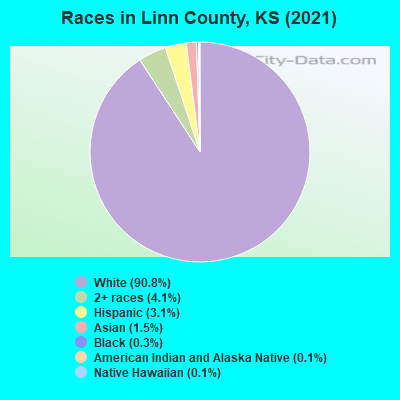
- 8,75190.5%White Non-Hispanic Alone
- 4634.8%Two or more races
- 3043.1%Hispanic or Latino
- 550.6%Asian alone
- 490.5%Black Non-Hispanic Alone
- 350.4%Native Hawaiian and Other
Pacific Islander alone - 160.2%American Indian and Alaska Native alone
| Median resident age: | 45.6 years |
| Kansas median age: | 37.6 years |
| Males: 5,005 | |
| Females: 4,695 |

 | Some general questions about Kansas (134 replies) |
| Job in Topeka but wanting suggestions on other areas to live (43 replies) |
| Looking for Mr French (1 reply) |
| Missing one of these?‏ (0 replies) |
| Anyone familiar with lakes communities in Linn and Bourbon Counties? (19 replies) |
| Hello Pleasanton Kansas (8 replies) |
| Linn County: | 2.0 people |
| Kansas: | 2 people |
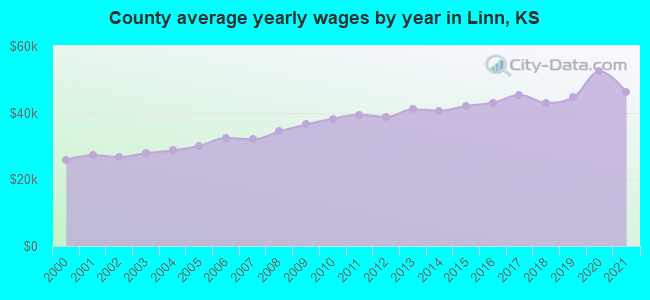
Estimated median household income in 2022: $56,028 ($35,906 in 1999)
| This county: | $56,028 |
| Kansas: | $68,925 |
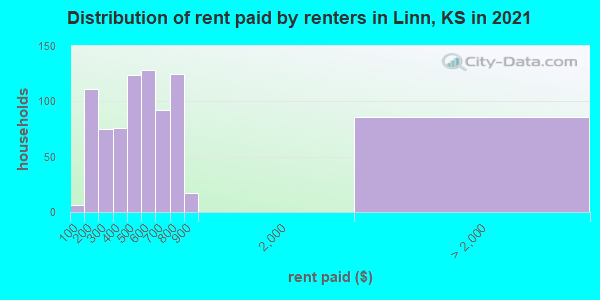
Median contract rent in 2022 for apartments: $502 (lower quartile is $359, upper quartile is $730)
| This county: | $502 |
| State: | $772 |
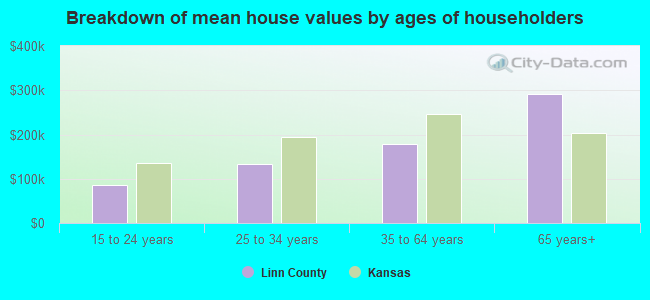
Estimated median house or condo value in 2022: $161,744 (it was $67,300 in 2000)
| Linn: | $161,744 |
| Kansas: | $206,600 |
Median monthly housing costs for homes and condos with a mortgage: $1,278
Median monthly housing costs for units without a mortgage: $574
Institutionalized population: 63
Crime in 2021 (reported by the sheriff's office or county police, not the county total):
- Murders: 1
- Rapes: 1
- Robberies: 0
- Assaults: 5
- Burglaries: 7
- Thefts: 67
- Auto thefts: 8
Crime in 2020 (reported by the sheriff's office or county police, not the county total):
- Murders: 0
- Rapes: 5
- Robberies: 0
- Assaults: 14
- Burglaries: 21
- Thefts: 50
- Auto thefts: 5
Health of residents in Linn County based on CDC Behavioral Risk Factor Surveillance System Survey Questionnaires from 2013 to 2021:
General health status score of residents in this county from 1 (poor) to 5 (excellent) is 3.5. This is about average.72.6% of residents exercised in the past month. This is about average.
42.0% of residents smoked 100+ cigarettes in their lives. This is about average.
55.3% of adult residents drank alcohol in the past 30 days. This is less than average.
71.7% of residents visited a dentist within the past year. This is about average.
Average weight of males is 203 pounds. This is more than average.
Average weight of females is 166 pounds. This is more than average.
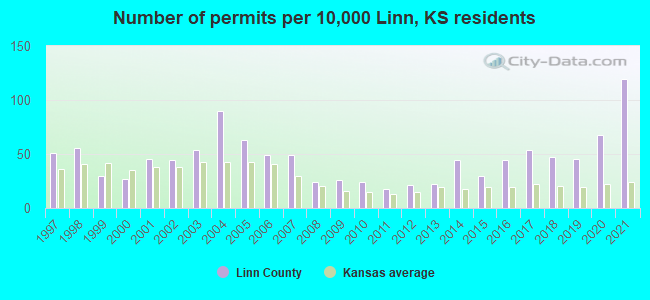
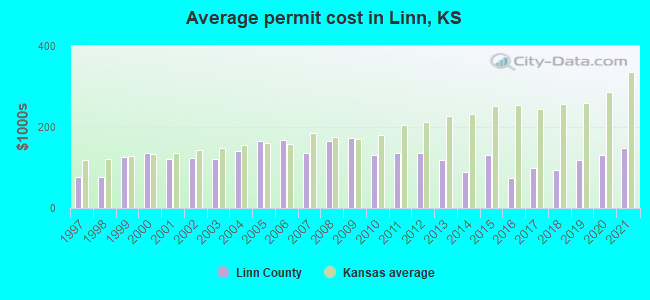
Single-family new house construction building permits:
- 2022: 83 buildings, average cost: $121,000
- 2021: 114 buildings, average cost: $149,300
- 2020: 65 buildings, average cost: $132,400
- 2019: 43 buildings, average cost: $118,900
- 2018: 45 buildings, average cost: $94,400
- 2017: 52 buildings, average cost: $97,700
- 2016: 42 buildings, average cost: $75,400
- 2015: 29 buildings, average cost: $130,400
- 2014: 42 buildings, average cost: $88,500
- 2013: 21 buildings, average cost: $119,400
- 2012: 20 buildings, average cost: $135,000
- 2011: 17 buildings, average cost: $137,000
- 2010: 23 buildings, average cost: $131,400
- 2009: 25 buildings, average cost: $172,500
- 2008: 23 buildings, average cost: $165,300
- 2007: 47 buildings, average cost: $137,200
- 2006: 47 buildings, average cost: $167,500
- 2005: 60 buildings, average cost: $164,900
- 2004: 86 buildings, average cost: $140,000
- 2003: 52 buildings, average cost: $121,200
- 2002: 42 buildings, average cost: $124,400
- 2001: 43 buildings, average cost: $120,100
- 2000: 26 buildings, average cost: $137,300
- 1999: 29 buildings, average cost: $126,900
- 1998: 54 buildings, average cost: $76,300
- 1997: 49 buildings, average cost: $77,300
Median real estate property taxes paid for housing units with mortgages in 2022: $1,831 (1.2%)
Median real estate property taxes paid for housing units with no mortgage in 2022: $1,427 (0.8%)


| Linn County: | 11.9% |
| Kansas: | 12.0% |
Median age of residents in 2022: 45.6 years old
(Males: 45.3 years old, Females: 45.9 years old)
(Median age for: White residents: 46.6 years old, Black residents: 38.1 years old, Asian residents: 39.2 years old, Hispanic or Latino residents: 42.5 years old, Other race residents: 22.9 years old)
Area name: Kansas City, MO-KS HUD Metro FMR Area
Fair market rent in 2006 for a 1-bedroom apartment in Linn County is $612 a month.
Fair market rent for a 2-bedroom apartment is $703 a month.
Fair market rent for a 3-bedroom apartment is $951 a month.
Cities in this county include: Pleasanton, La Cygne, Mound City, Linn Valley, Parker, Prescott, Blue Mound.
Neighboring counties: Bourbon County, Kentucky  , Crawford County, Indiana , Somerset County, Maryland , Fleming County, Kentucky , Hanover County, Virginia , Wayne County, West Virginia , Richmond County, Virginia , Wayne County, Illinois .
| Here: | 3.0% |
| Kansas: | 2.0% |
Current college students: 183
People 25 years of age or older with a high school degree or higher: 93.5%
People 25 years of age or older with a bachelor's degree or higher: 22.1%
Number of foreign born residents: 52 (43.4% naturalized citizens)
| Linn County: | 0.5% |
| Whole state: | 7.1% |
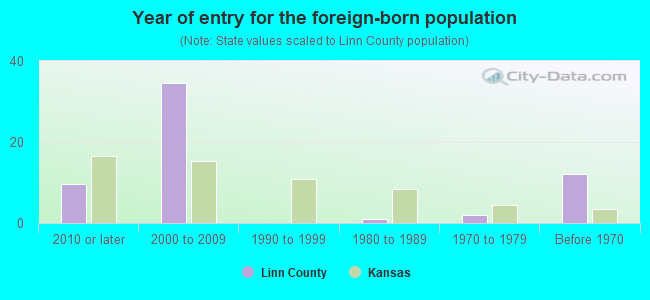
- Year of entry for the foreign-born population
- 72010 or later
- 312000 to 2009
- 01990 to 1999
- 11980 to 1989
- 21970 to 1979
- 12Before 1970
Mean travel time to work (commute): ! minutes
Percentage of county residents living and working in this county: 96.3%
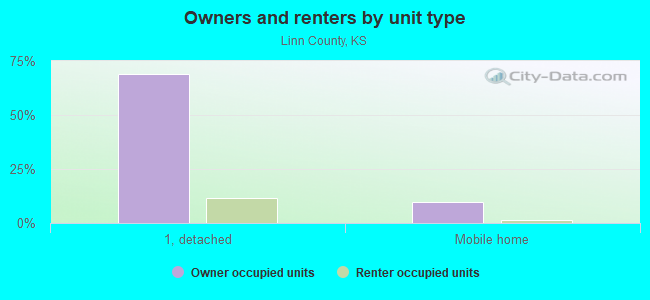
Housing units in structures:
- One, detached: 4,166
- One, attached: 5
- Two: 62
- 3 or 4: 118
- 5 to 9: 35
- 10 to 19: 68
- Mobile homes: 694
- Boats, RVs, vans, etc.: 4
Housing units in Linn County with a mortgage: 1,610 (42 second mortgage, 0 home equity loan, 38 both second mortgage and home equity loan)
Houses without a mortgage: 71
| Here: | 1.4% with mortgage |
| State: | 97.8% with mortgage |
Religion statistics for Linn County
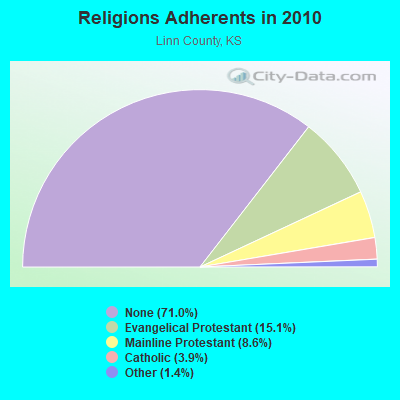
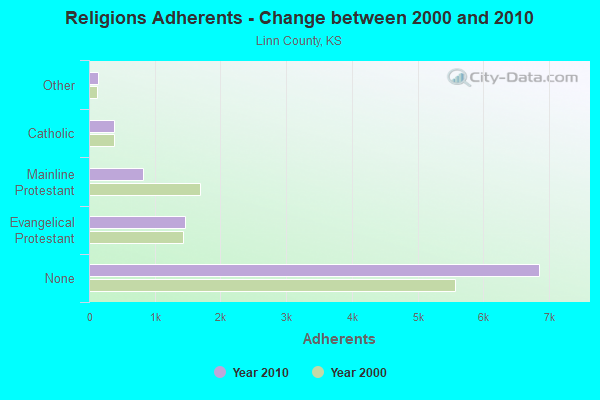
| Religion | Adherents | Congregations |
|---|---|---|
| Evangelical Protestant | 1,460 | 13 |
| Mainline Protestant | 828 | 9 |
| Catholic | 380 | 2 |
| Other | 134 | 1 |
| None | 6,854 | - |
Source: Clifford Grammich, Kirk Hadaway, Richard Houseal, Dale E.Jones, Alexei Krindatch, Richie Stanley and Richard H.Taylor. 2012. 2010 U.S.Religion Census: Religious Congregations & Membership Study. Association of Statisticians of American Religious Bodies. Jones, Dale E., et al. 2002. Congregations and Membership in the United States 2000. Nashville, TN: Glenmary Research Center.
Food Environment Statistics:
| Linn County: | 3.08 / 10,000 pop. |
| State: | 1.96 / 10,000 pop. |
| Linn County: | 7.20 / 10,000 pop. |
| Kansas: | 3.84 / 10,000 pop. |
| This county: | 5.14 / 10,000 pop. |
| State: | 7.33 / 10,000 pop. |
| Linn County: | 8.6% |
| Kansas: | 8.1% |
| Linn County: | 28.5% |
| State: | 27.9% |
| Here: | 12.8% |
| State: | 13.4% |
Agriculture in Linn County:
Average size of farms: 344 acresAverage value of agricultural products sold per farm: $25,540
Average value of crops sold per acre for harvested cropland: $88.07
The value of nursery, greenhouse, floriculture, and sod as a percentage of the total market value of agricultural products sold: 0.14%
The value of livestock, poultry, and their products as a percentage of the total market value of agricultural products sold: 54.98%
Average total farm production expenses per farm: $28,270
Harvested cropland as a percentage of land in farms: 37.93%
Irrigated harvested cropland as a percentage of land in farms: 0.65%
Average market value of all machinery and equipment per farm: $62,263
The percentage of farms operated by a family or individual: 93.36%
Average age of principal farm operators: 56 years
Average number of cattle and calves per 100 acres of all land in farms: 13.59
Milk cows as a percentage of all cattle and calves: 1.39%
Corn for grain: 12317 harvested acres
All wheat for grain: 13676 harvested acres
Soybeans for beans: 46427 harvested acres
Land in orchards: 160 acres
Earthquake activity:
Linn County-area historical earthquake activity is significantly above Kansas state average. It is 594% greater than the overall U.S. average.On 9/3/2016 at 12:02:44, a magnitude 5.8 (5.8 MW, Depth: 3.5 mi, Class: Moderate, Intensity: VI - VII) earthquake occurred 170.6 miles away from Linn County center
On 11/6/2011 at 03:53:10, a magnitude 5.7 (5.7 MW, Depth: 3.2 mi) earthquake occurred 215.4 miles away from the county center
On 11/12/2014 at 21:40:00, a magnitude 4.9 (4.9 MW, Depth: 2.5 mi, Class: Light, Intensity: IV - V) earthquake occurred 167.5 miles away from the county center
On 11/7/2016 at 01:44:24, a magnitude 5.0 (5.0 MW, Depth: 2.8 mi) earthquake occurred 189.7 miles away from the county center
On 2/13/2016 at 17:07:06, a magnitude 5.1 (5.1 MW, Depth: 5.2 mi) earthquake occurred 245.8 miles away from Linn County center
On 11/5/2011 at 07:12:45, a magnitude 4.8 (4.8 MW, Depth: 1.9 mi) earthquake occurred 214.3 miles away from the county center
Magnitude types: moment magnitude (MW)
Most recent natural disasters:
- Kansas Covid-19 Pandemic, Incident Period: January 20, 2020, FEMA Id: 4504, Natural disaster type: Other
- Kansas Severe Storms, Straight-line Winds, Tornadoes, Flooding,landslides,and Mudslides, Incident Period: April 28, 2019, FEMA Id: 4449, Natural disaster type: Storm, Tornado, Mudslide, Landslide, Flood, Wind
- Kansas Severe Storms, Straight-line Winds, Tornadoes, and Flooding, Incident Period: July 22, 2013 to August 16, 2013, Major Disaster (Presidential) Declared DR-4150: October 22, 2013, FEMA Id: 4150, Natural disaster type: Storm, Tornado, Flood, Wind
- Kansas Severe Winter Storms and Snowstorm, Incident Period: December 22, 2009 to January 08, 2010, Major Disaster (Presidential) Declared DR-1885: March 09, 2010, FEMA Id: 1885, Natural disaster type: Snowstorm, Winter Storm
- Kansas Severe Storms and Flooding, Incident Period: July 08, 2009 to July 14, 2009, Major Disaster (Presidential) Declared DR-1860: September 30, 2009, FEMA Id: 1860, Natural disaster type: Storm, Flood
- Kansas Severe Storms, Flooding, Straight-line Winds, and Tornadoes, Incident Period: April 25, 2009 to May 16, 2009, Major Disaster (Presidential) Declared DR-1849: June 25, 2009, FEMA Id: 1849, Natural disaster type: Storm, Tornado, Flood, Wind
- Kansas Severe Storms, Flooding, and Tornadoes, Incident Period: May 22, 2008 to June 16, 2008, Major Disaster (Presidential) Declared DR-1776: July 09, 2008, FEMA Id: 1776, Natural disaster type: Storm, Tornado, Flood
- Kansas Severe Winter Storms, Incident Period: December 06, 2007 to December 19, 2007, Emergency Declared EM-3282: December 12, 2007, FEMA Id: 3282, Natural disaster type: Winter Storm
- Kansas Severe Storms and Flooding, Incident Period: June 26, 2007 to July 25, 2007, Major Disaster (Presidential) Declared DR-1711: July 02, 2007, FEMA Id: 1711, Natural disaster type: Storm, Flood
- Kansas Hurricane Katrina Evacuation, Incident Period: September 01, 2005 to October 01, 2005, Emergency Declared EM-3236: September 10, 2005, FEMA Id: 3236, Natural disaster type: Hurricane
- 5 other natural disasters have been reported since 1953.
The number of natural disasters in Linn County (15) is near the US average (15).
Major Disasters (Presidential) Declared: 11
Emergencies Declared: 2
Causes of natural disasters: Floods: 10, Storms: 10, Tornadoes: 7, Winds: 3, Winter Storms: 2, Hurricane: 1, Ice Storm: 1, Landslide: 1, Mudslide: 1, Snowstorm: 1, Other: 1 (Note: some incidents may be assigned to more than one category).
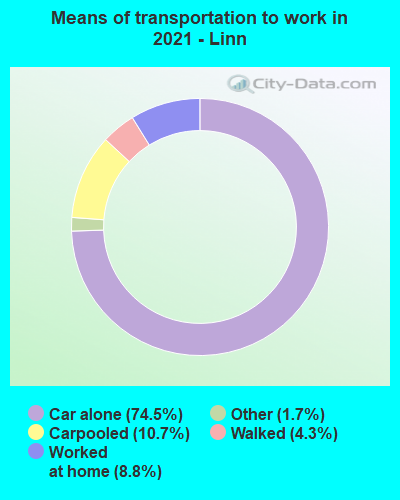
Means of transportation to work:
- Drove a car alone: 1,965 (68.8%)
- Carpooled: 353 (12.4%)
- Taxicab, motorcycle, or other means: 72 (2.5%)
- Walked: 114 (4.0%)
- Worked at home: 363 (12.7%)

- Health care and social assistance (15%)
- Educational services (13%)
- Retail trade (11%)
- Finance and insurance (7%)
- Transportation and warehousing (3%)
- Agriculture, forestry, fishing and hunting (3%)
- Manufacturing (3%)
- Health care and social assistance (19%)
- Educational services (17%)
- Retail trade (14%)
- Finance and insurance (9%)
- Transportation and warehousing (4%)
- Agriculture, forestry, fishing and hunting (4%)
- Manufacturing (4%)
- Construction and extraction occupations (21%)
- Management occupations (12%)
- Production occupations (9%)
- Transportation occupations (7%)
- Sales and related occupations (6%)
- Material moving occupations (6%)
- Installation, maintenance, and repair occupations (6%)
- Office and administrative support occupations (17%)
- Sales and related occupations (15%)
- Educational instruction, and library occupations (14%)
- Management occupations (12%)
- Healthcare support occupations (10%)
- Health diagnosing and treating practitioners and other technical occupations (5%)
- Food preparation and serving related occupations (4%)
- Mexico (36%)
- Laos (21%)
- Philippines (11%)
- China, excluding Hong Kong and Taiwan (6%)
- Canada (6%)
- Russia (4%)
- Bulgaria (4%)
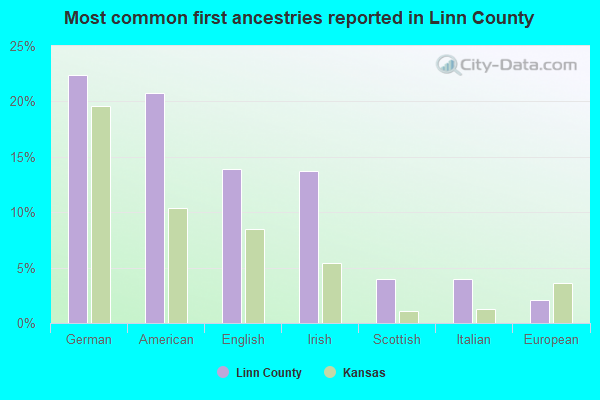
- German (22%)
- American (18%)
- English (15%)
- Irish (15%)
- Scottish (4%)
- European (3%)
- Scotch-Irish (2%)
28 people in local jails and other municipal confinement facilities
People in group quarters in Linn County, Kansas in 2000:
- 99 people in nursing homes
- 14 people in other noninstitutional group quarters
- 10 people in local jails and other confinement facilities (including police lockups)
- 8 people in homes for the mentally retarded
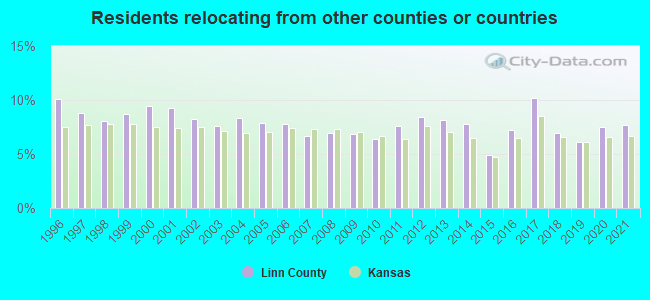
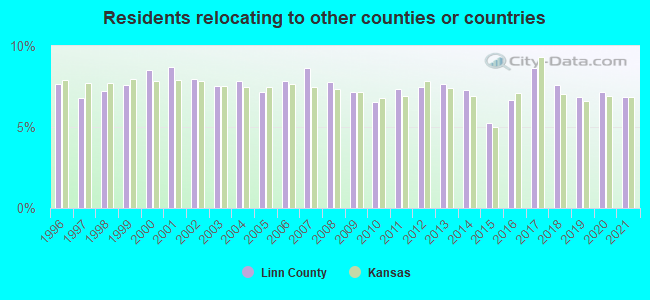
7.71% of this county's 2021 resident taxpayers lived in other counties in 2020 ($54,466 average adjusted gross income)
| Here: | 7.71% |
| Kansas average: | 6.64% |
10 or fewer of this county's residents moved from foreign countries.
5.74% relocated from other counties in Kansas ($40,397 average AGI)
1.97% relocated from other states ($14,069 average AGI)
Linn County: 1.97% Kansas average: 3.37%
Top counties from which taxpayers relocated into this county between 2020 and 2021:
| from Johnson County, KS | |
| from Miami County, KS |
6.87% of this county's 2020 resident taxpayers moved to other counties in 2021 ($46,949 average adjusted gross income)
| Here: | 6.87% |
| Kansas average: | 6.88% |
10 or fewer of this county's residents moved to foreign countries.
4.51% relocated to other counties in Kansas ($28,988 average AGI)
2.36% relocated to other states ($17,961 average AGI)
Linn County: 2.36% Kansas average: 3.62%
Top counties to which taxpayers relocated from this county between 2020 and 2021:
| to Miami County, KS | |
| to Johnson County, KS |
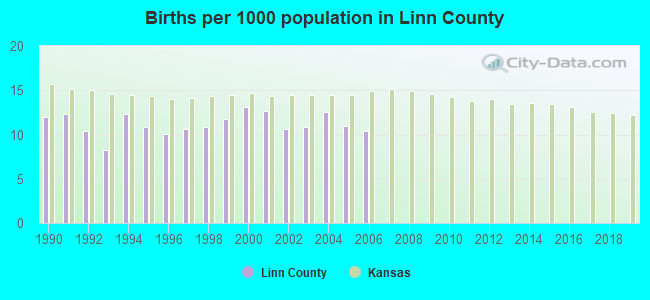
Births per 1000 population from 1990 to 1999: 10.9
Births per 1000 population from 2000 to 2006: 11.6
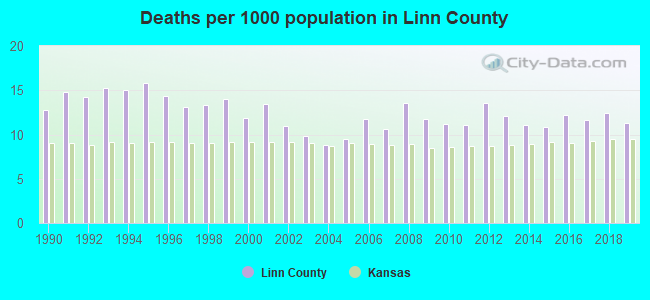
Deaths per 1000 population from 1990 to 1999: 14.2
Deaths per 1000 population from 2000 to 2009: 11.2
Deaths per 1000 population from 2010 to 2020: 12.0
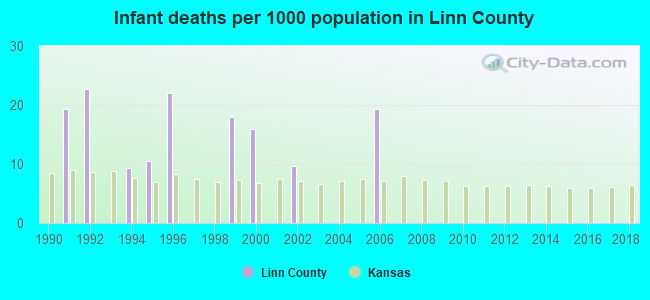
Infant deaths per 1000 live births from 1990 to 1999: 10.2
Infant deaths per 1000 live births from 2000 to 2006: 6.4
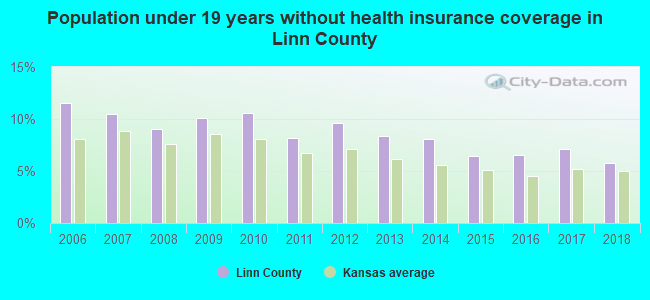
Persons under 19 years old without health insurance coverage in 2018: 5.8%
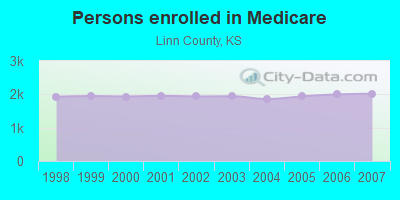
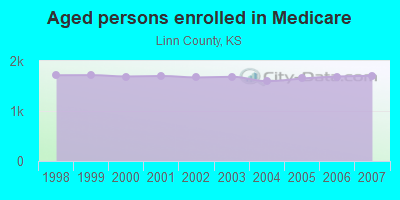
Persons enrolled in hospital insurance and/or supplemental medical insurance (Medicare) in July 1, 2007: 2,018 (1,703 aged, 315 disabled)
Children under 18 without health insurance coverage in 2007: 221 (10%)

Most common underlying causes of death in Linn County, Kansas in 1999 - 2019:
- Acute myocardial infarction, unspecified (109)
- Bronchus or lung, unspecified - Malignant neoplasms (58)
- Atherosclerotic heart disease (48)
Population without health insurance coverage in 2000: 12%
Children under 18 without health insurance coverage in 2000: 10%
Medical specialist MDs per 100,000 population in 2005: 817
Dentists per 100,000 population in 1998: 20
Total births per 100,000 population, July 2005 - July 2006 : 11
Total deaths per 100,000 population, July 2005 - July 2006: 20
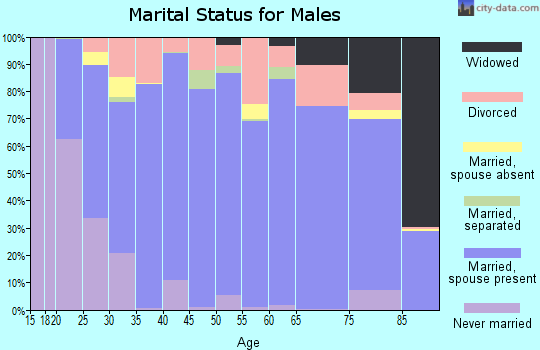
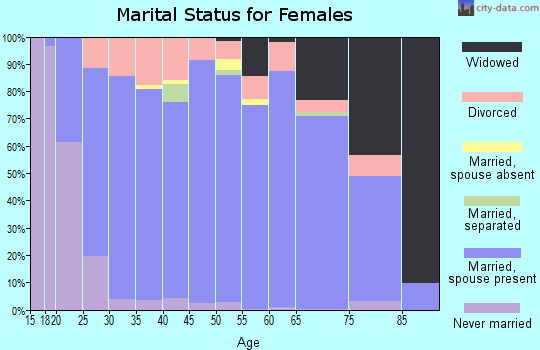
Household type by relationship:
Households: 9,700- Male householders: 2,101 (515 living alone), Female householders: 2,086 (672 living alone)
2,238 spouses (2,238 opposite-sex spouses), 255 unmarried partners, (234 opposite-sex unmarried partners), 2,513 children (2,304 natural, 87 adopted, 120 stepchildren), 118 grandchildren, 63 brothers or sisters, 37 parents, 24 foster children, 53 other relatives, 169 non-relatives
- In group quarters: 50
Size of family households: 1,506 2-persons, 511 3-persons, 315 4-persons, 263 5-persons, 191 6-persons, 19 7-or-more-persons.
Size of nonfamily households: 1,190 1-person, 186 2-persons, 11 4-persons.
1,529 married couples with children.
457 single-parent households (269 men, 188 women).
98.9% of residents of Linn speak English at home.
0.9% of residents speak Spanish at home (100% speak English very well).
0.2% of residents speak other Indo-European language at home (73% speak English very well, 27% speak English well).
0.4% of residents speak Asian or Pacific Island language at home (100% speak English very well).
0.1% of residents speak other language at home (100% speak English very well).
In fiscal year 2004:
Federal Government expenditure: $91,191,000 ($9,329 per capita)
Department of Defense expenditure: $992,000
Federal direct payments to individuals for retirement and disability: $27,667,000
Federal other direct payments to individuals: $15,266,000
Federal direct payments not to individuals: $5,552,000
Federal grants: $39,648,000
Federal procurement contracts: $595,000 ($0,000 Department of Defense)
Federal salaries and wages: $2,463,000 ($0,000 Department of Defense)
Federal Government direct loans: $3,536,000
Federal guaranteed/insured loans: $2,612,000
Federal Government insurance: $7,176,000
Population change from April 1, 2000 to July 1, 2005:
Births: 569| Here: | 57 per 1000 residents |
| State: | 75 per 1000 residents |
Deaths: 549
| Here: | 55 per 1000 residents |
| State: | 47 per 1000 residents |
Net international migration: -2
| Here: | |
| State: |
Net internal migration: +350
| Here: | |
| State: |
Total withdrawal of fresh water for public supply: 0.79 millions of gallons per day (all from surface)
| Here: | 6.0 |
| State: | 6.9 |
| Here: | 4.4 |
| State: | 4.4 |
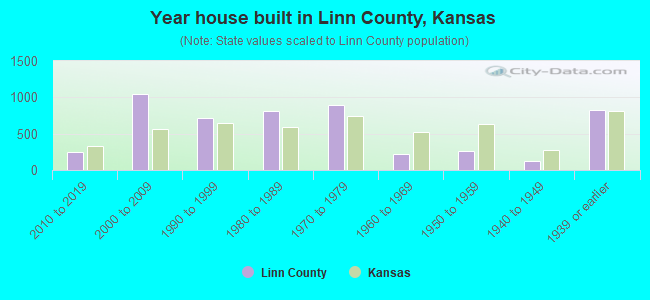
- Year house built in Linn County, Kansas
- 112020 or later
- 3492010 to 2019
- 1,0712000 to 2009
- 6821990 to 1999
- 7841980 to 1989
- 9021970 to 1979
- 1771960 to 1969
- 2631950 to 1959
- 1021940 to 1949
- 8501939 or earlier
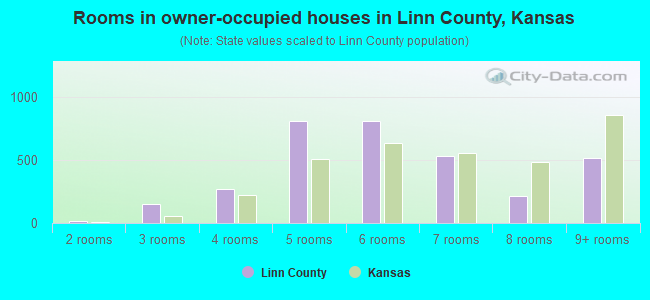
- Rooms in owner-occupied houses in Linn County, Kansas
- 01 room
- 342 rooms
- 1323 rooms
- 3464 rooms
- 8585 rooms
- 7256 rooms
- 5527 rooms
- 3118 rooms
- 5139+ rooms
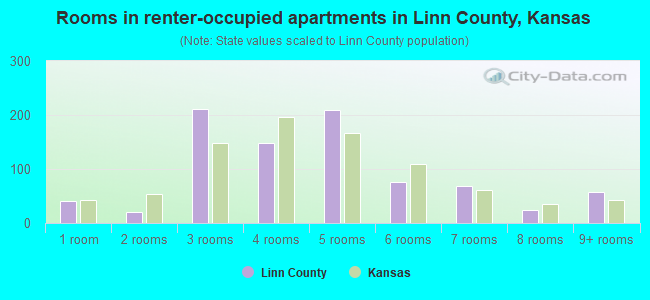
- Rooms in renter-occupied apartments in Linn County, Kansas
- 221 room
- 112 rooms
- 2023 rooms
- 1644 rooms
- 1675 rooms
- 606 rooms
- 567 rooms
- 218 rooms
- 539+ rooms
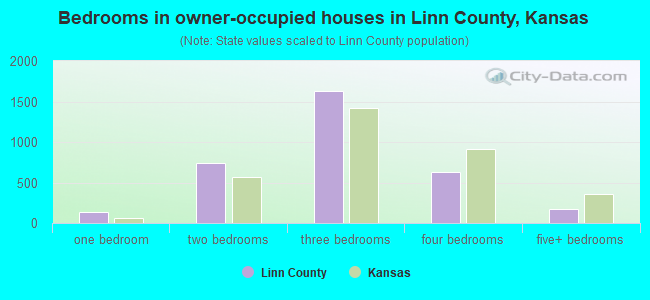
- Bedrooms in owner-occupied houses in Linn County, Kansas
- 0no bedroom
- 2101 bedroom
- 7302 bedrooms
- 1,7513 bedrooms
- 5894 bedrooms
- 1905+ bedrooms
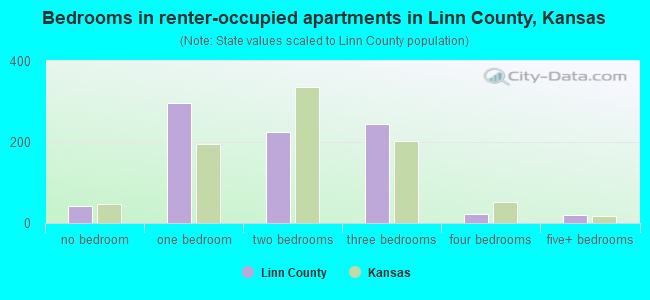
- Bedrooms in renter-occupied apartments in Linn County, Kansas
- 22no bedroom
- 2631 bedroom
- 2402 bedrooms
- 2133 bedrooms
- 134 bedrooms
- 45+ bedrooms
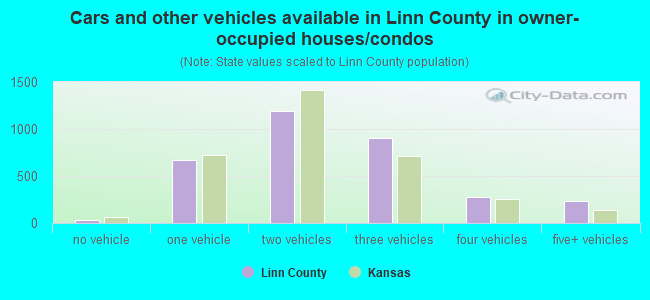
- Cars and other vehicles available in Linn County in owner-occupied houses/condos
- 18no vehicle
- 6471 vehicle
- 1,2442 vehicles
- 9093 vehicles
- 3674 vehicles
- 2615+ vehicles
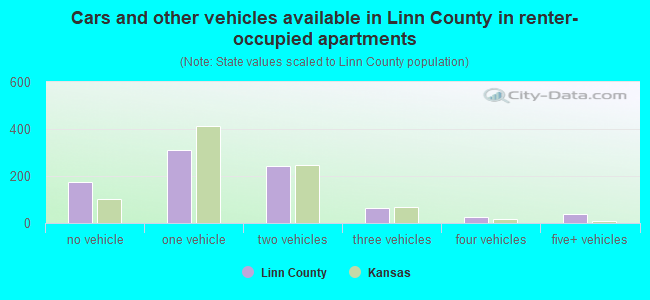
- Cars and other vehicles available in Linn County in renter-occupied apartments
- 160no vehicle
- 2931 vehicle
- 2122 vehicles
- 293 vehicles
- 294 vehicles
- 345+ vehicles
91.1% of Linn County residents lived in the same house 1 years ago.
Out of people who lived in different houses, 28% lived in this county.
Out of people who lived in different counties, 70% lived in Kansas.
| Linn County: | 91.1% |
| State average: | 85.3% |
Place of birth for U.S.-born residents:
- This state: 6,400
- Other state: 3,202
- Northeast: 140
- Midwest: 1,926
- South: 685
- West: 427

- 35.3%Bottled, tank, or LP gas
- 35.0%Electricity
- 25.6%Utility gas
- 3.5%Wood
- 0.3%Other fuel
- 0.2%Fuel oil, kerosene, etc.
- 45.7%Electricity
- 40.3%Utility gas
- 12.5%Bottled, tank, or LP gas
- 1.6%Wood
Private vs. public school enrollment:
| Here: | 2.3% |
| Kansas: | 14.1% |
| Here: | 0.0% |
| Kansas: | 10.8% |
| Here: | 17.2% |
| Kansas: | 15.4% |
Linn County government finances - Expenditure in 2017:
- Charges - Regular Highways: $260,000
Parks and Recreation: $222,000
Solid Waste Management: $131,000
Other: $68,000
- Current Operations - Regular Highways: $3,113,000
General - Other: $2,755,000
Police Protection: $1,513,000
Health - Other: $1,271,000
Local Fire Protection: $640,000
Solid Waste Management: $502,000
Judicial and Legal Services: $468,000
Financial Administration: $459,000
Central Staff Services: $398,000
General Public Buildings: $318,000
Natural Resources - Other: $299,000
Parks and Recreation: $253,000
Corrections - Other: $54,000
- Federal Intergovernmental - Health and Hospitals: $66,000
Other: $25,000
- General - Interest on Debt: $5,000
- Long Term Debt - Beginning Outstanding - Unspecified Public Purpose: $112,000
Outstanding Unspecified Public Purpose: $111,000
Retired Unspecified Public Purpose: $1,000
- Miscellaneous - General Revenue - Other: $108,000
Interest Earnings: $56,000
Rents: $22,000
Donations From Private Sources: $4,000
- Other Capital Outlay - General - Other: $338,000
Police Protection: $74,000
Local Fire Protection: $64,000
General Public Building: $58,000
Regular Highways: $51,000
Health - Other: $27,000
Parks and Recreation: $23,000
Central Staff Services: $15,000
Judicial and Legal Services: $12,000
Financial Administration: $4,000
Natural Resources - Other: $3,000
- Other Funds - Cash and Securities: $2,611,000
- State Intergovernmental - Other: $537,000
Highways: $485,000
Health and Hospitals: $58,000
General Local Government Support: $12,000
- Tax - Property: $10,432,000
Documentary and Stock Transfer: $168,000
Public Utilities Sales: $61,000
Other License: $5,000
- Total Salaries and Wages: $3,199,000
Linn County government finances - Revenue in 2017:
- Charges - Regular Highways: $260,000
Parks and Recreation: $222,000
Solid Waste Management: $131,000
Other: $68,000
- Current Operations - Regular Highways: $3,113,000
General - Other: $2,755,000
Police Protection: $1,513,000
Health - Other: $1,271,000
Local Fire Protection: $640,000
Solid Waste Management: $502,000
Judicial and Legal Services: $468,000
Financial Administration: $459,000
Central Staff Services: $398,000
General Public Buildings: $318,000
Natural Resources - Other: $299,000
Parks and Recreation: $253,000
Corrections - Other: $54,000
- Federal Intergovernmental - Health and Hospitals: $66,000
Other: $25,000
- General - Interest on Debt: $5,000
- Long Term Debt - Beginning Outstanding - Unspecified Public Purpose: $112,000
Outstanding Unspecified Public Purpose: $111,000
Retired Unspecified Public Purpose: $1,000
- Miscellaneous - General Revenue - Other: $108,000
Interest Earnings: $56,000
Rents: $22,000
Donations From Private Sources: $4,000
- Other Capital Outlay - General - Other: $338,000
Police Protection: $74,000
Local Fire Protection: $64,000
General Public Building: $58,000
Regular Highways: $51,000
Health - Other: $27,000
Parks and Recreation: $23,000
Central Staff Services: $15,000
Judicial and Legal Services: $12,000
Financial Administration: $4,000
Natural Resources - Other: $3,000
- Other Funds - Cash and Securities: $2,611,000
- State Intergovernmental - Other: $537,000
Highways: $485,000
Health and Hospitals: $58,000
General Local Government Support: $12,000
- Tax - Property: $10,432,000
Documentary and Stock Transfer: $168,000
Public Utilities Sales: $61,000
Other License: $5,000
- Total Salaries and Wages: $3,199,000
Linn County government finances - Debt in 2017:
- Charges - Regular Highways: $260,000
Parks and Recreation: $222,000
Solid Waste Management: $131,000
Other: $68,000
- Current Operations - Regular Highways: $3,113,000
General - Other: $2,755,000
Police Protection: $1,513,000
Health - Other: $1,271,000
Local Fire Protection: $640,000
Solid Waste Management: $502,000
Judicial and Legal Services: $468,000
Financial Administration: $459,000
Central Staff Services: $398,000
General Public Buildings: $318,000
Natural Resources - Other: $299,000
Parks and Recreation: $253,000
Corrections - Other: $54,000
- Federal Intergovernmental - Health and Hospitals: $66,000
Other: $25,000
- General - Interest on Debt: $5,000
- Long Term Debt - Beginning Outstanding - Unspecified Public Purpose: $112,000
Outstanding Unspecified Public Purpose: $111,000
Retired Unspecified Public Purpose: $1,000
- Miscellaneous - General Revenue - Other: $108,000
Interest Earnings: $56,000
Rents: $22,000
Donations From Private Sources: $4,000
- Other Capital Outlay - General - Other: $338,000
Police Protection: $74,000
Local Fire Protection: $64,000
General Public Building: $58,000
Regular Highways: $51,000
Health - Other: $27,000
Parks and Recreation: $23,000
Central Staff Services: $15,000
Judicial and Legal Services: $12,000
Financial Administration: $4,000
Natural Resources - Other: $3,000
- Other Funds - Cash and Securities: $2,611,000
- State Intergovernmental - Other: $537,000
Highways: $485,000
Health and Hospitals: $58,000
General Local Government Support: $12,000
- Tax - Property: $10,432,000
Documentary and Stock Transfer: $168,000
Public Utilities Sales: $61,000
Other License: $5,000
- Total Salaries and Wages: $3,199,000
Linn County government finances - Cash and Securities in 2017:
- Charges - Regular Highways: $260,000
Parks and Recreation: $222,000
Solid Waste Management: $131,000
Other: $68,000
- Current Operations - Regular Highways: $3,113,000
General - Other: $2,755,000
Police Protection: $1,513,000
Health - Other: $1,271,000
Local Fire Protection: $640,000
Solid Waste Management: $502,000
Judicial and Legal Services: $468,000
Financial Administration: $459,000
Central Staff Services: $398,000
General Public Buildings: $318,000
Natural Resources - Other: $299,000
Parks and Recreation: $253,000
Corrections - Other: $54,000
- Federal Intergovernmental - Health and Hospitals: $66,000
Other: $25,000
- General - Interest on Debt: $5,000
- Long Term Debt - Beginning Outstanding - Unspecified Public Purpose: $112,000
Outstanding Unspecified Public Purpose: $111,000
Retired Unspecified Public Purpose: $1,000
- Miscellaneous - General Revenue - Other: $108,000
Interest Earnings: $56,000
Rents: $22,000
Donations From Private Sources: $4,000
- Other Capital Outlay - General - Other: $338,000
Police Protection: $74,000
Local Fire Protection: $64,000
General Public Building: $58,000
Regular Highways: $51,000
Health - Other: $27,000
Parks and Recreation: $23,000
Central Staff Services: $15,000
Judicial and Legal Services: $12,000
Financial Administration: $4,000
Natural Resources - Other: $3,000
- Other Funds - Cash and Securities: $2,611,000
- State Intergovernmental - Other: $537,000
Highways: $485,000
Health and Hospitals: $58,000
General Local Government Support: $12,000
- Tax - Property: $10,432,000
Documentary and Stock Transfer: $168,000
Public Utilities Sales: $61,000
Other License: $5,000
- Total Salaries and Wages: $3,199,000
Supplemental Security Income (SSI) in 2006:
- Total number of recipients: 145
- Number of aged recipients: 13
- Number of blind and disabled recipients: 132
- Number of recipients under 18: 19
- Number of recipients between 18 and 64: 92
- Number of recipients older than 64: 34
- Number of recipients also receiving OASDI: 67
- Amount of payments (thousands of dollars): 58
| Most common first names in Linn County, KS among deceased individuals | ||
| Name | Count | Lived (average) |
|---|---|---|
| William | 108 | 74.9 years |
| John | 88 | 76.4 years |
| Mary | 77 | 79.4 years |
| James | 73 | 74.6 years |
| Charles | 72 | 77.1 years |
| Robert | 67 | 73.7 years |
| George | 55 | 79.1 years |
| Frank | 40 | 79.3 years |
| Roy | 37 | 79.0 years |
| Harry | 36 | 78.2 years |
| Most common last names in Linn County, KS among deceased individuals | ||
| Last name | Count | Lived (average) |
|---|---|---|
| Smith | 68 | 78.8 years |
| Johnson | 51 | 77.8 years |
| Miller | 41 | 80.1 years |
| Cox | 37 | 79.8 years |
| Jackson | 27 | 77.0 years |
| Ross | 21 | 79.1 years |
| Brown | 21 | 76.9 years |
| Jones | 20 | 79.0 years |
| Holmes | 20 | 81.7 years |
| Wilson | 19 | 78.0 years |
Businesses in Linn County, KS
- FedEx: 1
- Ford: 1
- UPS: 1
Linn County on our top lists:
- #56 on the list of "Top 101 counties with the lowest Nitrogen Dioxide air pollution readings in 2012 (ppm)"
- #97 on the list of "Top 101 counties with the highest Sulfur Oxides Annual air pollution readings in 2012 (µg/m3)"