Miami County, Kansas (KS)
County owner-occupied free and clear houses and condos in 2010: 2,467
County owner-occupied houses and condos in 2000: 8,141
Renter-occupied apartments: 2,621 (it was 2,224 in 2000)
| % of renters here: | 21% |
| State: | 32% |
Land area: 577 sq. mi.
Water area: 13.4 sq. mi.
Population density: 60 people per square mile (average).
Industries providing employment: Educational, health and social services (21.8%), Retail trade (11.2%).
Type of workers:
- Private wage or salary: 80%
- Government: 15%
- Self-employed, not incorporated: 5%
- Unpaid family work: 0%
- OSM Map
- General Map
- Google Map
- MSN Map


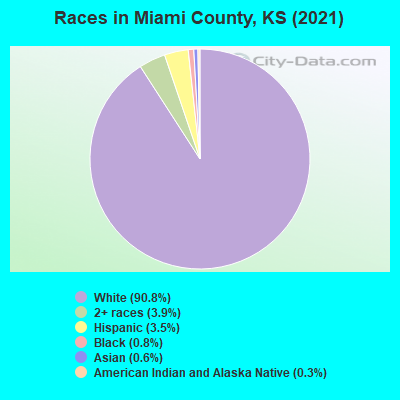
- 30,94390.8%White Non-Hispanic Alone
- 1,2723.7%Hispanic or Latino
- 1,2053.5%Two or more races
- 3431.0%Black Non-Hispanic Alone
- 1730.5%Asian alone
- 1370.4%American Indian and Alaska Native alone
- 220.06%Some other race alone
| Median resident age: | 43.1 years |
| Kansas median age: | 37.6 years |
| Males: 17,429 | |
| Females: 16,897 |

 | Kansas: My impressions (44 replies) |
| No Raincoats for Miami County (0 replies) |
| Moving From California to Kansas (22 replies) |
| Want to move to Kansas from San Diego, any tips on nice areas west of Kansas City, ruralish? (26 replies) |
| Job in Topeka but wanting suggestions on other areas to live (43 replies) |
| What is Chanute Like (24 replies) |
| Miami County: | 2.0 people |
| Kansas: | 2 people |
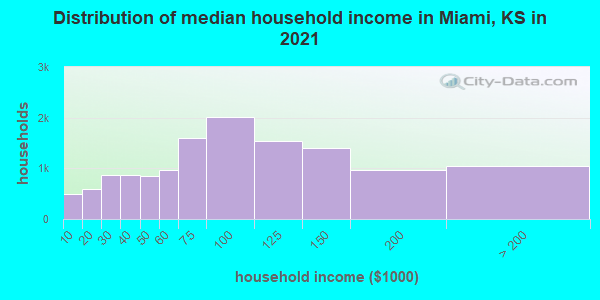
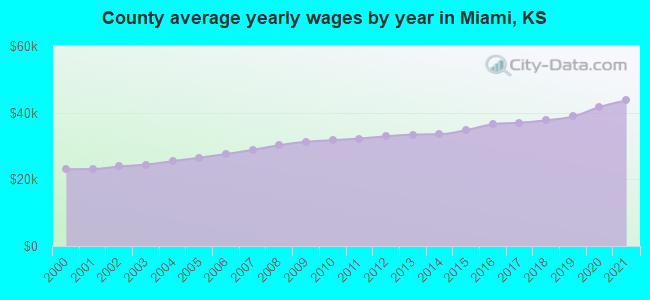
Estimated median household income in 2022: $84,555 ($46,665 in 1999)
| This county: | $84,555 |
| Kansas: | $68,925 |
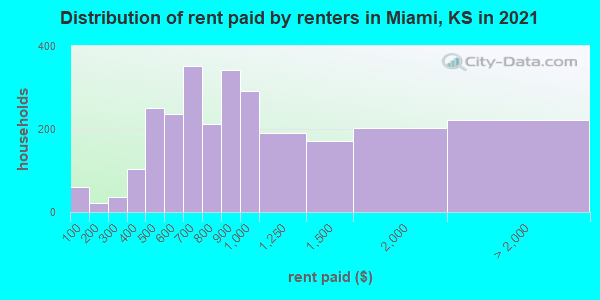
Median contract rent in 2022 for apartments: $847 (lower quartile is $637, upper quartile is $1,097)
| This county: | $847 |
| State: | $772 |
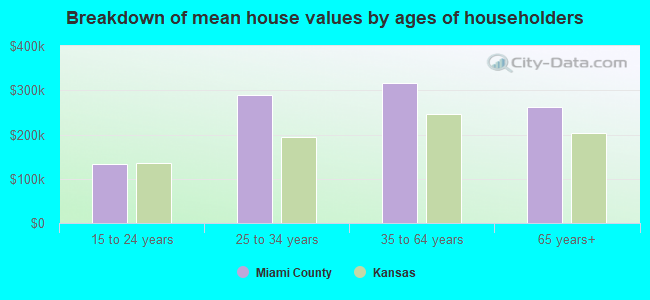
Estimated median house or condo value in 2022: $276,231 (it was $116,400 in 2000)
| Miami: | $276,231 |
| Kansas: | $206,600 |
Mean price in 2022:
Median monthly housing costs for homes and condos with a mortgage: $1,731Detached houses: $350,224
Here: $350,224 State: $264,181 Townhouses or other attached units: $150,735
Here: $150,735 State: $219,178 Mobile homes: $78,054
Here: $78,054 State: $74,712
Median monthly housing costs for units without a mortgage: $675
Institutionalized population: 543
Crime in 2021 (reported by the sheriff's office or county police, not the county total):
- Murders: 0
- Rapes: 1
- Robberies: 2
- Assaults: 30
- Burglaries: 21
- Thefts: 80
- Auto thefts: 21
Crime in 2020 (reported by the sheriff's office or county police, not the county total):
- Murders: 0
- Rapes: 2
- Robberies: 2
- Assaults: 39
- Burglaries: 42
- Thefts: 68
- Auto thefts: 21
Health of residents in Miami County based on CDC Behavioral Risk Factor Surveillance System Survey Questionnaires from 2013 to 2021:
General health status score of residents in this county from 1 (poor) to 5 (excellent) is 3.5. This is about average.72.6% of residents exercised in the past month. This is about average.
42.0% of residents smoked 100+ cigarettes in their lives. This is about average.
55.3% of adult residents drank alcohol in the past 30 days. This is less than average.
71.7% of residents visited a dentist within the past year. This is about average.
Average weight of males is 203 pounds. This is more than average.
Average weight of females is 166 pounds. This is more than average.
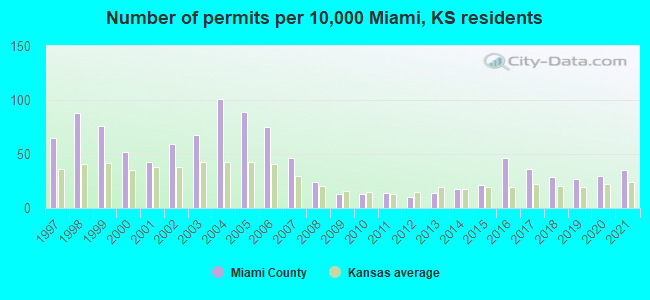
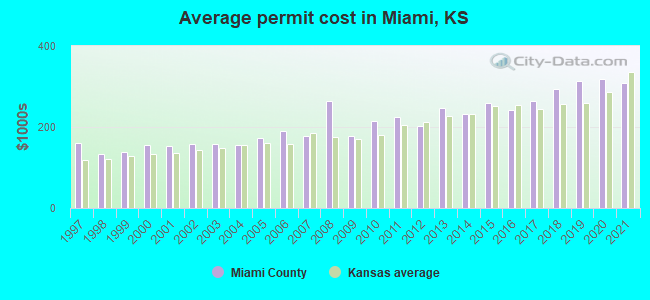
Single-family new house construction building permits:
- 2022: 161 buildings, average cost: $284,000
- 2021: 100 buildings, average cost: $309,400
- 2020: 85 buildings, average cost: $317,500
- 2019: 76 buildings, average cost: $313,800
- 2018: 81 buildings, average cost: $295,400
- 2017: 101 buildings, average cost: $263,100
- 2016: 130 buildings, average cost: $242,700
- 2015: 60 buildings, average cost: $259,600
- 2014: 50 buildings, average cost: $231,400
- 2013: 39 buildings, average cost: $246,600
- 2012: 27 buildings, average cost: $201,500
- 2011: 41 buildings, average cost: $223,600
- 2010: 38 buildings, average cost: $214,000
- 2009: 38 buildings, average cost: $177,500
- 2008: 68 buildings, average cost: $264,700
- 2007: 129 buildings, average cost: $178,400
- 2006: 213 buildings, average cost: $191,100
- 2005: 252 buildings, average cost: $172,200
- 2004: 286 buildings, average cost: $155,200
- 2003: 192 buildings, average cost: $159,000
- 2002: 166 buildings, average cost: $157,000
- 2001: 123 buildings, average cost: $153,200
- 2000: 148 buildings, average cost: $155,800
- 1999: 215 buildings, average cost: $139,000
- 1998: 250 buildings, average cost: $133,700
- 1997: 183 buildings, average cost: $160,400
Median real estate property taxes paid for housing units with mortgages in 2022: $3,158 (1.1%)
Median real estate property taxes paid for housing units with no mortgage in 2022: $3,017 (1.3%)

| Miami County: | 7.2% |
| Kansas: | 12.0% |
Median age of residents in 2022: 43.1 years old
(Males: 42.8 years old, Females: 43.4 years old)
(Median age for: White residents: 43.3 years old, Black residents: 49.3 years old, American Indian residents: 22.8 years old, Asian residents: 50.0 years old, Hispanic or Latino residents: 25.5 years old, Other race residents: 60.0 years old)
Area name: Kansas City, MO-KS HUD Metro FMR Area
Fair market rent in 2006 for a 1-bedroom apartment in Miami County is $612 a month.
Fair market rent for a 2-bedroom apartment is $703 a month.
Fair market rent for a 3-bedroom apartment is $951 a month.
Cities in this county include: Paola, Osawatomie, Louisburg, Hillsdale, Bucyrus, Fontana.
Neighboring counties: Cabell County, West Virginia  , Clay County, Illinois , Fleming County, Kentucky , Mason County, Kentucky , Wayne County, Illinois .
| Here: | 2.0% |
| Kansas: | 2.0% |
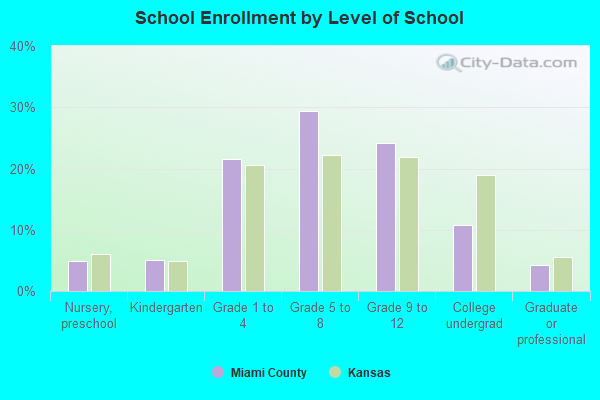
Current college students: 838
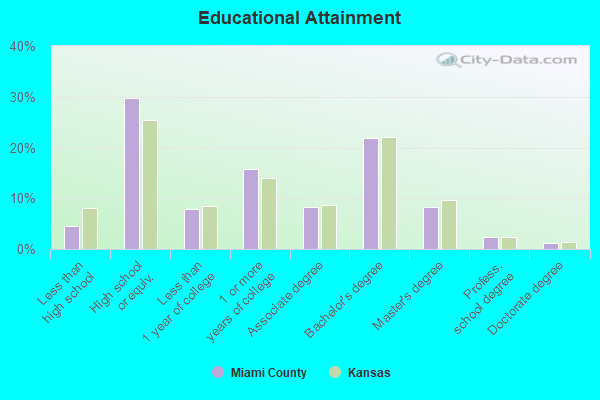
People 25 years of age or older with a high school degree or higher: 95.6%
People 25 years of age or older with a bachelor's degree or higher: 30.6%
Number of foreign born residents: 383 (43.8% naturalized citizens)
| Miami County: | 1.1% |
| Whole state: | 7.1% |
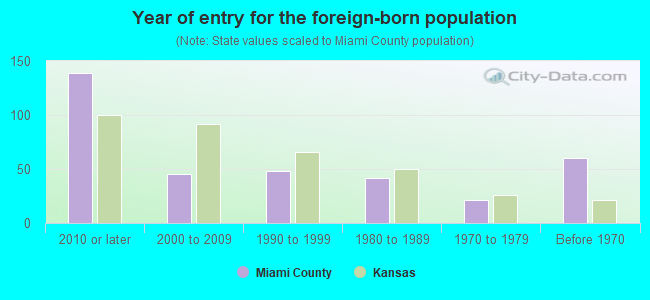
- Year of entry for the foreign-born population
- 1762010 or later
- 892000 to 2009
- 631990 to 1999
- 421980 to 1989
- 211970 to 1979
- 60Before 1970
Mean travel time to work (commute): minutes
Percentage of county residents living and working in this county: 91.7%
Housing units in structures:
- One, detached: 11,982
- One, attached: 269
- Two: 248
- 3 or 4: 326
- 5 to 9: 175
- 10 to 19: 103
- 20 to 49: 166
- 50 or more: 143
- Mobile homes: 601
Housing units in Miami County with a mortgage: 6,996 (776 second mortgage, 5 home equity loan, 552 both second mortgage and home equity loan)
Houses without a mortgage: 36
| Here: | 14.3% with mortgage |
| State: | 97.8% with mortgage |
Religion statistics for Miami County
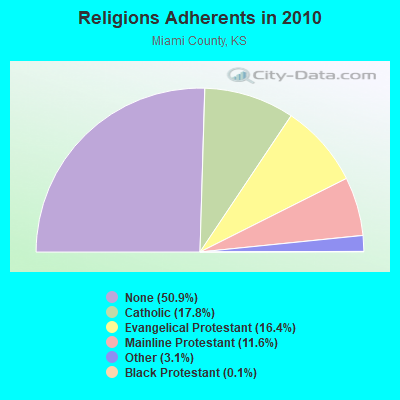
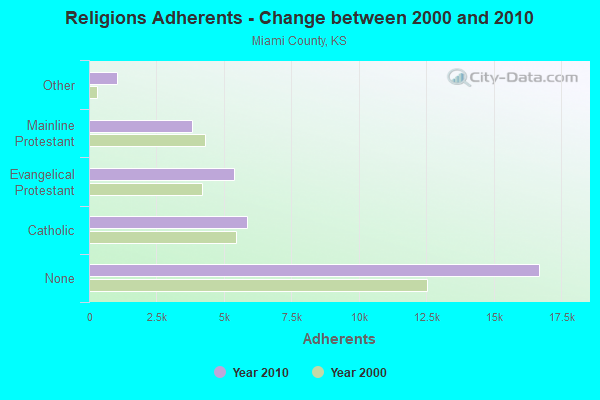
| Religion | Adherents | Congregations |
|---|---|---|
| Catholic | 5,850 | 4 |
| Evangelical Protestant | 5,378 | 33 |
| Mainline Protestant | 3,800 | 19 |
| Other | 1,028 | 5 |
| Black Protestant | 35 | 1 |
| None | 16,696 | - |
Source: Clifford Grammich, Kirk Hadaway, Richard Houseal, Dale E.Jones, Alexei Krindatch, Richie Stanley and Richard H.Taylor. 2012. 2010 U.S.Religion Census: Religious Congregations & Membership Study. Association of Statisticians of American Religious Bodies. Jones, Dale E., et al. 2002. Congregations and Membership in the United States 2000. Nashville, TN: Glenmary Research Center.
Food Environment Statistics:
| Miami County: | 1.29 / 10,000 pop. |
| State: | 1.96 / 10,000 pop. |
| Here: | 0.32 / 10,000 pop. |
| Kansas: | 0.20 / 10,000 pop. |
| This county: | 2.27 / 10,000 pop. |
| Kansas: | 0.51 / 10,000 pop. |
| Miami County: | 3.88 / 10,000 pop. |
| Kansas: | 3.84 / 10,000 pop. |
| This county: | 6.80 / 10,000 pop. |
| State: | 7.33 / 10,000 pop. |
| Miami County: | 8.2% |
| Kansas: | 8.1% |
| Miami County: | 29.1% |
| State: | 27.9% |
| Here: | 13.0% |
| State: | 13.4% |
Agriculture in Miami County:
Average size of farms: 225 acresAverage value of agricultural products sold per farm: $30,964
Average value of crops sold per acre for harvested cropland: $116.27
The value of nursery, greenhouse, floriculture, and sod as a percentage of the total market value of agricultural products sold: 7.43%
The value of livestock, poultry, and their products as a percentage of the total market value of agricultural products sold: 63.79%
Average total farm production expenses per farm: $30,491
Harvested cropland as a percentage of land in farms: 42.89%
Irrigated harvested cropland as a percentage of land in farms: 1.31%
Average market value of all machinery and equipment per farm: $49,158
The percentage of farms operated by a family or individual: 93.40%
Average age of principal farm operators: 56 years
Average number of cattle and calves per 100 acres of all land in farms: 17.43
Milk cows as a percentage of all cattle and calves: 1.18%
Corn for grain: 18873 harvested acres
All wheat for grain: 10247 harvested acres
Soybeans for beans: 45184 harvested acres
Vegetables: 100 harvested acres
Land in orchards: 246 acres
Earthquake activity:
Miami County-area historical earthquake activity is significantly above Kansas state average. It is 565% greater than the overall U.S. average.On 9/3/2016 at 12:02:44, a magnitude 5.8 (5.8 MW, Depth: 3.5 mi, Class: Moderate, Intensity: VI - VII) earthquake occurred 187.0 miles away from Miami County center
On 11/6/2011 at 03:53:10, a magnitude 5.7 (5.7 MW, Depth: 3.2 mi) earthquake occurred 235.1 miles away from the county center
On 11/12/2014 at 21:40:00, a magnitude 4.9 (4.9 MW, Depth: 2.5 mi, Class: Light, Intensity: IV - V) earthquake occurred 175.7 miles away from the county center
On 11/7/2016 at 01:44:24, a magnitude 5.0 (5.0 MW, Depth: 2.8 mi) earthquake occurred 208.1 miles away from the county center
On 2/13/2016 at 17:07:06, a magnitude 5.1 (5.1 MW, Depth: 5.2 mi) earthquake occurred 255.8 miles away from Miami County center
On 1/19/2020 at 19:08:42, a magnitude 4.5 (4.5 MW, Depth: 3.1 mi) earthquake occurred 173.6 miles away from the county center
Magnitude types: moment magnitude (MW)
Most recent natural disasters:
- Kansas Covid-19 Pandemic, Incident Period: January 20, 2020, FEMA Id: 4504, Natural disaster type: Other
- Kansas Severe Storms, Tornadoes, Straight-line Winds, and Flooding, Incident Period: May 04, 2015 to June 21, 2015, Major Disaster (Presidential) Declared DR-4230: July 20, 2015, FEMA Id: 4230, Natural disaster type: Storm, Tornado, Flood, Wind
- Kansas Severe Storms, Flooding, and Tornadoes, Incident Period: June 07, 2010 to July 21, 2010, Major Disaster (Presidential) Declared DR-1932: August 10, 2010, FEMA Id: 1932, Natural disaster type: Storm, Tornado, Flood
- Kansas Severe Winter Storms and Snowstorm, Incident Period: December 22, 2009 to January 08, 2010, Major Disaster (Presidential) Declared DR-1885: March 09, 2010, FEMA Id: 1885, Natural disaster type: Snowstorm, Winter Storm
- Kansas Severe Winter Storms, Incident Period: December 06, 2007 to December 19, 2007, Major Disaster (Presidential) Declared DR-1741: February 01, 2008, FEMA Id: 1741, Natural disaster type: Winter Storm
- Kansas Severe Winter Storms, Incident Period: December 06, 2007 to December 19, 2007, Emergency Declared EM-3282: December 12, 2007, FEMA Id: 3282, Natural disaster type: Winter Storm
- Kansas Severe Storms and Flooding, Incident Period: June 26, 2007 to July 25, 2007, Major Disaster (Presidential) Declared DR-1711: July 02, 2007, FEMA Id: 1711, Natural disaster type: Storm, Flood
- Kansas Hurricane Katrina Evacuation, Incident Period: September 01, 2005 to October 01, 2005, Emergency Declared EM-3236: September 10, 2005, FEMA Id: 3236, Natural disaster type: Hurricane
- Kansas Severe Storms, Tornadoes and Flooding, Incident Period: May 04, 2003 to May 30, 2003, Major Disaster (Presidential) Declared DR-1462: May 06, 2003, FEMA Id: 1462, Natural disaster type: Storm, Tornado, Flood
- Kansas Ice Storm, Incident Period: January 29, 2002 to February 15, 2002, Major Disaster (Presidential) Declared DR-1402: February 06, 2002, FEMA Id: 1402, Natural disaster type: Ice Storm
- 3 other natural disasters have been reported since 1953.
The number of natural disasters in Miami County (13) is near the US average (15).
Major Disasters (Presidential) Declared: 10
Emergencies Declared: 2
Causes of natural disasters: Floods: 7, Storms: 7, Tornadoes: 5, Winter Storms: 3, Hurricane: 1, Ice Storm: 1, Snowstorm: 1, Wind: 1, Other: 1 (Note: some incidents may be assigned to more than one category).
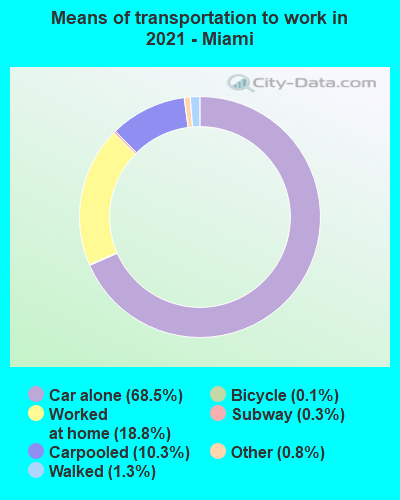
Means of transportation to work:
- Drove a car alone: 6,284 (65.3%)
- Carpooled: 933 (9.7%)
- Subway or elevated rail: 26 (0.3%)
- Taxicab, motorcycle, or other means: 61 (0.6%)
- Walked: 151 (1.6%)
- Worked at home: 2,461 (25.6%)
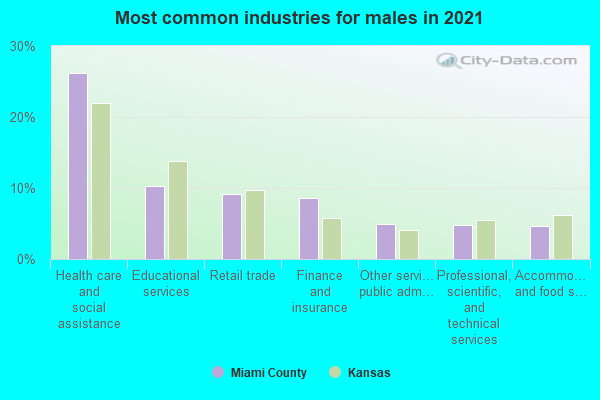
- Health care and social assistance (21%)
- Educational services (11%)
- Finance and insurance (10%)
- Retail trade (9%)
- Professional, scientific, and technical services (6%)
- Accommodation and food services (6%)
- Other services, except public administration (5%)
- Health care and social assistance (24%)
- Educational services (12%)
- Finance and insurance (12%)
- Retail trade (10%)
- Professional, scientific, and technical services (7%)
- Accommodation and food services (6%)
- Other services, except public administration (6%)
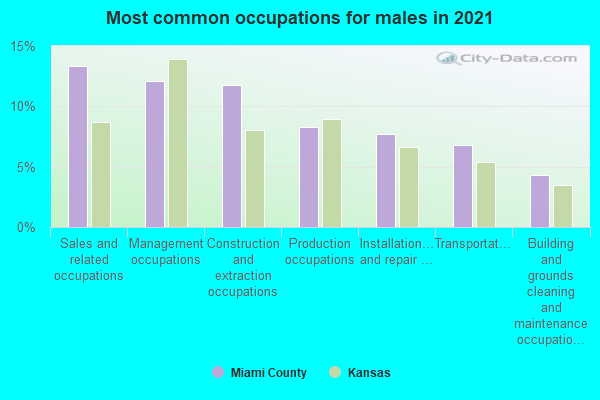
- Sales and related occupations (15%)
- Construction and extraction occupations (13%)
- Management occupations (12%)
- Production occupations (8%)
- Installation, maintenance, and repair occupations (6%)
- Transportation occupations (5%)
- Material moving occupations (5%)
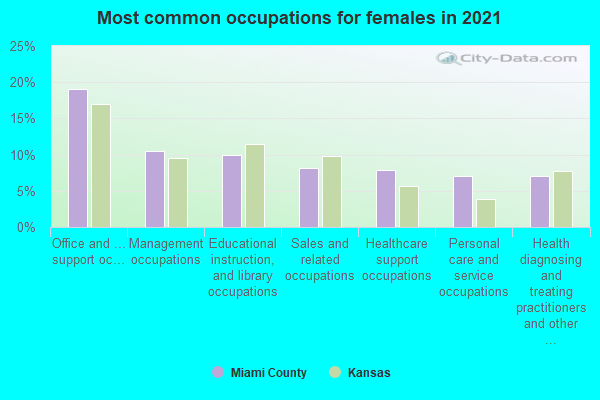
- Office and administrative support occupations (19%)
- Management occupations (11%)
- Educational instruction, and library occupations (9%)
- Sales and related occupations (8%)
- Personal care and service occupations (8%)
- Business and financial operations occupations (7%)
- Health diagnosing and treating practitioners and other technical occupations (7%)

- China, excluding Hong Kong and Taiwan (20%)
- Mexico (16%)
- Ukraine (11%)
- Iraq (11%)
- England (6%)
- Thailand (5%)
- United Kingdom, excluding England and Scotland (4%)

- German (27%)
- English (15%)
- Irish (13%)
- American (12%)
- European (4%)
- Croatian (2%)
- Polish (2%)
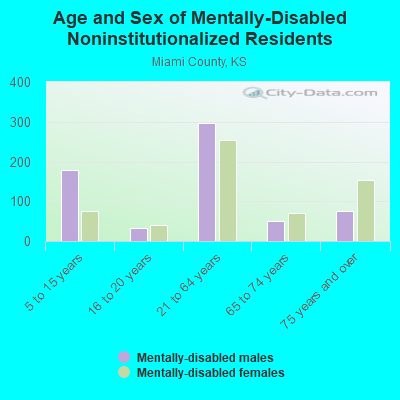
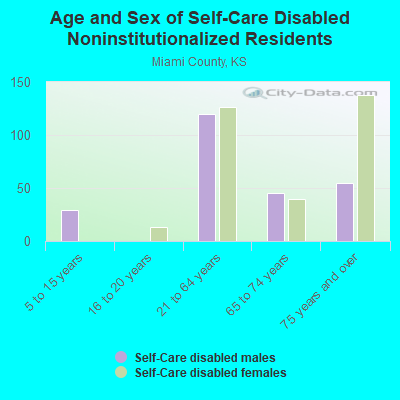
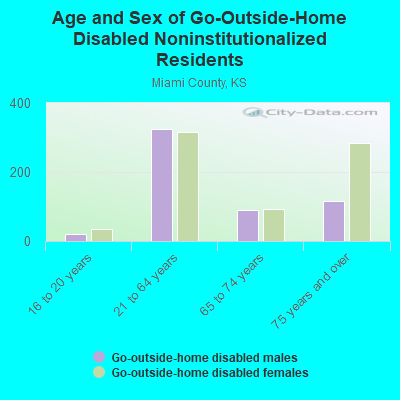
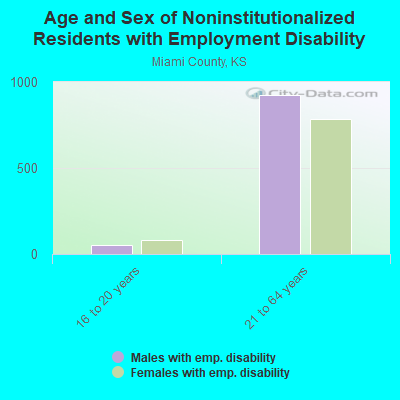
People in group quarters in Miami County, Kansas in 2010:
- 303 people in nursing facilities/skilled-nursing facilities
- 182 people in mental (psychiatric) hospitals and psychiatric units in other hospitals
- 58 people in residential treatment centers for juveniles (non-correctional)
- 48 people in group homes intended for adults
- 29 people in residential treatment centers for adults
- 21 people in emergency and transitional shelters (with sleeping facilities) for people experiencing homelessness
- 4 people in other noninstitutional facilities
People in group quarters in Miami County, Kansas in 2000:
- 263 people in nursing homes
- 176 people in mental (psychiatric) hospitals or wards
- 91 people in other nonhousehold living situations
- 76 people in state prisons
- 62 people in homes for abused, dependent, and neglected children
- 30 people in other group homes
- 29 people in local jails and other confinement facilities (including police lockups)
- 19 people in religious group quarters
8.48% of this county's 2021 resident taxpayers lived in other counties in 2020 ($70,692 average adjusted gross income)
| Here: | 8.48% |
| Kansas average: | 6.64% |
10 or fewer of this county's residents moved from foreign countries.
5.98% relocated from other counties in Kansas ($54,128 average AGI)
2.50% relocated from other states ($16,564 average AGI)
Miami County: 2.50% Kansas average: 3.37%
Top counties from which taxpayers relocated into this county between 2020 and 2021:
| from Johnson County, KS | |
| from Jackson County, MO | |
| from Franklin County, KS | |
| from Linn County, KS | |
| from Cass County, MO | |
| from Wyandotte County, KS | |
| from Douglas County, KS |
7.91% of this county's 2020 resident taxpayers moved to other counties in 2021 ($60,825 average adjusted gross income)
| Here: | 7.91% |
| Kansas average: | 6.88% |
10 or fewer of this county's residents moved to foreign countries.
5.42% relocated to other counties in Kansas ($38,655 average AGI)
2.49% relocated to other states ($22,169 average AGI)
Miami County: 2.49% Kansas average: 3.62%
Top counties to which taxpayers relocated from this county between 2020 and 2021:
| to Johnson County, KS | |
| to Franklin County, KS | |
| to Linn County, KS | |
| to Jackson County, MO | |
| to Douglas County, KS | |
| to Cass County, MO | |
| to Wyandotte County, KS |
Births per 1000 population from 1990 to 1999: 13.2
Births per 1000 population from 2000 to 2006: 13.5

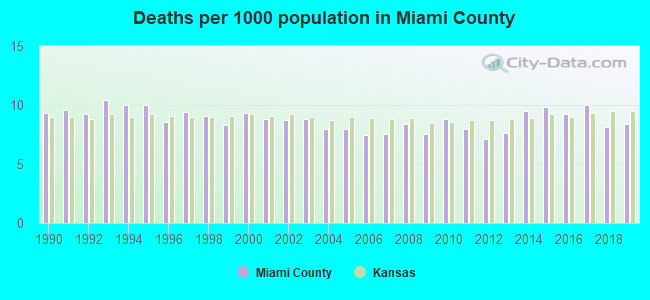
Deaths per 1000 population from 1990 to 1999: 9.4
Deaths per 1000 population from 2000 to 2009: 8.3
Deaths per 1000 population from 2010 to 2020: 8.8
Infant deaths per 1000 live births from 1990 to 1999: 6.6
Infant deaths per 1000 live births from 2000 to 2006: 6.1

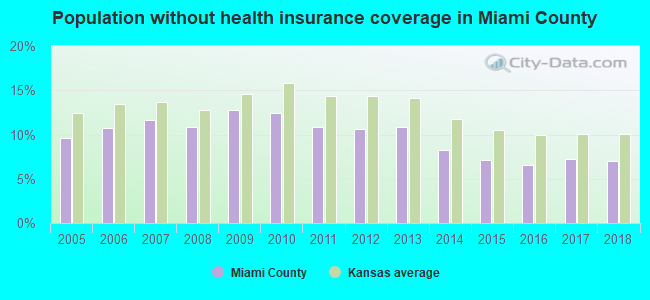
Persons under 19 years old without health insurance coverage in 2018: 3.9%

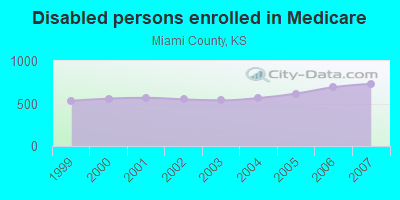
Persons enrolled in hospital insurance and/or supplemental medical insurance (Medicare) in July 1, 2007: 4,356 (3,624 aged, 732 disabled)
Children under 18 without health insurance coverage in 2007: 624 (8%)


Most common underlying causes of death in Miami County, Kansas in 1999 - 2019:
- Acute myocardial infarction, unspecified (448)
- Atherosclerotic heart disease (431)
- Bronchus or lung, unspecified - Malignant neoplasms (323)
- Chronic obstructive pulmonary disease, unspecified (292)
- Unspecified dementia (201)
- Congestive heart failure (90)
- Alzheimer disease, unspecified (73)
- Senility (34)
- Heart disease, unspecified (24)
- Pneumonia, unspecified (11)
Population without health insurance coverage in 2000: 8%
Children under 18 without health insurance coverage in 2000: 6%
Short term general hospital admissions per 100,000 population in 2004: 3,352
Short term general hospital beds per 100,000 population in 2004: 67
Emergency room visits per 100,000 population in 2004: 37,685
General practice office based MDs per 100,000 population in 2005: 1,269
Medical specialist MDs per 100,000 population in 2005: 800
Dentists per 100,000 population in 1998: 13
Total births per 100,000 population, July 2005 - July 2006 : 26
Total deaths per 100,000 population, July 2005 - July 2006: 92
Limited-service eating places per 100,000 population in 2005 : 7
Suicides per 1,000,000 population from 2000 to 2006: 181.3. This is more than state average.
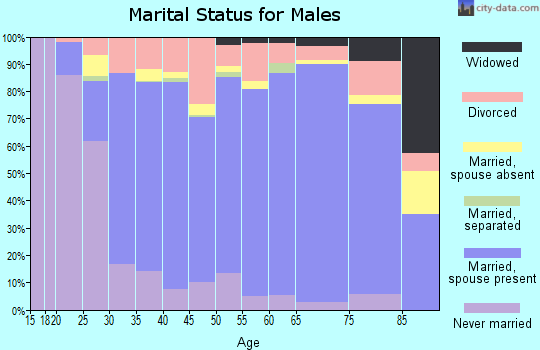
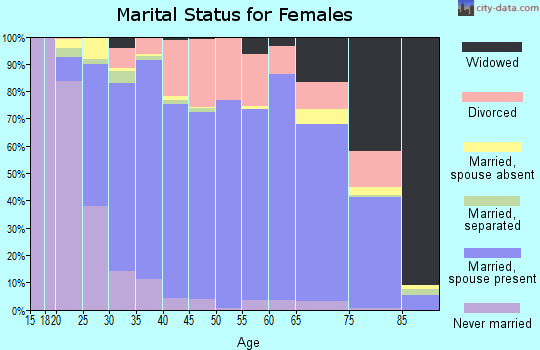
Household type by relationship:
Households: 34,326- Male householders: 7,100 (1,227 living alone), Female householders: 6,434 (1,903 living alone)
7,303 spouses (7,242 opposite-sex spouses), 968 unmarried partners, (968 opposite-sex unmarried partners), 9,808 children (9,177 natural, 286 adopted, 346 stepchildren), 685 grandchildren, 62 brothers or sisters, 333 parents, 0 foster children, 369 other relatives, 504 non-relatives
- In group quarters: 771
Size of family households: 5,018 2-persons, 1,600 3-persons, 1,680 4-persons, 743 5-persons, 439 6-persons, 133 7-or-more-persons.
Size of nonfamily households: 3,143 1-person, 700 2-persons, 60 3-persons.
5,658 married couples with children.
1,657 single-parent households (719 men, 938 women).
97.4% of residents of Miami speak English at home.
1.9% of residents speak Spanish at home (78% speak English very well, 9% speak English well, 13% speak English not well).
0.4% of residents speak other Indo-European language at home (73% speak English very well, 27% speak English well).
0.3% of residents speak Asian or Pacific Island language at home (46% speak English well, 54% speak English not well).
0.1% of residents speak other language at home (87% speak English very well, 13% speak English well).
In fiscal year 2004:
Federal Government expenditure: $162,387,000 ($5,465 per capita)
Department of Defense expenditure: $3,951,000
Federal direct payments to individuals for retirement and disability: $57,615,000
Federal other direct payments to individuals: $29,871,000
Federal direct payments not to individuals: $3,544,000
Federal grants: $64,453,000
Federal procurement contracts: $1,064,000 ($95,000 Department of Defense)
Federal salaries and wages: $5,841,000 ($1,769,000 Department of Defense)
Federal Government direct loans: $309,000
Federal guaranteed/insured loans: $17,380,000
Federal Government insurance: $9,448,000
Population change from April 1, 2000 to July 1, 2005:
Births: 2,107| Here: | 69 per 1000 residents |
| State: | 75 per 1000 residents |
Deaths: 1,340
| Here: | 44 per 1000 residents |
| State: | 47 per 1000 residents |
Net international migration: +39
| Here: | +1 per 1000 residents |
| State: | +14 per 1000 residents |
Net internal migration: +1,387
| Here: | |
| State: |
Total withdrawal of fresh water for public supply: 4.26 millions of gallons per day (all from surface)
| Here: | 6.5 |
| State: | 6.9 |
| Here: | 4.8 |
| State: | 4.4 |
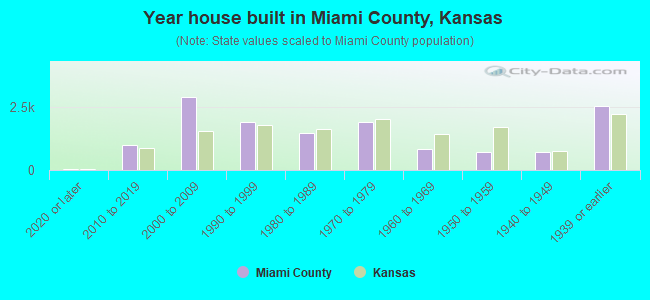
- Year house built in Miami County, Kansas
- 1262020 or later
- 9792010 to 2019
- 3,1402000 to 2009
- 1,9611990 to 1999
- 1,4091980 to 1989
- 1,8331970 to 1979
- 8331960 to 1969
- 7201950 to 1959
- 7561940 to 1949
- 2,2881939 or earlier

- Rooms in owner-occupied houses in Miami County, Kansas
- 381 room
- 102 rooms
- 2073 rooms
- 9204 rooms
- 1,8755 rooms
- 2,4456 rooms
- 2,0057 rooms
- 1,4988 rooms
- 1,8719+ rooms
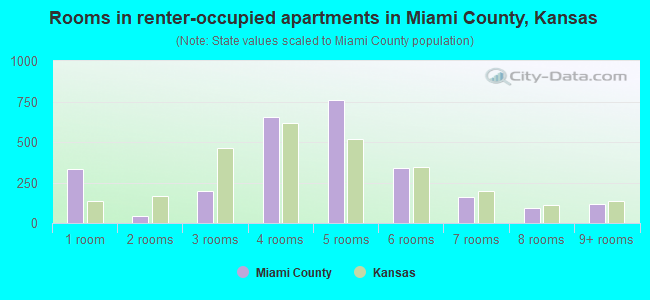
- Rooms in renter-occupied apartments in Miami County, Kansas
- 2741 room
- 232 rooms
- 1913 rooms
- 6524 rooms
- 7925 rooms
- 3496 rooms
- 2737 rooms
- 518 rooms
- 909+ rooms

- Bedrooms in owner-occupied houses in Miami County, Kansas
- 50no bedroom
- 1301 bedroom
- 1,7362 bedrooms
- 5,5513 bedrooms
- 2,7054 bedrooms
- 6995+ bedrooms
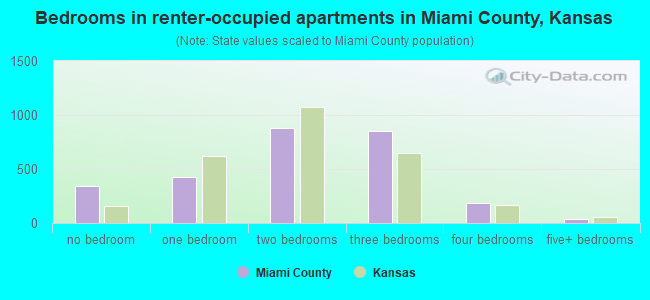
- Bedrooms in renter-occupied apartments in Miami County, Kansas
- 276no bedroom
- 3831 bedroom
- 8812 bedrooms
- 9763 bedrooms
- 1814 bedrooms
- 285+ bedrooms

- Cars and other vehicles available in Miami County in owner-occupied houses/condos
- 49no vehicle
- 2,0371 vehicle
- 4,1932 vehicles
- 2,6933 vehicles
- 1,2384 vehicles
- 6365+ vehicles

- Cars and other vehicles available in Miami County in renter-occupied apartments
- 336no vehicle
- 1,0001 vehicle
- 9612 vehicles
- 3293 vehicles
- 744 vehicles
- 185+ vehicles
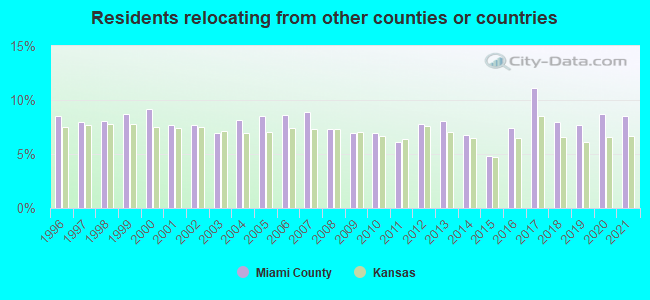
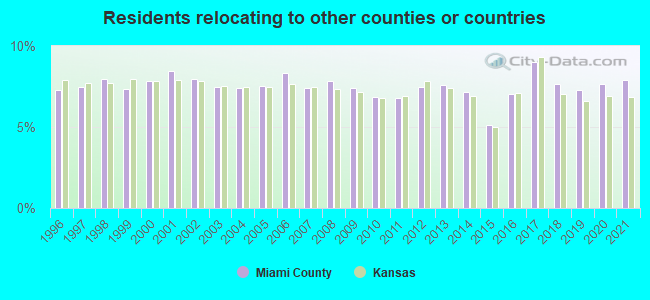
91.8% of Miami County residents lived in the same house 1 years ago.
Out of people who lived in different houses, 26% lived in this county.
Out of people who lived in different counties, 63% lived in Kansas.
| Miami County: | 91.8% |
| State average: | 85.3% |
Place of birth for U.S.-born residents:
- This state: 20,532
- Other state: 13,214
- Northeast: 723
- Midwest: 8,160
- South: 2,464
- West: 1,777
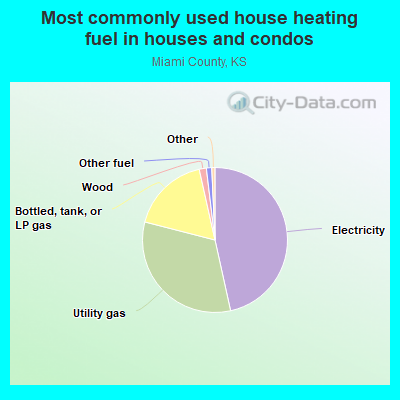
- 46.7%Electricity
- 33.3%Utility gas
- 16.7%Bottled, tank, or LP gas
- 1.4%Wood
- 1.0%Other fuel
- 0.4%Coal or coke
- 0.3%Solar energy
- 0.2%No fuel used
- 0.1%Fuel oil, kerosene, etc.
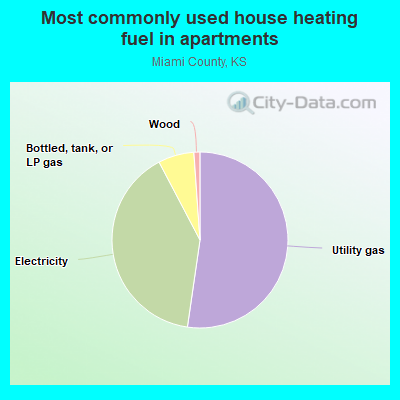
- 45.3%Electricity
- 43.8%Utility gas
- 8.8%Bottled, tank, or LP gas
- 2.1%Wood
Private vs. public school enrollment:
| Here: | 9.2% |
| Kansas: | 14.1% |
| Here: | 3.6% |
| Kansas: | 10.8% |
| Here: | 10.0% |
| Kansas: | 15.4% |
Miami County government finances - Expenditure in 2017:
- Bond Funds - Cash and Securities: $2,806,000
- Charges - Other: $1,222,000
Solid Waste Management: $111,000
Sewerage: $44,000
Regular Highways: $35,000
Air Transportation: $12,000
- Construction - General - Other: $3,637,000
Correctional Institutions: $1,195,000
Regular Highways: $589,000
- Current Operations - Regular Highways: $6,212,000
General - Other: $5,801,000
Health - Other: $2,785,000
Police Protection: $2,660,000
Correctional Institutions: $1,545,000
Financial Administration: $1,267,000
Central Staff Services: $1,150,000
Corrections - Other: $852,000
Judicial and Legal Services: $732,000
Local Fire Protection: $561,000
Protective Inspection and Regulation - Other: $305,000
General Public Buildings: $277,000
Natural Resources - Other: $211,000
Air Transportation: $135,000
Sewerage: $68,000
Solid Waste Management: $32,000
- General - Interest on Debt: $677,000
- Intergovernmental to Local - Other - General - Other: $1,327,000
- Long Term Debt - Beginning Outstanding - Unspecified Public Purpose: $23,124,000
Outstanding Unspecified Public Purpose: $21,576,000
Retired Unspecified Public Purpose: $3,898,000
Issue, Unspecified Public Purpose: $2,350,000
- Miscellaneous - General Revenue - Other: $1,116,000
Interest Earnings: $175,000
Special Assessments: $52,000
Rents: $20,000
Fines and Forfeits: $2,000
- Other Capital Outlay - General - Other: $488,000
Local Fire Protection: $117,000
- Other Funds - Cash and Securities: $9,768,000
- Sinking Funds - Cash and Securities: $499,000
- State Intergovernmental - Highways: $1,409,000
Other: $1,255,000
General Local Government Support: $59,000
- Tax - Property: $19,678,000
General Sales and Gross Receipts: $5,203,000
Other License: $1,196,000
Motor Vehicle License: $356,000
Public Utilities Sales: $227,000
Miami County government finances - Revenue in 2017:
- Bond Funds - Cash and Securities: $2,806,000
- Charges - Other: $1,222,000
Solid Waste Management: $111,000
Sewerage: $44,000
Regular Highways: $35,000
Air Transportation: $12,000
- Construction - General - Other: $3,637,000
Correctional Institutions: $1,195,000
Regular Highways: $589,000
- Current Operations - Regular Highways: $6,212,000
General - Other: $5,801,000
Health - Other: $2,785,000
Police Protection: $2,660,000
Correctional Institutions: $1,545,000
Financial Administration: $1,267,000
Central Staff Services: $1,150,000
Corrections - Other: $852,000
Judicial and Legal Services: $732,000
Local Fire Protection: $561,000
Protective Inspection and Regulation - Other: $305,000
General Public Buildings: $277,000
Natural Resources - Other: $211,000
Air Transportation: $135,000
Sewerage: $68,000
Solid Waste Management: $32,000
- General - Interest on Debt: $677,000
- Intergovernmental to Local - Other - General - Other: $1,327,000
- Long Term Debt - Beginning Outstanding - Unspecified Public Purpose: $23,124,000
Outstanding Unspecified Public Purpose: $21,576,000
Retired Unspecified Public Purpose: $3,898,000
Issue, Unspecified Public Purpose: $2,350,000
- Miscellaneous - General Revenue - Other: $1,116,000
Interest Earnings: $175,000
Special Assessments: $52,000
Rents: $20,000
Fines and Forfeits: $2,000
- Other Capital Outlay - General - Other: $488,000
Local Fire Protection: $117,000
- Other Funds - Cash and Securities: $9,768,000
- Sinking Funds - Cash and Securities: $499,000
- State Intergovernmental - Highways: $1,409,000
Other: $1,255,000
General Local Government Support: $59,000
- Tax - Property: $19,678,000
General Sales and Gross Receipts: $5,203,000
Other License: $1,196,000
Motor Vehicle License: $356,000
Public Utilities Sales: $227,000
Miami County government finances - Debt in 2017:
- Bond Funds - Cash and Securities: $2,806,000
- Charges - Other: $1,222,000
Solid Waste Management: $111,000
Sewerage: $44,000
Regular Highways: $35,000
Air Transportation: $12,000
- Construction - General - Other: $3,637,000
Correctional Institutions: $1,195,000
Regular Highways: $589,000
- Current Operations - Regular Highways: $6,212,000
General - Other: $5,801,000
Health - Other: $2,785,000
Police Protection: $2,660,000
Correctional Institutions: $1,545,000
Financial Administration: $1,267,000
Central Staff Services: $1,150,000
Corrections - Other: $852,000
Judicial and Legal Services: $732,000
Local Fire Protection: $561,000
Protective Inspection and Regulation - Other: $305,000
General Public Buildings: $277,000
Natural Resources - Other: $211,000
Air Transportation: $135,000
Sewerage: $68,000
Solid Waste Management: $32,000
- General - Interest on Debt: $677,000
- Intergovernmental to Local - Other - General - Other: $1,327,000
- Long Term Debt - Beginning Outstanding - Unspecified Public Purpose: $23,124,000
Outstanding Unspecified Public Purpose: $21,576,000
Retired Unspecified Public Purpose: $3,898,000
Issue, Unspecified Public Purpose: $2,350,000
- Miscellaneous - General Revenue - Other: $1,116,000
Interest Earnings: $175,000
Special Assessments: $52,000
Rents: $20,000
Fines and Forfeits: $2,000
- Other Capital Outlay - General - Other: $488,000
Local Fire Protection: $117,000
- Other Funds - Cash and Securities: $9,768,000
- Sinking Funds - Cash and Securities: $499,000
- State Intergovernmental - Highways: $1,409,000
Other: $1,255,000
General Local Government Support: $59,000
- Tax - Property: $19,678,000
General Sales and Gross Receipts: $5,203,000
Other License: $1,196,000
Motor Vehicle License: $356,000
Public Utilities Sales: $227,000
Miami County government finances - Cash and Securities in 2017:
- Bond Funds - Cash and Securities: $2,806,000
- Charges - Other: $1,222,000
Solid Waste Management: $111,000
Sewerage: $44,000
Regular Highways: $35,000
Air Transportation: $12,000
- Construction - General - Other: $3,637,000
Correctional Institutions: $1,195,000
Regular Highways: $589,000
- Current Operations - Regular Highways: $6,212,000
General - Other: $5,801,000
Health - Other: $2,785,000
Police Protection: $2,660,000
Correctional Institutions: $1,545,000
Financial Administration: $1,267,000
Central Staff Services: $1,150,000
Corrections - Other: $852,000
Judicial and Legal Services: $732,000
Local Fire Protection: $561,000
Protective Inspection and Regulation - Other: $305,000
General Public Buildings: $277,000
Natural Resources - Other: $211,000
Air Transportation: $135,000
Sewerage: $68,000
Solid Waste Management: $32,000
- General - Interest on Debt: $677,000
- Intergovernmental to Local - Other - General - Other: $1,327,000
- Long Term Debt - Beginning Outstanding - Unspecified Public Purpose: $23,124,000
Outstanding Unspecified Public Purpose: $21,576,000
Retired Unspecified Public Purpose: $3,898,000
Issue, Unspecified Public Purpose: $2,350,000
- Miscellaneous - General Revenue - Other: $1,116,000
Interest Earnings: $175,000
Special Assessments: $52,000
Rents: $20,000
Fines and Forfeits: $2,000
- Other Capital Outlay - General - Other: $488,000
Local Fire Protection: $117,000
- Other Funds - Cash and Securities: $9,768,000
- Sinking Funds - Cash and Securities: $499,000
- State Intergovernmental - Highways: $1,409,000
Other: $1,255,000
General Local Government Support: $59,000
- Tax - Property: $19,678,000
General Sales and Gross Receipts: $5,203,000
Other License: $1,196,000
Motor Vehicle License: $356,000
Public Utilities Sales: $227,000
Supplemental Security Income (SSI) in 2006:
- Total number of recipients: 422
- Number of aged recipients: 19
- Number of blind and disabled recipients: 403
- Number of recipients under 18: 64
- Number of recipients between 18 and 64: 311
- Number of recipients older than 64: 47
- Number of recipients also receiving OASDI: 154
- Amount of payments (thousands of dollars): 199
| Most common first names in Miami County, KS among deceased individuals | ||
| Name | Count | Lived (average) |
|---|---|---|
| John | 168 | 76.0 years |
| William | 149 | 77.0 years |
| Mary | 138 | 81.7 years |
| Charles | 118 | 76.0 years |
| George | 116 | 77.8 years |
| James | 98 | 72.4 years |
| Robert | 91 | 70.4 years |
| Helen | 80 | 81.6 years |
| Frank | 62 | 79.4 years |
| Margaret | 60 | 79.8 years |
| Most common last names in Miami County, KS among deceased individuals | ||
| Last name | Count | Lived (average) |
|---|---|---|
| Smith | 102 | 77.6 years |
| Miller | 66 | 77.8 years |
| Johnson | 43 | 78.3 years |
| Williams | 43 | 72.9 years |
| Wilson | 42 | 80.5 years |
| Weaver | 33 | 83.2 years |
| Davis | 30 | 72.9 years |
| White | 29 | 75.4 years |
| Brown | 28 | 77.2 years |
| Phillips | 25 | 77.3 years |
| Businesses in Miami County, KS | ||||
| Name | Count | Name | Count | |
|---|---|---|---|---|
| Alco Stores | 1 | Pizza Hut | 3 | |
| Applebee's | 1 | RadioShack | 1 | |
| Arby's | 1 | SONIC Drive-In | 3 | |
| Blockbuster | 1 | Subway | 2 | |
| Burger King | 2 | T-Mobile | 1 | |
| Chevrolet | 1 | Taco Bell | 1 | |
| Dairy Queen | 1 | The Room Place | 1 | |
| FedEx | 3 | True Value | 1 | |
| Ford | 1 | U-Haul | 1 | |
| H&R Block | 3 | UPS | 5 | |
| KFC | 1 | Walmart | 1 | |
| McDonald's | 2 | YMCA | 1 | |