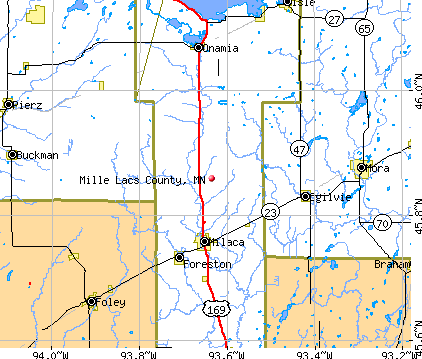
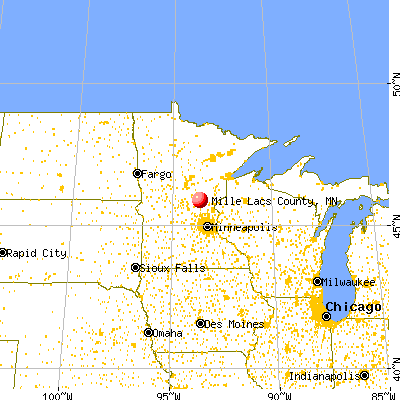
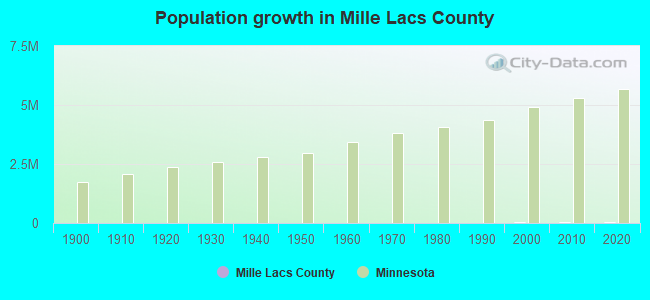
Mille Lacs County, Minnesota (MN)
County owner-occupied free and clear houses and condos in 2010: 2,415
County owner-occupied houses and condos in 2000: 6,896
Renter-occupied apartments: 2,428 (it was 1,742 in 2000)
| % of renters here: | 20% |
| State: | 27% |
Land area: 574 sq. mi.
Water area: 107.3 sq. mi.
Population density: 47 people per square mile (average).
Industries providing employment: Educational, health and social services (21.8%), Manufacturing (16.6%), Construction (11.8%), Retail trade (11.5%).
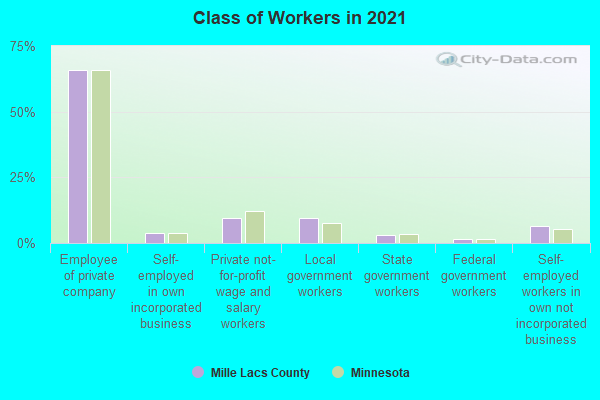
Type of workers:
- Private wage or salary: 79%
- Government: 14%
- Self-employed, not incorporated: 6%
- Unpaid family work: 0%
- OSM Map
- General Map
- Google Map
- MSN Map

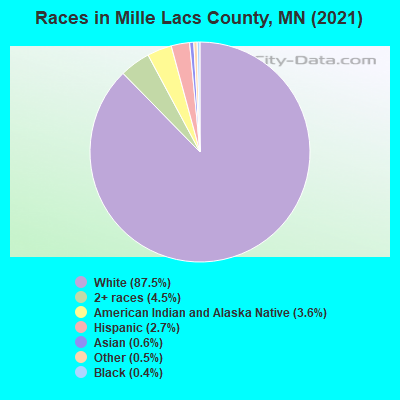
- 23,17287.4%White Non-Hispanic Alone
- 1,1304.3%American Indian and Alaska Native alone
- 1,0904.1%Two or more races
- 7222.7%Hispanic or Latino
- 1650.6%Asian alone
- 1130.4%Black Non-Hispanic Alone
- 1000.4%Some other race alone
- 300.1%Native Hawaiian and Other
Pacific Islander alone
| Median resident age: | 41.3 years |
| Minnesota median age: | 39.0 years |
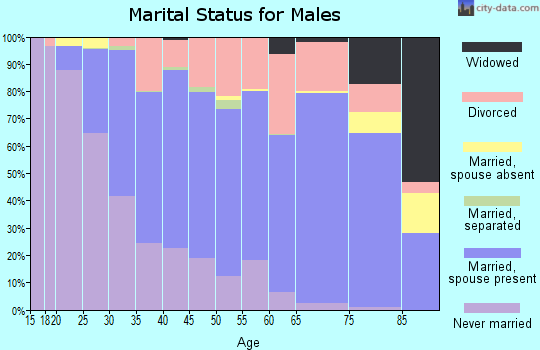
| Males: 13,663 | |
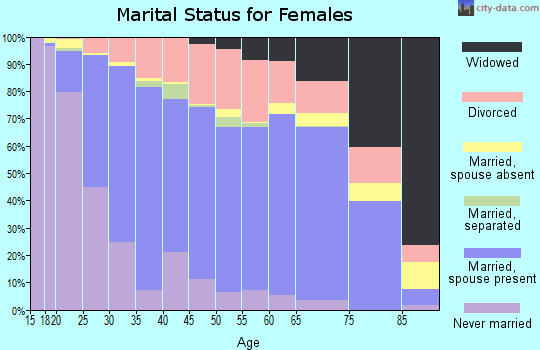
| Females: 13,119 |


| Mille Lacs County: | 2.0 people |
| Minnesota: | 2 people |
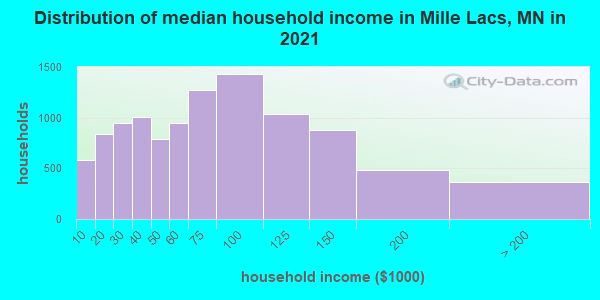
Estimated median household income in 2022: $66,493 ($36,977 in 1999)
| This county: | $66,493 |
| Minnesota: | $82,338 |
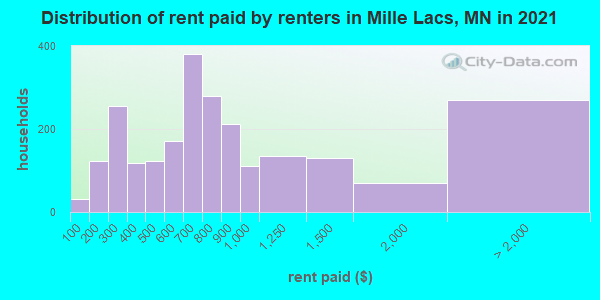
Median contract rent in 2022 for apartments: $762 (lower quartile is $507, upper quartile is $965)
| This county: | $762 |
| State: | $1087 |
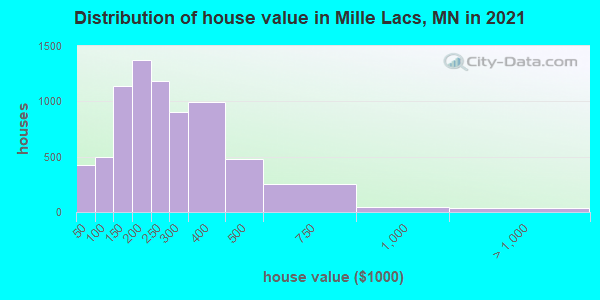
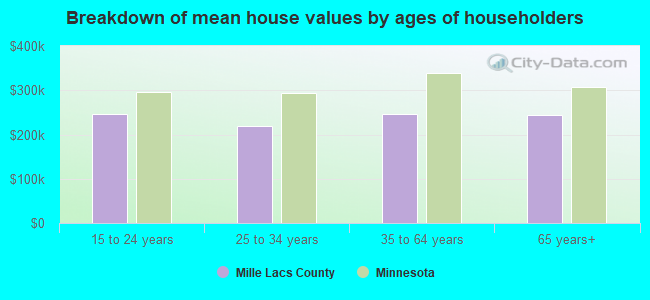
Estimated median house or condo value in 2022: $242,751 (it was $94,000 in 2000)
| Mille Lacs: | $242,751 |
| Minnesota: | $314,600 |
Median monthly housing costs for homes and condos with a mortgage: $1,537
Median monthly housing costs for units without a mortgage: $577
Institutionalized population: 474
Crime in 2021 (reported by the sheriff's office or county police, not the county total):
- Murders: 0
- Rapes: 5
- Robberies: 0
- Assaults: 42
- Burglaries: 61
- Thefts: 188
- Auto thefts: 39
Crime in 2020 (reported by the sheriff's office or county police, not the county total):
- Murders: 1
- Rapes: 3
- Robberies: 3
- Assaults: 23
- Burglaries: 72
- Thefts: 169
- Auto thefts: 37
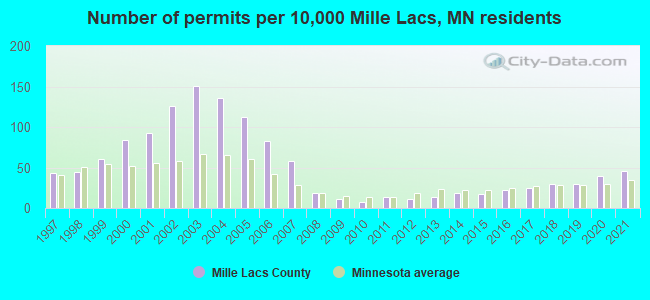
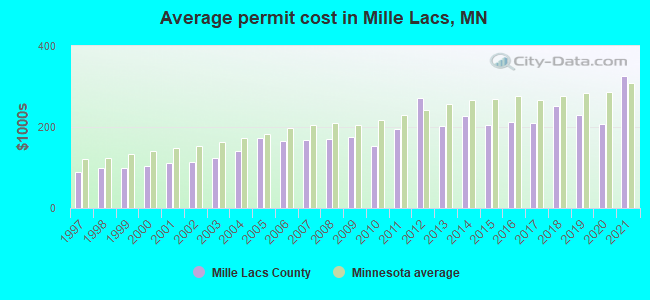
Single-family new house construction building permits:
- 2022: 66 buildings, average cost: $255,700
- 2021: 102 buildings, average cost: $325,600
- 2020: 90 buildings, average cost: $207,100
- 2019: 67 buildings, average cost: $229,100
- 2018: 67 buildings, average cost: $252,600
- 2017: 56 buildings, average cost: $211,000
- 2016: 50 buildings, average cost: $211,900
- 2015: 38 buildings, average cost: $205,000
- 2014: 42 buildings, average cost: $226,200
- 2013: 30 buildings, average cost: $202,400
- 2012: 25 buildings, average cost: $271,400
- 2011: 30 buildings, average cost: $194,700
- 2010: 18 buildings, average cost: $151,500
- 2009: 24 buildings, average cost: $174,800
- 2008: 43 buildings, average cost: $170,500
- 2007: 129 buildings, average cost: $168,600
- 2006: 186 buildings, average cost: $165,300
- 2005: 250 buildings, average cost: $173,500
- 2004: 303 buildings, average cost: $139,700
- 2003: 337 buildings, average cost: $123,600
- 2002: 282 buildings, average cost: $113,800
- 2001: 208 buildings, average cost: $110,400
- 2000: 187 buildings, average cost: $103,800
- 1999: 135 buildings, average cost: $98,400
- 1998: 101 buildings, average cost: $98,200
- 1997: 96 buildings, average cost: $89,500
Median real estate property taxes paid for housing units with mortgages in 2022: $2,445 (1.0%)
Median real estate property taxes paid for housing units with no mortgage in 2022: $2,298 (1.0%)
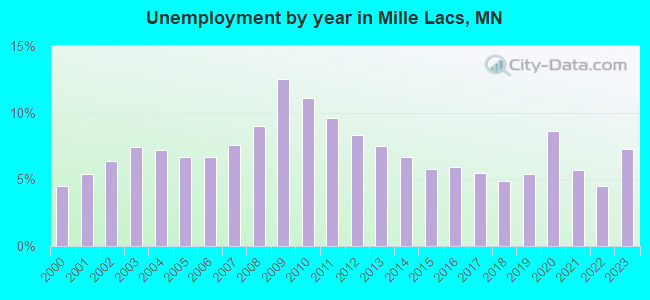
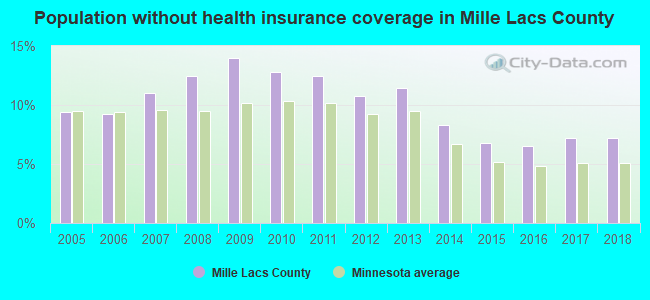
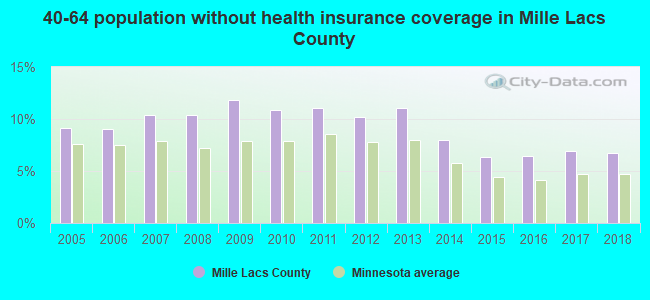
| Mille Lacs County: | 11.4% |
| Minnesota: | 9.6% |
Median age of residents in 2022: 41.3 years old
(Males: 40.5 years old, Females: 42.0 years old)
(Median age for: White residents: 43.5 years old, Black residents: 31.5 years old, American Indian residents: 26.3 years old, Asian residents: 41.4 years old, Hispanic or Latino residents: 23.8 years old, Other race residents: 23.6 years old)
Fair market rent in 2006 for a 1-bedroom apartment in Mille Lacs County is $435 a month.
Fair market rent for a 2-bedroom apartment is $573 a month.
Fair market rent for a 3-bedroom apartment is $710 a month.
Cities in this county include: Princeton, Milaca, Onamia, Isle, Vineland, Foreston, Wahkon, Pease, Bock.
2023 air pollution in Mille Lacs County:
Ozone (1-hour): 0.043 ppm (standard limit: 0.12 ppm). Above U.S. average.
Neighboring counties: Broadwater County, Montana  , Jefferson County, Montana , Musselshell County, Montana .
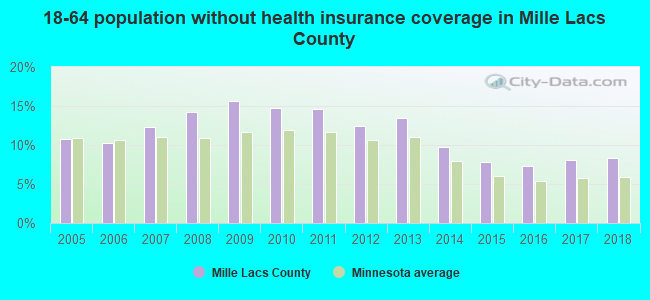
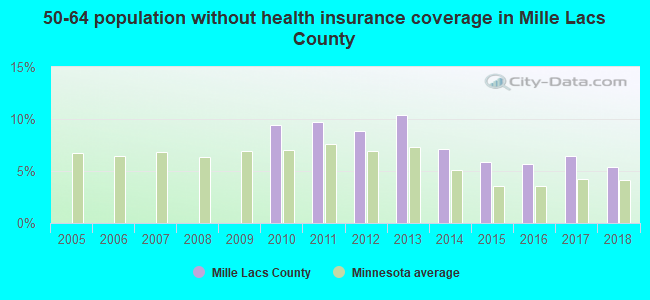
| Here: | 5.5% |
| Minnesota: | 2.6% |
Current college students: 536
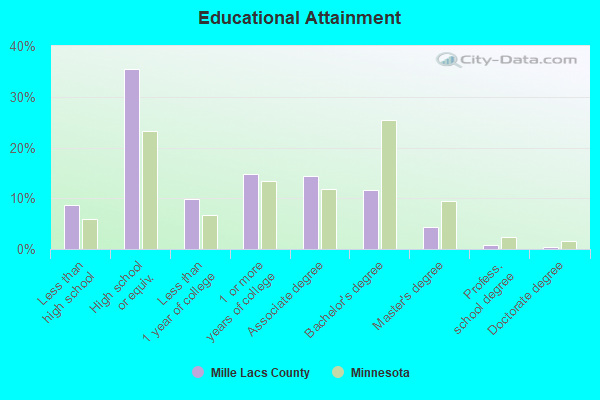
People 25 years of age or older with a high school degree or higher: 90.6%
People 25 years of age or older with a bachelor's degree or higher: 16.7%
Number of foreign born residents: 344 (54.1% naturalized citizens)
| Mille Lacs County: | 1.3% |
| Whole state: | 8.7% |
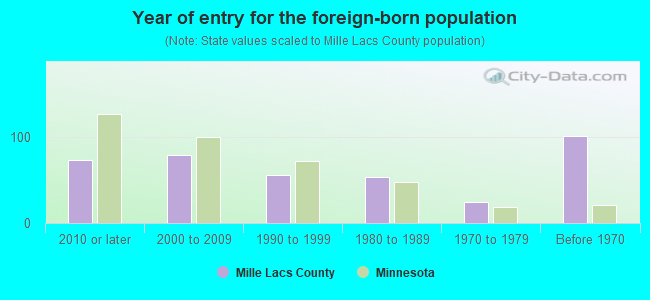
- Year of entry for the foreign-born population
- 432010 or later
- 1102000 to 2009
- 381990 to 1999
- 531980 to 1989
- 241970 to 1979
- 101Before 1970
Mean travel time to work (commute): minutes
Percentage of county residents living and working in this county: 98.7%
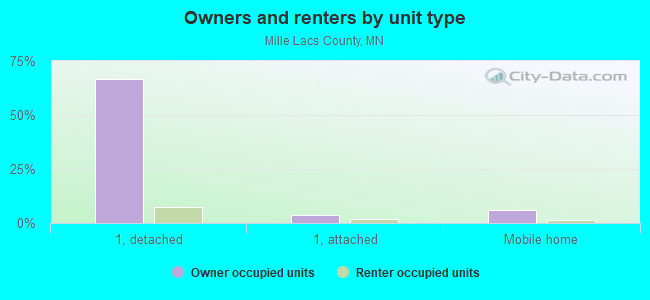
Housing units in structures:
- One, detached: 9,454
- One, attached: 755
- Two: 99
- 3 or 4: 152
- 5 to 9: 219
- 10 to 19: 259
- 20 to 49: 632
- 50 or more: 170
- Mobile homes: 1,289
- Boats, RVs, vans, etc.: 3
Housing units in Mille Lacs County with a mortgage: 5,249 (521 second mortgage, 5 home equity loan, 320 both second mortgage and home equity loan)
Houses without a mortgage: 71
| Here: | 6.6% with mortgage |
| State: | 97.6% with mortgage |
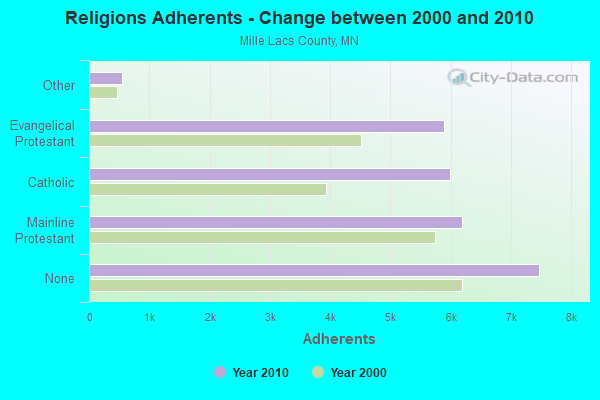
Religion statistics for Mille Lacs County

| Religion | Adherents | Congregations |
|---|---|---|
| Mainline Protestant | 6,192 | 15 |
| Catholic | 5,987 | 6 |
| Evangelical Protestant | 5,890 | 24 |
| Other | 555 | 3 |
| None | 7,473 | - |
Source: Clifford Grammich, Kirk Hadaway, Richard Houseal, Dale E.Jones, Alexei Krindatch, Richie Stanley and Richard H.Taylor. 2012. 2010 U.S.Religion Census: Religious Congregations & Membership Study. Association of Statisticians of American Religious Bodies. Jones, Dale E., et al. 2002. Congregations and Membership in the United States 2000. Nashville, TN: Glenmary Research Center.
Food Environment Statistics:
| Mille Lacs County: | 2.67 / 10,000 pop. |
| State: | 1.83 / 10,000 pop. |
| Mille Lacs County: | 8.00 / 10,000 pop. |
| Minnesota: | 3.90 / 10,000 pop. |
| This county: | 10.28 / 10,000 pop. |
| State: | 6.98 / 10,000 pop. |
| Mille Lacs County: | 7.1% |
| Minnesota: | 6.5% |
| Mille Lacs County: | 25.7% |
| State: | 25.9% |
| Here: | 13.5% |
| State: | 13.0% |
Agriculture in Mille Lacs County:
Average size of farms: 156 acresAverage value of agricultural products sold per farm: $26,581
Average value of crops sold per acre for harvested cropland: $126.48
The value of livestock, poultry, and their products as a percentage of the total market value of agricultural products sold: 63.43%
Average total farm production expenses per farm: $20,428
Harvested cropland as a percentage of land in farms: 49.18%
Average market value of all machinery and equipment per farm: $47,324
The percentage of farms operated by a family or individual: 95.63%
Average age of principal farm operators: 53 years
Average number of cattle and calves per 100 acres of all land in farms: 13.37
Milk cows as a percentage of all cattle and calves: 20.50%
Corn for grain: 17445 harvested acres
All wheat for grain: 310 harvested acres
Soybeans for beans: 11939 harvested acres
Vegetables: 127 harvested acres
Land in orchards: 44 acres
Earthquake activity:
Mille Lacs County-area historical earthquake activity is significantly above Minnesota state average. It is 52% smaller than the overall U.S. average.On 7/9/1975 at 14:54:15, a magnitude 4.6 (4.6 MB, Class: Light, Intensity: IV - V) earthquake occurred 116.7 miles away from Mille Lacs County center
On 6/5/1993 at 01:24:53, a magnitude 4.1 (4.1 LG, Depth: 6.2 mi) earthquake occurred 128.8 miles away from the county center
On 3/4/1983 at 06:32:18, a magnitude 4.6 (4.4 MB, 4.6 LG, 4.4 ML) earthquake occurred 304.1 miles away from the county center
On 10/20/1995 at 15:57:18, a magnitude 3.7 (3.7 LG, Depth: 3.1 mi, Class: Light, Intensity: II - III) earthquake occurred 155.6 miles away from the county center
On 2/7/2020 at 18:30:28, a magnitude 3.3 (3.3 ML) earthquake occurred 120.1 miles away from Mille Lacs County center
On 1/9/2020 at 18:16:48, a magnitude 3.3 (3.3 MB) earthquake occurred 125.4 miles away from the county center
Magnitude types: regional Lg-wave magnitude (LG), body-wave magnitude (MB), local magnitude (ML)
Most recent natural disasters:
- Minnesota Covid-19 Pandemic, Incident Period: January 20, 2020, FEMA Id: 4531, Natural disaster type: Other
- Minnesota Severe Storms, Flooding, and Tornadoes, Incident Period: July 01, 2011 to July 11, 2011, Major Disaster (Presidential) Declared DR-4009: July 28, 2011, FEMA Id: 4009, Natural disaster type: Storm, Tornado, Flood
- Minnesota Hurricane Katrina Evacuation, Incident Period: August 29, 2005 to October 01, 2005, Emergency Declared EM-3242: September 13, 2005, FEMA Id: 3242, Natural disaster type: Hurricane
- Minnesota Flooding, Incident Period: March 23, 2001 to July 03, 2001, Major Disaster (Presidential) Declared DR-1370: May 16, 2001, FEMA Id: 1370, Natural disaster type: Flood
- Minnesota Drought, Incident Period: June 17, 1976, Emergency Declared EM-3013: June 17, 1976, FEMA Id: 3013, Natural disaster type: Drought
- Minnesota SEVERE STORMS, FLOODING, Incident Period: August 01, 1972, Major Disaster (Presidential) Declared DR-347: August 01, 1972, FEMA Id: 347, Natural disaster type: Storm, Flood
- Minnesota FLOODING, Incident Period: April 18, 1969, Major Disaster (Presidential) Declared DR-255: April 18, 1969, FEMA Id: 255, Natural disaster type: Flood
- Minnesota FLOODING, Incident Period: April 11, 1965, Major Disaster (Presidential) Declared DR-188: April 11, 1965, FEMA Id: 188, Natural disaster type: Flood
The number of natural disasters in Mille Lacs County (8) is smaller than the US average (15).
Major Disasters (Presidential) Declared: 5
Emergencies Declared: 2
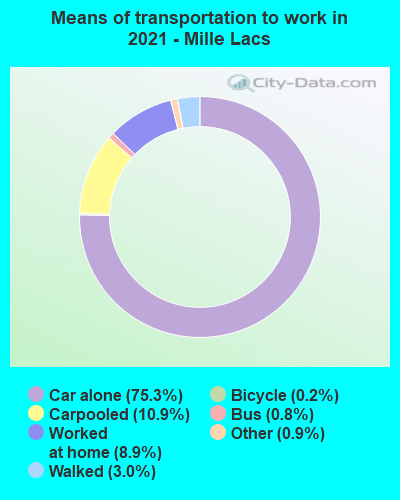
Means of transportation to work:
- Drove a car alone: 7,396 (70.1%)
- Carpooled: 1,239 (11.7%)
- Bus: 71 (0.7%)
- Ferryboat: 2 (0.0%)
- Taxicab, motorcycle, or other means: 126 (1.2%)
- Bicycle: 4 (0.0%)
- Walked: 236 (2.2%)
- Worked at home: 1,433 (13.6%)
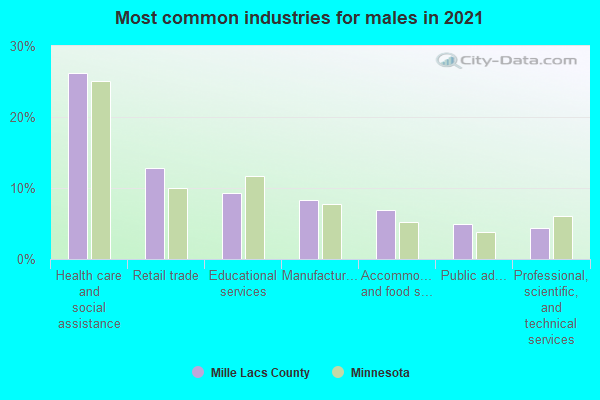
- Health care and social assistance (23%)
- Retail trade (11%)
- Educational services (10%)
- Manufacturing (8%)
- Accommodation and food services (8%)
- Public administration (5%)
- Professional, scientific, and technical services (5%)
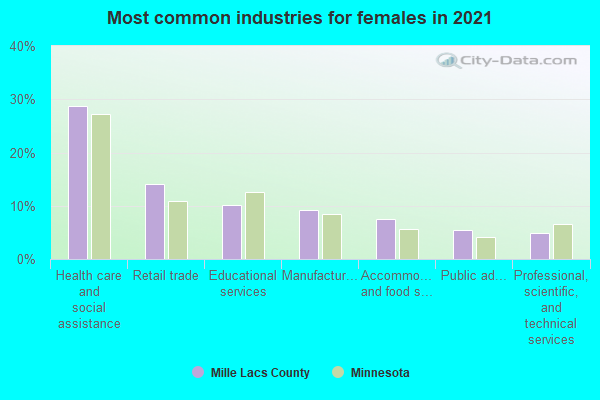
- Health care and social assistance (26%)
- Retail trade (12%)
- Educational services (11%)
- Manufacturing (9%)
- Accommodation and food services (9%)
- Public administration (6%)
- Professional, scientific, and technical services (5%)
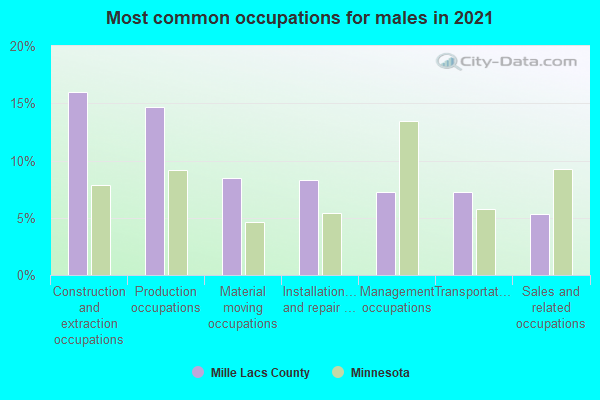
- Construction and extraction occupations (16%)
- Production occupations (15%)
- Material moving occupations (9%)
- Transportation occupations (8%)
- Management occupations (8%)
- Installation, maintenance, and repair occupations (8%)
- Sales and related occupations (7%)
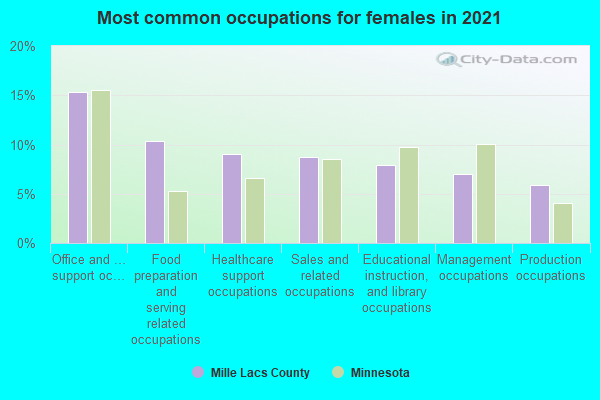
- Office and administrative support occupations (15%)
- Food preparation and serving related occupations (11%)
- Sales and related occupations (9%)
- Management occupations (9%)
- Healthcare support occupations (8%)
- Educational instruction, and library occupations (8%)
- Production occupations (6%)
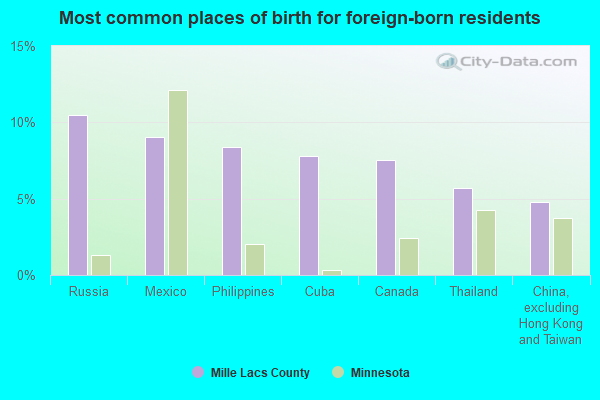
- Russia (10%)
- Mexico (10%)
- Laos (9%)
- India (9%)
- Ukraine (7%)
- Marshall Islands (7%)
- Cambodia (5%)
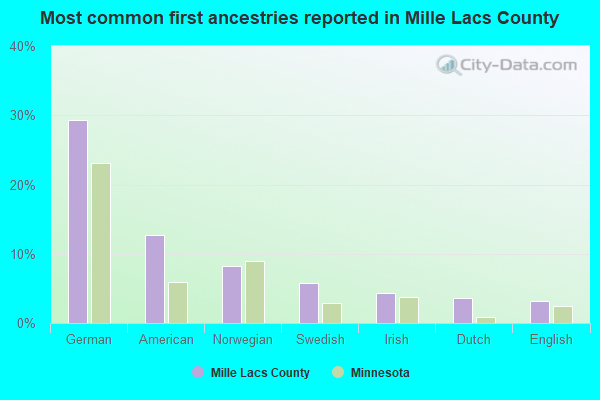
- German (27%)
- American (16%)
- Norwegian (8%)
- Swedish (6%)
- Irish (4%)
- Dutch (3%)
- English (3%)
People in group quarters in Mille Lacs County, Minnesota in 2010:
- 287 people in nursing facilities/skilled-nursing facilities
- 89 people in residential treatment centers for juveniles (non-correctional)
- 74 people in local jails and other municipal confinement facilities
- 45 people in group homes intended for adults
- 13 people in correctional facilities intended for juveniles
- 9 people in group homes for juveniles (non-correctional)
- 4 people in residential treatment centers for adults
- 2 people in mental (psychiatric) hospitals and psychiatric units in other hospitals
People in group quarters in Mille Lacs County, Minnesota in 2000:
- 319 people in nursing homes
- 76 people in halfway houses
- 62 people in local jails and other confinement facilities (including police lockups)
- 32 people in homes for the mentally ill
- 14 people in religious group quarters
- 8 people in other group homes
- 4 people in homes or halfway houses for drug/alcohol abuse
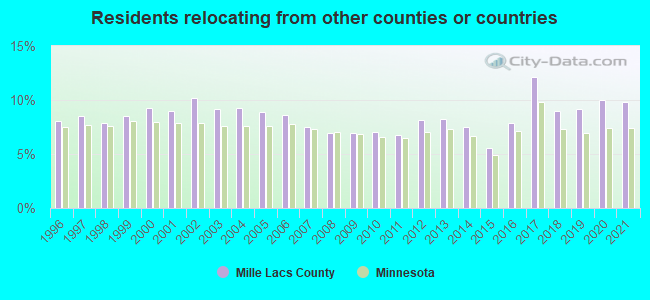
9.83% of this county's 2021 resident taxpayers lived in other counties in 2020 ($66,386 average adjusted gross income)
| Here: | 9.83% |
| Minnesota average: | 7.43% |
10 or fewer of this county's residents moved from foreign countries.
8.59% relocated from other counties in Minnesota ($60,482 average AGI)
1.24% relocated from other states ($5,904 average AGI)
Mille Lacs County: 1.24% Minnesota average: 2.06%
Top counties from which taxpayers relocated into this county between 2020 and 2021:
| from Sherburne County, MN | |
| from Anoka County, MN | |
| from Hennepin County, MN | |
| from Benton County, MN | |
| from Isanti County, MN | |
| from Stearns County, MN | |
| from Wright County, MN |
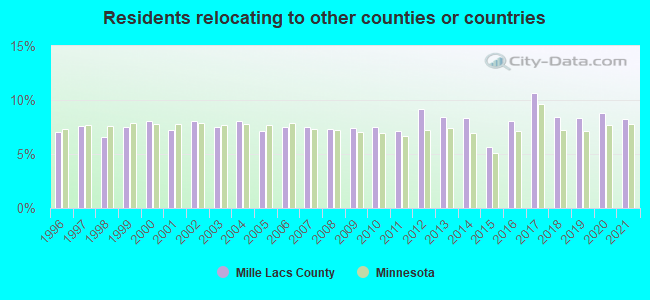
8.22% of this county's 2020 resident taxpayers moved to other counties in 2021 ($51,223 average adjusted gross income)
| Here: | 8.22% |
| Minnesota average: | 7.79% |
10 or fewer of this county's residents moved to foreign countries.
7.00% relocated to other counties in Minnesota ($43,714 average AGI)
1.21% relocated to other states ($7,508 average AGI)
Mille Lacs County: 1.21% Minnesota average: 2.44%
Top counties to which taxpayers relocated from this county between 2020 and 2021:
| to Sherburne County, MN | |
| to Hennepin County, MN | |
| to Benton County, MN | |
| to Stearns County, MN | |
| to Anoka County, MN | |
| to Isanti County, MN | |
| to Kanabec County, MN |
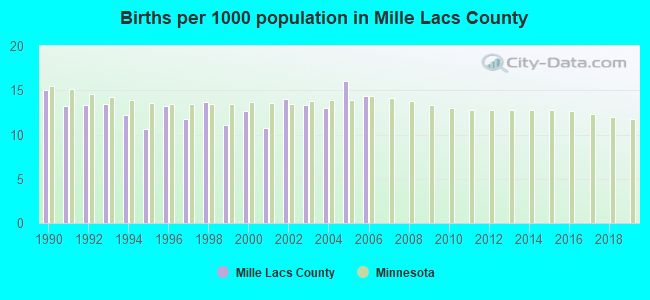
Births per 1000 population from 1990 to 1999: 12.8
Births per 1000 population from 2000 to 2006: 13.4
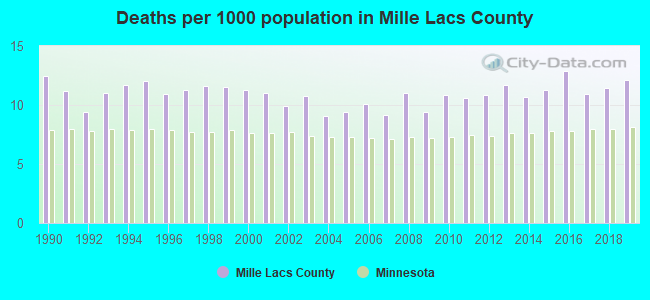
Deaths per 1000 population from 1990 to 1999: 11.3
Deaths per 1000 population from 2000 to 2009: 10.1
Deaths per 1000 population from 2010 to 2020: 11.6
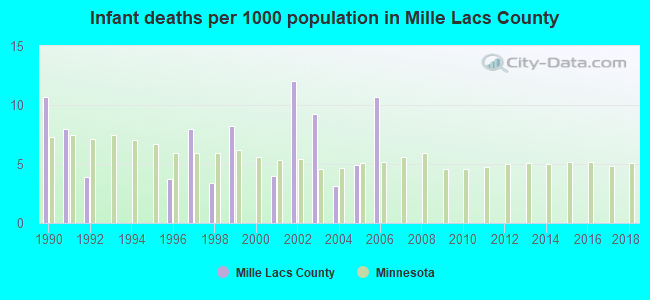
Infant deaths per 1000 live births from 1990 to 1999: 4.6
Infant deaths per 1000 live births from 2000 to 2006: 6.3
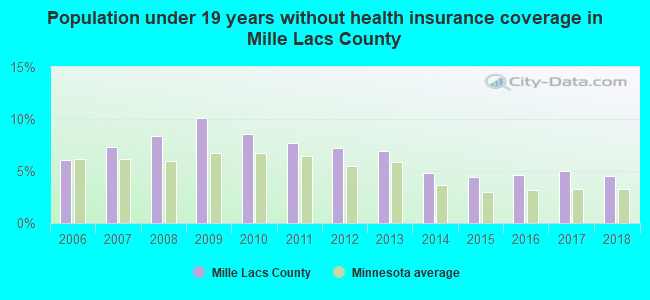
Persons under 19 years old without health insurance coverage in 2018: 4.5%
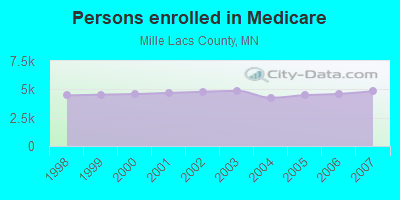
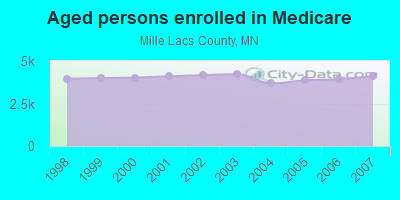
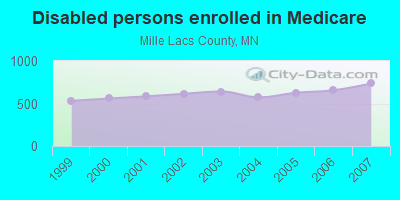
Persons enrolled in hospital insurance and/or supplemental medical insurance (Medicare) in July 1, 2007: 4,841 (4,105 aged, 736 disabled)
Children under 18 without health insurance coverage in 2007: 483 (7%)
Most common underlying causes of death in Mille Lacs County, Minnesota in 1999 - 2019:
- Bronchus or lung, unspecified - Malignant neoplasms (351)
- Atherosclerotic heart disease (323)
- Unspecified dementia (303)
- Chronic obstructive pulmonary disease, unspecified (148)
- Acute myocardial infarction, unspecified (104)
- Stroke, not specified as haemorrhage or infarction (95)
- Congestive heart failure (53)
- Alzheimer disease, unspecified (38)
- Unspecified diabetes mellitus, without complications (20)
Population without health insurance coverage in 2000: 10%
Children under 18 without health insurance coverage in 2000: 8%
Short term general hospital admissions per 100,000 population in 2004: 14,422
Short term general hospital beds per 100,000 population in 2004: 494
Emergency room visits per 100,000 population in 2004: 69,791
General practice office based MDs per 100,000 population in 2005: 1,414
Medical specialist MDs per 100,000 population in 2005: 880
Dentists per 100,000 population in 1998: 23
Total births per 100,000 population, July 2005 - July 2006 : 33
Total deaths per 100,000 population, July 2005 - July 2006: 78
Limited-service eating places per 100,000 population in 2005 : 12
Household type by relationship:
Households: 26,782- Male householders: 5,243 (1,678 living alone), Female householders: 5,614 (1,624 living alone)
5,228 spouses (5,209 opposite-sex spouses), 878 unmarried partners, (871 opposite-sex unmarried partners), 7,512 children (6,952 natural, 191 adopted, 358 stepchildren), 587 grandchildren, 174 brothers or sisters, 195 parents, 26 foster children, 248 other relatives, 565 non-relatives
- In group quarters: 498
Size of family households: 3,516 2-persons, 1,216 3-persons, 1,089 4-persons, 675 5-persons, 249 6-persons, 233 7-or-more-persons.
Size of nonfamily households: 3,303 1-person, 532 2-persons, 39 3-persons, 10 5-persons, 2 6-persons.
3,430 married couples with children.
1,899 single-parent households (691 men, 1,208 women).
96.6% of residents of Mille Lacs speak English at home.
0.9% of residents speak Spanish at home (73% speak English very well, 21% speak English well, 6% speak English not well).
0.6% of residents speak other Indo-European language at home (56% speak English very well, 6% speak English well, 35% speak English not well, 3% don't speak English at all).
0.3% of residents speak Asian or Pacific Island language at home (26% speak English very well, 74% speak English not well).
1.4% of residents speak other language at home (98% speak English very well, 1% speak English well, 1% speak English not well).
In fiscal year 2004:
Federal Government expenditure: $152,859,000 ($6,095 per capita)
Department of Defense expenditure: $2,205,000
Federal direct payments to individuals for retirement and disability: $68,012,000
Federal other direct payments to individuals: $29,661,000
Federal direct payments not to individuals: $5,910,000
Federal grants: $33,643,000
Federal procurement contracts: $11,531,000 ($114,000 Department of Defense)
Federal salaries and wages: $4,102,000 ($0,000 Department of Defense)
Federal Government direct loans: $843,000
Federal guaranteed/insured loans: $16,403,000
Federal Government insurance: $9,763,000
Population change from April 1, 2000 to July 1, 2005:
Births: 1,596| Here: | 62 per 1000 residents |
| State: | 70 per 1000 residents |
Deaths: 1,330
| Here: | 52 per 1000 residents |
| State: | 38 per 1000 residents |
Net international migration: +20
| Here: | +1 per 1000 residents |
| State: | +14 per 1000 residents |
Net internal migration: +3,115
| Here: | |
| State: |
Total withdrawal of fresh water for public supply: 1.05 millions of gallons per day (all from ground)
| Here: | 6.3 |
| State: | 7.1 |
| Here: | 4.1 |
| State: | 3.8 |
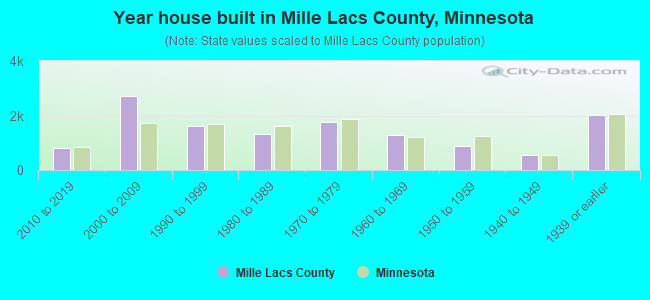
- Year house built in Mille Lacs County, Minnesota
- 442020 or later
- 7992010 to 2019
- 2,8722000 to 2009
- 1,6481990 to 1999
- 1,4091980 to 1989
- 1,8471970 to 1979
- 1,0251960 to 1969
- 8221950 to 1959
- 4731940 to 1949
- 2,0361939 or earlier
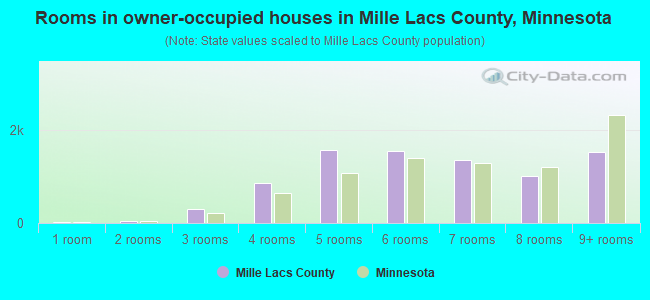
- Rooms in owner-occupied houses in Mille Lacs County, Minnesota
- 201 room
- 322 rooms
- 3083 rooms
- 8864 rooms
- 1,5655 rooms
- 1,6046 rooms
- 1,3477 rooms
- 9788 rooms
- 1,4829+ rooms
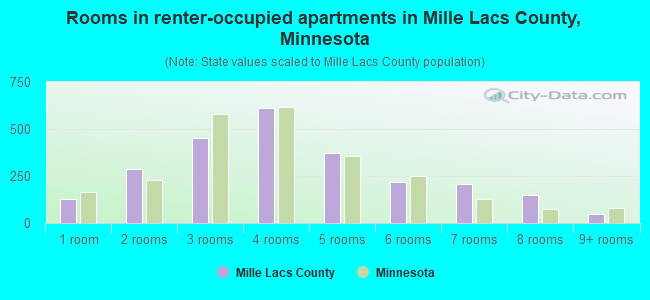
- Rooms in renter-occupied apartments in Mille Lacs County, Minnesota
- 1071 room
- 3682 rooms
- 4013 rooms
- 6604 rooms
- 4505 rooms
- 2006 rooms
- 2467 rooms
- 1288 rooms
- 539+ rooms
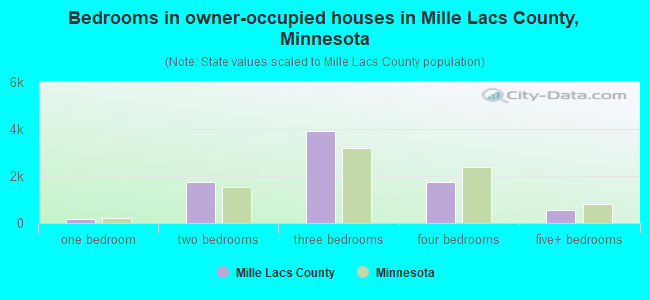
- Bedrooms in owner-occupied houses in Mille Lacs County, Minnesota
- 28no bedroom
- 1951 bedroom
- 1,6952 bedrooms
- 3,8503 bedrooms
- 1,8514 bedrooms
- 6005+ bedrooms
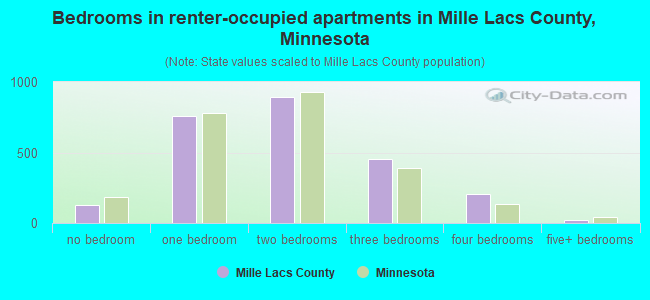
- Bedrooms in renter-occupied apartments in Mille Lacs County, Minnesota
- 109no bedroom
- 7881 bedroom
- 9002 bedrooms
- 5193 bedrooms
- 2434 bedrooms
- 315+ bedrooms
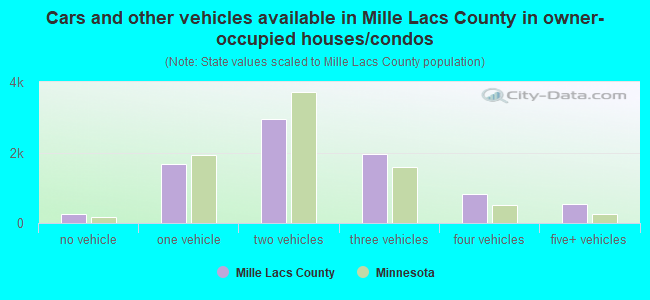
- Cars and other vehicles available in Mille Lacs County in owner-occupied houses/condos
- 237no vehicle
- 1,6741 vehicle
- 3,1252 vehicles
- 1,8963 vehicles
- 8154 vehicles
- 4845+ vehicles
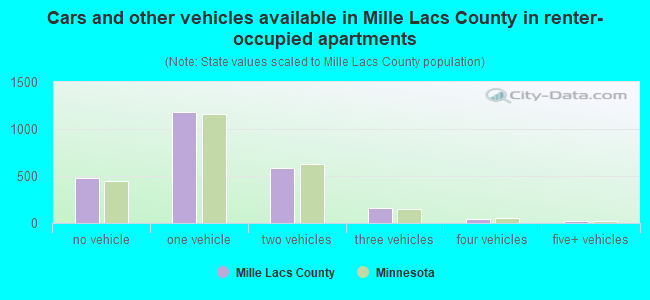
- Cars and other vehicles available in Mille Lacs County in renter-occupied apartments
- 522no vehicle
- 1,1971 vehicle
- 5642 vehicles
- 2343 vehicles
- 624 vehicles
- 225+ vehicles
88.5% of Mille Lacs County residents lived in the same house 1 years ago.
Out of people who lived in different houses, 20% lived in this county.
Out of people who lived in different counties, 90% lived in Minnesota.
| Mille Lacs County: | 88.5% |
| State average: | 87.4% |
Place of birth for U.S.-born residents:
- This state: 22,045
- Other state: 4,222
- Northeast: 312
- Midwest: 2,198
- South: 702
- West: 1,014
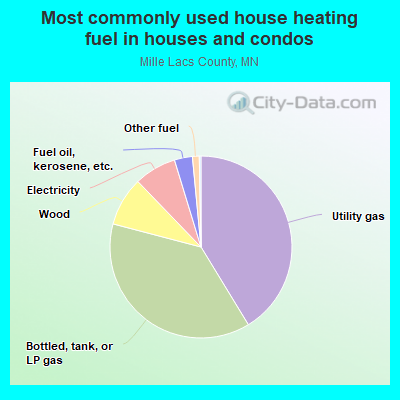
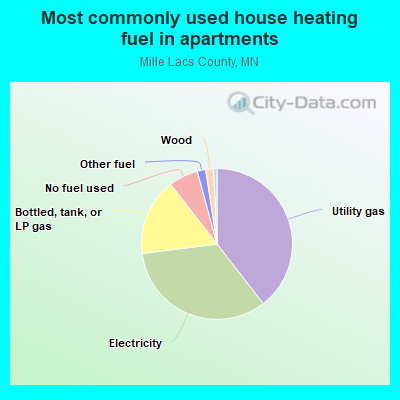
- 41.3%Utility gas
- 39.5%Bottled, tank, or LP gas
- 7.9%Wood
- 7.4%Electricity
- 2.7%Fuel oil, kerosene, etc.
- 1.0%Other fuel
- 0.2%No fuel used
- 43.9%Utility gas
- 30.0%Electricity
- 14.3%Bottled, tank, or LP gas
- 6.1%No fuel used
- 2.6%Other fuel
- 2.3%Wood
- 0.8%Fuel oil, kerosene, etc.
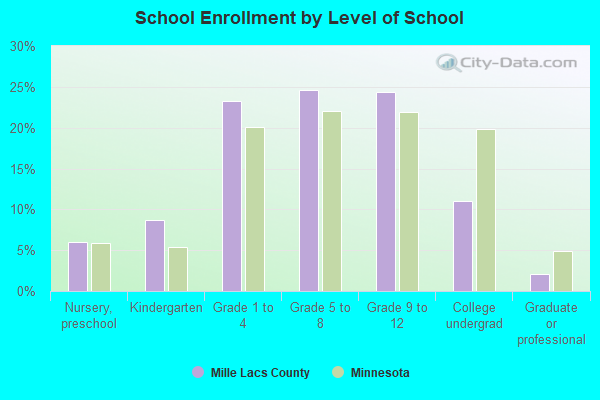
Private vs. public school enrollment:
| Here: | 14.8% |
| Minnesota: | 12.9% |
| Here: | 6.8% |
| Minnesota: | 8.6% |
| Here: | 14.6% |
| Minnesota: | 26.2% |
Mille Lacs County government finances - Expenditure in 2017:
- Current Operations - Public Welfare - Other: $11,188,000
Regular Highways: $5,379,000
Police Protection: $4,683,000
Correctional Institutions: $3,006,000
Central Staff Services: $2,781,000
Judicial and Legal Services: $1,918,000
Corrections - Other: $882,000
Health - Other: $826,000
Financial Administration: $400,000
General Public Buildings: $350,000
Libraries: $271,000
Natural Resources - Other: $96,000
Solid Waste Management: $91,000
Public Welfare, Vendor Payments for Other Purposes: $39,000
- General - Interest on Debt: $567,000
- Local Intergovernmental - Highways: $236,000
- Long Term Debt - Beginning Outstanding - Unspecified Public Purpose: $14,185,000
Outstanding Unspecified Public Purpose: $7,290,000
Retired Unspecified Public Purpose: $6,895,000
- Miscellaneous - General Revenue - Other: $131,000
Interest Earnings: $105,000
Sale of Property: $82,000
Rents: $81,000
Special Assessments: $72,000
Donations From Private Sources: $3,000
Fines and Forfeits: $2,000
- Other Capital Outlay - Regular Highways: $745,000
Police Protection: $262,000
- Other Funds - Cash and Securities: $22,970,000
- Sinking Funds - Cash and Securities: $1,864,000
- State Intergovernmental - Public Welfare: $5,841,000
Other: $1,863,000
Health and Hospitals: $895,000
General Local Government Support: $475,000
Highways: $9,000
- Tax - Property: $14,927,000
Motor Vehicle License: $273,000
Other License: $192,000
Alcoholic Beverage License: $48,000
Other: $25,000
- Total Salaries and Wages: $16,811,000
Mille Lacs County government finances - Revenue in 2017:
- Current Operations - Public Welfare - Other: $11,188,000
Regular Highways: $5,379,000
Police Protection: $4,683,000
Correctional Institutions: $3,006,000
Central Staff Services: $2,781,000
Judicial and Legal Services: $1,918,000
Corrections - Other: $882,000
Health - Other: $826,000
Financial Administration: $400,000
General Public Buildings: $350,000
Libraries: $271,000
Natural Resources - Other: $96,000
Solid Waste Management: $91,000
Public Welfare, Vendor Payments for Other Purposes: $39,000
- General - Interest on Debt: $567,000
- Local Intergovernmental - Highways: $236,000
- Long Term Debt - Beginning Outstanding - Unspecified Public Purpose: $14,185,000
Outstanding Unspecified Public Purpose: $7,290,000
Retired Unspecified Public Purpose: $6,895,000
- Miscellaneous - General Revenue - Other: $131,000
Interest Earnings: $105,000
Sale of Property: $82,000
Rents: $81,000
Special Assessments: $72,000
Donations From Private Sources: $3,000
Fines and Forfeits: $2,000
- Other Capital Outlay - Regular Highways: $745,000
Police Protection: $262,000
- Other Funds - Cash and Securities: $22,970,000
- Sinking Funds - Cash and Securities: $1,864,000
- State Intergovernmental - Public Welfare: $5,841,000
Other: $1,863,000
Health and Hospitals: $895,000
General Local Government Support: $475,000
Highways: $9,000
- Tax - Property: $14,927,000
Motor Vehicle License: $273,000
Other License: $192,000
Alcoholic Beverage License: $48,000
Other: $25,000
- Total Salaries and Wages: $16,811,000
Mille Lacs County government finances - Debt in 2017:
- Current Operations - Public Welfare - Other: $11,188,000
Regular Highways: $5,379,000
Police Protection: $4,683,000
Correctional Institutions: $3,006,000
Central Staff Services: $2,781,000
Judicial and Legal Services: $1,918,000
Corrections - Other: $882,000
Health - Other: $826,000
Financial Administration: $400,000
General Public Buildings: $350,000
Libraries: $271,000
Natural Resources - Other: $96,000
Solid Waste Management: $91,000
Public Welfare, Vendor Payments for Other Purposes: $39,000
- General - Interest on Debt: $567,000
- Local Intergovernmental - Highways: $236,000
- Long Term Debt - Beginning Outstanding - Unspecified Public Purpose: $14,185,000
Outstanding Unspecified Public Purpose: $7,290,000
Retired Unspecified Public Purpose: $6,895,000
- Miscellaneous - General Revenue - Other: $131,000
Interest Earnings: $105,000
Sale of Property: $82,000
Rents: $81,000
Special Assessments: $72,000
Donations From Private Sources: $3,000
Fines and Forfeits: $2,000
- Other Capital Outlay - Regular Highways: $745,000
Police Protection: $262,000
- Other Funds - Cash and Securities: $22,970,000
- Sinking Funds - Cash and Securities: $1,864,000
- State Intergovernmental - Public Welfare: $5,841,000
Other: $1,863,000
Health and Hospitals: $895,000
General Local Government Support: $475,000
Highways: $9,000
- Tax - Property: $14,927,000
Motor Vehicle License: $273,000
Other License: $192,000
Alcoholic Beverage License: $48,000
Other: $25,000
- Total Salaries and Wages: $16,811,000
Mille Lacs County government finances - Cash and Securities in 2017:
- Current Operations - Public Welfare - Other: $11,188,000
Regular Highways: $5,379,000
Police Protection: $4,683,000
Correctional Institutions: $3,006,000
Central Staff Services: $2,781,000
Judicial and Legal Services: $1,918,000
Corrections - Other: $882,000
Health - Other: $826,000
Financial Administration: $400,000
General Public Buildings: $350,000
Libraries: $271,000
Natural Resources - Other: $96,000
Solid Waste Management: $91,000
Public Welfare, Vendor Payments for Other Purposes: $39,000
- General - Interest on Debt: $567,000
- Local Intergovernmental - Highways: $236,000
- Long Term Debt - Beginning Outstanding - Unspecified Public Purpose: $14,185,000
Outstanding Unspecified Public Purpose: $7,290,000
Retired Unspecified Public Purpose: $6,895,000
- Miscellaneous - General Revenue - Other: $131,000
Interest Earnings: $105,000
Sale of Property: $82,000
Rents: $81,000
Special Assessments: $72,000
Donations From Private Sources: $3,000
Fines and Forfeits: $2,000
- Other Capital Outlay - Regular Highways: $745,000
Police Protection: $262,000
- Other Funds - Cash and Securities: $22,970,000
- Sinking Funds - Cash and Securities: $1,864,000
- State Intergovernmental - Public Welfare: $5,841,000
Other: $1,863,000
Health and Hospitals: $895,000
General Local Government Support: $475,000
Highways: $9,000
- Tax - Property: $14,927,000
Motor Vehicle License: $273,000
Other License: $192,000
Alcoholic Beverage License: $48,000
Other: $25,000
- Total Salaries and Wages: $16,811,000
Supplemental Security Income (SSI) in 2006:
- Total number of recipients: 339
- Number of aged recipients: 57
- Number of blind and disabled recipients: 282
- Number of recipients under 18: 50
- Number of recipients between 18 and 64: 211
- Number of recipients older than 64: 78
- Number of recipients also receiving OASDI: 154
- Amount of payments (thousands of dollars): 142
| Most common first names in Mille Lacs County, MN among deceased individuals | ||
| Name | Count | Lived (average) |
|---|---|---|
| John | 199 | 78.2 years |
| William | 138 | 78.1 years |
| George | 113 | 80.1 years |
| Robert | 108 | 71.7 years |
| Mary | 100 | 83.7 years |
| Anna | 78 | 88.3 years |
| Joseph | 77 | 76.3 years |
| James | 76 | 72.7 years |
| Henry | 75 | 80.0 years |
| Arthur | 74 | 78.2 years |
| Most common last names in Mille Lacs County, MN among deceased individuals | ||
| Last name | Count | Lived (average) |
|---|---|---|
| Johnson | 226 | 78.3 years |
| Anderson | 176 | 79.6 years |
| Nelson | 113 | 81.0 years |
| Peterson | 99 | 79.6 years |
| Olson | 90 | 78.0 years |
| Swanson | 57 | 82.7 years |
| Erickson | 57 | 79.7 years |
| Larson | 56 | 78.6 years |
| Carlson | 47 | 80.9 years |
| Jones | 37 | 79.4 years |
| Businesses in Mille Lacs County, MN | ||||
| Name | Count | Name | Count | |
|---|---|---|---|---|
| Ace Hardware | 1 | La-Z-Boy | 1 | |
| AmericInn | 1 | Lane Furniture | 3 | |
| Burger King | 1 | McDonald's | 1 | |
| Chevrolet | 1 | Nike | 1 | |
| Curves | 1 | Pizza Hut | 2 | |
| DHL | 1 | RadioShack | 1 | |
| Dairy Queen | 3 | Subway | 3 | |
| Domino's Pizza | 1 | Super 8 | 1 | |
| FedEx | 2 | True Value | 1 | |
| H&R Block | 1 | U-Haul | 3 | |
| Hardee's | 1 | UPS | 2 | |
| Jones New York | 1 | |||