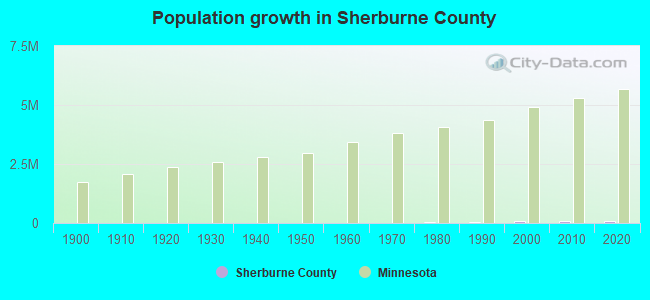
Sherburne County, Minnesota (MN)
County owner-occupied free and clear houses and condos in 2010: 3,871
County owner-occupied houses and condos in 2000: 18,125
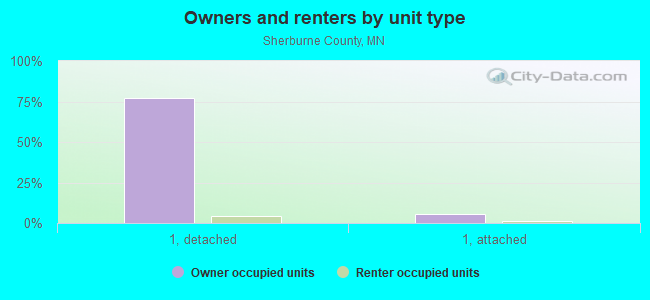
Renter-occupied apartments: 5,018 (it was 3,456 in 2000)
| % of renters here: | 16% |
| State: | 27% |
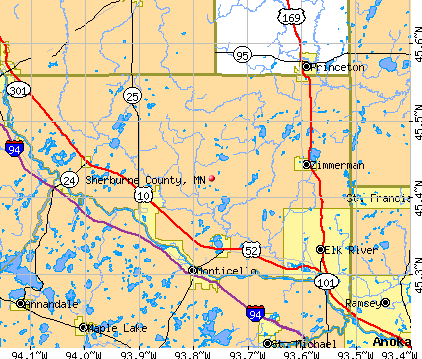
Land area: 436 sq. mi.
Water area: 14.7 sq. mi.
Population density: 231 people per square mile (high).
Industries providing employment: Educational, health and social services (21.1%), Manufacturing (16.3%), Construction (11.8%), Retail trade (11.0%).
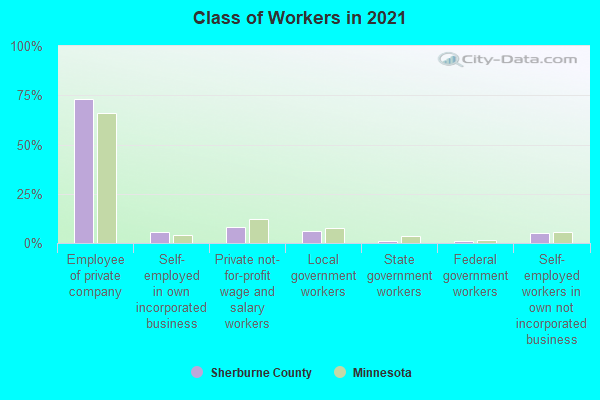
Type of workers:
- Private wage or salary: 84%
- Government: 13%
- Self-employed, not incorporated: 4%
- Unpaid family work: 0%
- OSM Map
- General Map
- Google Map
- MSN Map

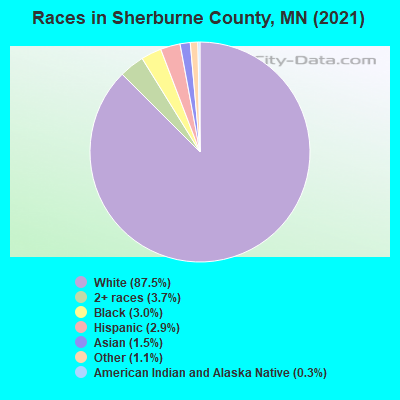
- 85,43884.7%White Non-Hispanic Alone
- 5,0045.0%Two or more races
- 4,2404.2%Black Non-Hispanic Alone
- 3,3723.3%Hispanic or Latino
- 1,6241.6%Some other race alone
- 9951.0%Asian alone
- 1510.1%American Indian and Alaska Native alone
| Median resident age: | 36.3 years |
| Minnesota median age: | 39.0 years |
| Males: 52,349 | |
| Females: 48,475 |

 | Moving to Minnesota? (53 replies) |
| What’s Saint Cloud like? (37 replies) |
| As Detentions Grow, ICE Looks for More Space in St. Paul (0 replies) |
| ***How is the Princeton, Monticello, Zimmerman areas for retirement? (25 replies) |
| Foreclosures or lots not listed on MLS (17 replies) |
| Outstate? (122 replies) |
| Sherburne County: | 2.0 people |
| Minnesota: | 2 people |
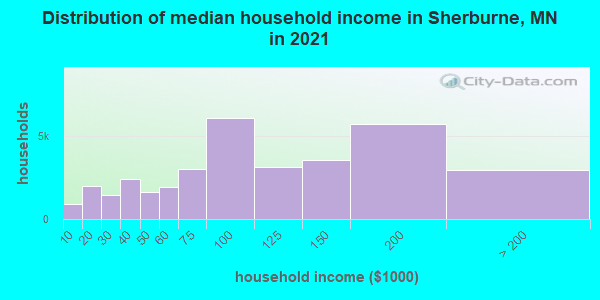
Estimated median household income in 2022: $96,889 ($57,014 in 1999)
| This county: | $96,889 |
| Minnesota: | $82,338 |
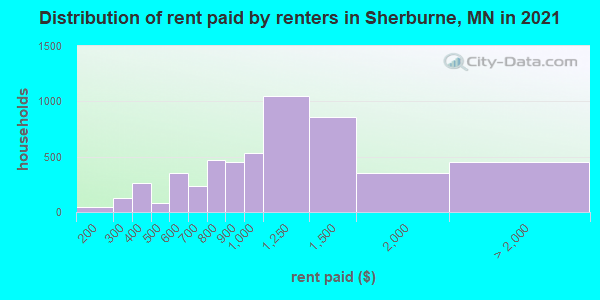
Median contract rent in 2022 for apartments: $1,109 (lower quartile is $715, upper quartile is $1,581)
| This county: | $1109 |
| State: | $1087 |
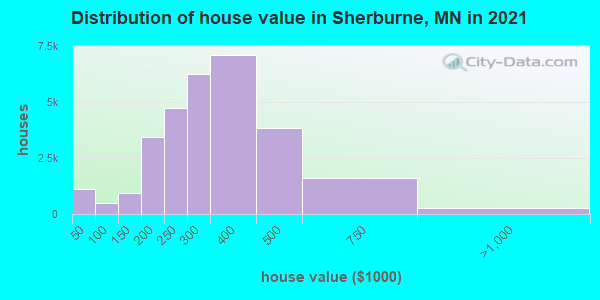
Estimated median house or condo value in 2022: $339,900 (it was $139,400 in 2000)
| Sherburne: | $339,900 |
| Minnesota: | $314,600 |
Median monthly housing costs for homes and condos with a mortgage: $1,873
Median monthly housing costs for units without a mortgage: $593
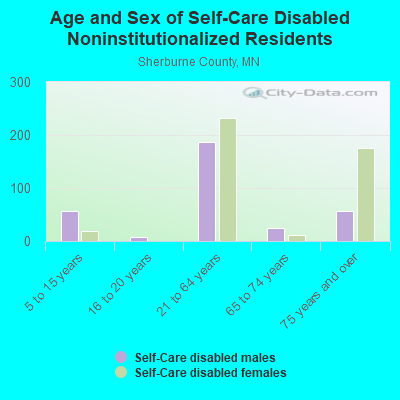
Institutionalized population: 1,980
Crime in 2021 (reported by the sheriff's office or county police, not the county total):
- Murders: 0
- Rapes: 9
- Robberies: 0
- Assaults: 19
- Burglaries: 29
- Thefts: 213
- Auto thefts: 21
Crime in 2020 (reported by the sheriff's office or county police, not the county total):
- Murders: 1
- Rapes: 14
- Robberies: 1
- Assaults: 27
- Burglaries: 39
- Thefts: 221
- Auto thefts: 24
Health of residents in Sherburne County based on CDC Behavioral Risk Factor Surveillance System Survey Questionnaires from 2013 to 2021:
General health status score of residents in this county from 1 (poor) to 5 (excellent) is 3.7. This is better than average.79.3% of residents exercised in the past month. This is about average.
40.5% of residents smoked 100+ cigarettes in their lives. This is less than average.
64.1% of adult residents drank alcohol in the past 30 days. This is less than average.
75.9% of residents visited a dentist within the past year. This is about average.
Average weight of males is 198 pounds. This is about average.
Average weight of females is 161 pounds. This is about average.
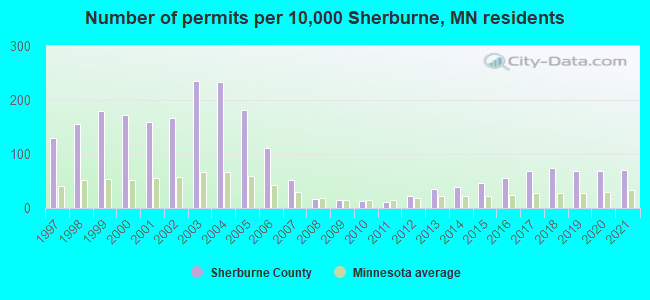
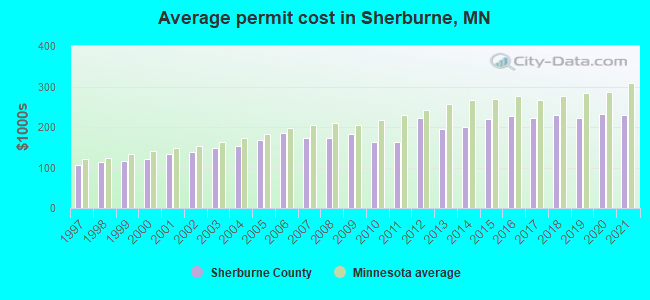
Single-family new house construction building permits:
- 2022: 268 buildings, average cost: $248,800
- 2021: 455 buildings, average cost: $229,800
- 2020: 444 buildings, average cost: $231,200
- 2019: 439 buildings, average cost: $222,100
- 2018: 475 buildings, average cost: $228,500
- 2017: 447 buildings, average cost: $220,600
- 2016: 363 buildings, average cost: $227,700
- 2015: 294 buildings, average cost: $220,100
- 2014: 245 buildings, average cost: $199,200
- 2013: 229 buildings, average cost: $194,100
- 2012: 149 buildings, average cost: $222,100
- 2011: 69 buildings, average cost: $164,000
- 2010: 82 buildings, average cost: $162,300
- 2009: 89 buildings, average cost: $182,500
- 2008: 108 buildings, average cost: $172,000
- 2007: 333 buildings, average cost: $171,900
- 2006: 722 buildings, average cost: $184,800
- 2005: 1163 buildings, average cost: $167,600
- 2004: 1501 buildings, average cost: $154,200
- 2003: 1520 buildings, average cost: $148,900
- 2002: 1075 buildings, average cost: $138,100
- 2001: 1027 buildings, average cost: $132,900
- 2000: 1108 buildings, average cost: $121,400
- 1999: 1152 buildings, average cost: $116,100
- 1998: 1001 buildings, average cost: $113,500
- 1997: 835 buildings, average cost: $106,200
Median real estate property taxes paid for housing units with mortgages in 2022: $3,346 (1.0%)
Median real estate property taxes paid for housing units with no mortgage in 2022: $3,105 (1.0%)
| Sherburne County: | 6.2% |
| Minnesota: | 9.6% |
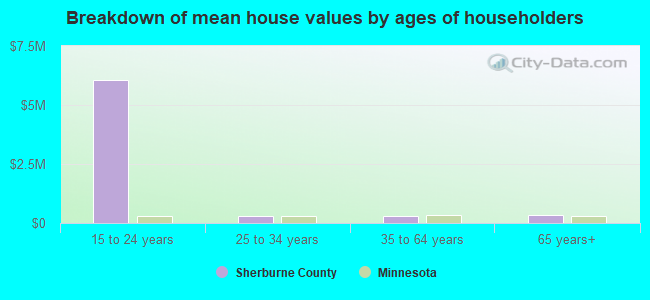
Median age of residents in 2022: 36.3 years old
(Males: 35.7 years old, Females: 37.4 years old)
(Median age for: White residents: 39.3 years old, Black residents: 21.5 years old, American Indian residents: 33.0 years old, Asian residents: 42.3 years old, Hispanic or Latino residents: 24.5 years old, Other race residents: 24.8 years old)
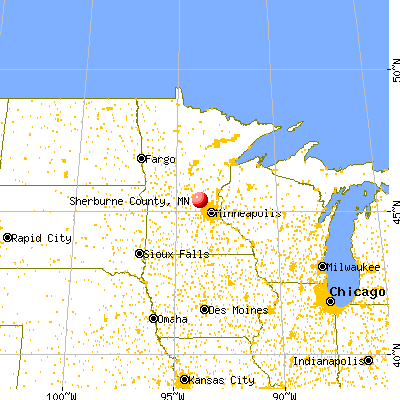
Area name: Minneapolis-St. Paul-Bloomington, MN-WI MSA
Fair market rent in 2006 for a 1-bedroom apartment in Sherburne County is $705 a month.
Fair market rent for a 2-bedroom apartment is $855 a month.
Fair market rent for a 3-bedroom apartment is $1119 a month.
Cities in this county include: Elk River, Big Lake, Zimmerman, Becker, Clear Lake.
Neighboring counties: Morrow County, Oregon  , Menominee County, Michigan
  , Ramsey County
  , Ziebach County, South Dakota , Swift County .
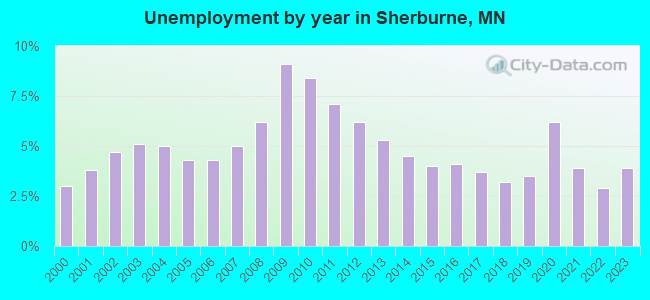
| Here: | 3.0% |
| Minnesota: | 2.6% |
Current college students: 3,410
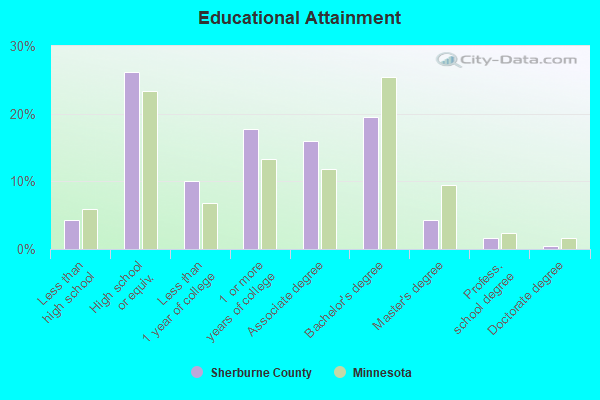
People 25 years of age or older with a high school degree or higher: 94.8%
People 25 years of age or older with a bachelor's degree or higher: 31.1%
Number of foreign born residents: 3,244 (62.3% naturalized citizens)
| Sherburne County: | 3.2% |
| Whole state: | 8.7% |
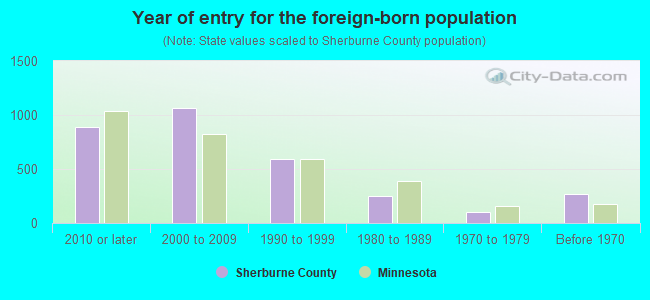
- Year of entry for the foreign-born population
- 1,3262010 or later
- 9802000 to 2009
- 5491990 to 1999
- 2481980 to 1989
- 1061970 to 1979
- 267Before 1970
Mean travel time to work (commute): ! minutes
Percentage of county residents living and working in this county: 99.6%
Housing units in structures:
- One, detached: 29,942
- One, attached: 2,824
- Two: 294
- 3 or 4: 109
- 5 to 9: 573
- 10 to 19: 741
- 20 to 49: 695
- 50 or more: 1,294
- Mobile homes: 535
- Boats, RVs, vans, etc.: 83
Housing units in Sherburne County with a mortgage: 22,754 (2,405 second mortgage, 145 home equity loan, 1,695 both second mortgage and home equity loan)
Houses without a mortgage: 568
| Here: | 3.7% with mortgage |
| State: | 97.6% with mortgage |
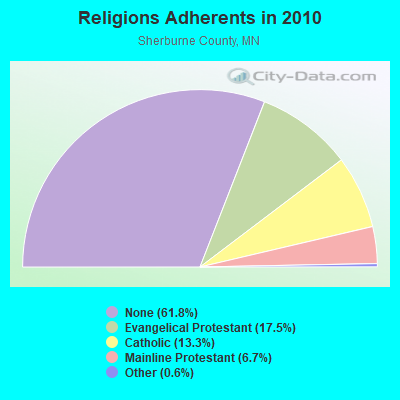
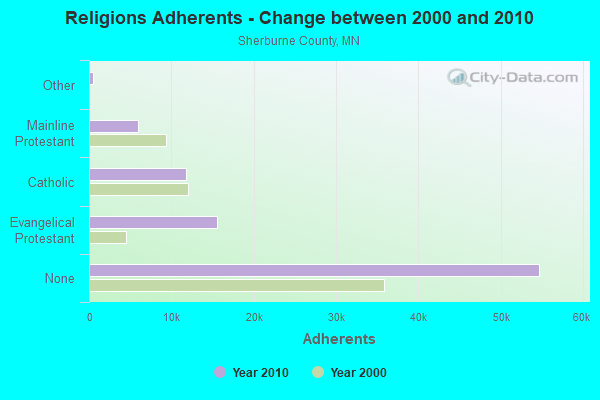
Religion statistics for Sherburne County
| Religion | Adherents | Congregations |
|---|---|---|
| Evangelical Protestant | 15,518 | 37 |
| Catholic | 11,772 | 4 |
| Mainline Protestant | 5,958 | 11 |
| Other | 531 | 1 |
| None | 54,720 | - |
Source: Clifford Grammich, Kirk Hadaway, Richard Houseal, Dale E.Jones, Alexei Krindatch, Richie Stanley and Richard H.Taylor. 2012. 2010 U.S.Religion Census: Religious Congregations & Membership Study. Association of Statisticians of American Religious Bodies. Jones, Dale E., et al. 2002. Congregations and Membership in the United States 2000. Nashville, TN: Glenmary Research Center.
Food Environment Statistics:
| Sherburne County: | 0.70 / 10,000 pop. |
| State: | 1.83 / 10,000 pop. |
| Sherburne County: | 3.14 / 10,000 pop. |
| Minnesota: | 3.90 / 10,000 pop. |
| This county: | 4.18 / 10,000 pop. |
| State: | 6.98 / 10,000 pop. |
| Sherburne County: | 6.0% |
| Minnesota: | 6.5% |
| Sherburne County: | 27.6% |
| State: | 25.9% |
| Here: | 8.6% |
| State: | 13.0% |
Agriculture in Sherburne County:
Average size of farms: 186 acresAverage value of agricultural products sold per farm: $71,696
Average value of crops sold per acre for harvested cropland: $453.46
The value of nursery, greenhouse, floriculture, and sod as a percentage of the total market value of agricultural products sold: 7.48%
The value of livestock, poultry, and their products as a percentage of the total market value of agricultural products sold: 22.10%
Average total farm production expenses per farm: $54,437
Harvested cropland as a percentage of land in farms: 66.28%
Irrigated harvested cropland as a percentage of land in farms: 45.50%
Average market value of all machinery and equipment per farm: $55,429
The percentage of farms operated by a family or individual: 91.73%
Average age of principal farm operators: 54 years
Average number of cattle and calves per 100 acres of all land in farms: 7.29
Milk cows as a percentage of all cattle and calves: 9.21%
Corn for grain: 33722 harvested acres
All wheat for grain: 647 harvested acres
Soybeans for beans: 21418 harvested acres
Vegetables: 2,975 harvested acres
Land in orchards: 33 acres
Earthquake activity:
Sherburne County-area historical earthquake activity is significantly above Minnesota state average. It is 51% smaller than the overall U.S. average.On 7/9/1975 at 14:54:15, a magnitude 4.6 (4.6 MB, Class: Light, Intensity: IV - V) earthquake occurred 111.4 miles away from Sherburne County center
On 6/5/1993 at 01:24:53, a magnitude 4.1 (4.1 LG, Depth: 6.2 mi) earthquake occurred 123.5 miles away from the county center
On 3/4/1983 at 06:32:18, a magnitude 4.6 (4.4 MB, 4.6 LG, 4.4 ML) earthquake occurred 289.1 miles away from the county center
On 10/20/1995 at 15:57:18, a magnitude 3.7 (3.7 LG, Depth: 3.1 mi, Class: Light, Intensity: II - III) earthquake occurred 151.9 miles away from the county center
On 2/9/1994 at 08:45:35, a magnitude 3.1 (3.1 LG, Depth: 3.1 mi) earthquake occurred 66.8 miles away from Sherburne County center
On 11/3/2002 at 20:41:56, a magnitude 4.3 (4.3 MB, Depth: 3.1 mi) earthquake occurred 313.9 miles away from the county center
Magnitude types: regional Lg-wave magnitude (LG), body-wave magnitude (MB), local magnitude (ML)
Most recent natural disasters:
- Minnesota Covid-19 Pandemic, Incident Period: January 20, 2020, FEMA Id: 4531, Natural disaster type: Other
- Minnesota Hurricane Katrina Evacuation, Incident Period: August 29, 2005 to October 01, 2005, Emergency Declared EM-3242: September 13, 2005, FEMA Id: 3242, Natural disaster type: Hurricane
- Minnesota Flooding, Incident Period: June 28, 1997 to July 27, 1997, Major Disaster (Presidential) Declared DR-1187: August 25, 1997, FEMA Id: 1187, Natural disaster type: Flood
- Minnesota Severe Storms/Flooding, Incident Period: March 21, 1997 to May 24, 1997, Major Disaster (Presidential) Declared DR-1175: April 08, 1997, FEMA Id: 1175, Natural disaster type: Storm, Flood
- Minnesota Severe Winter Storms/Blizzards, Incident Period: January 03, 1997 to February 03, 1997, Major Disaster (Presidential) Declared DR-1158: January 16, 1997, FEMA Id: 1158, Natural disaster type: Winter Storm, Blizzard
- Minnesota Drought, Incident Period: June 17, 1976, Emergency Declared EM-3013: June 17, 1976, FEMA Id: 3013, Natural disaster type: Drought
- Minnesota FLOODING, Incident Period: April 18, 1969, Major Disaster (Presidential) Declared DR-255: April 18, 1969, FEMA Id: 255, Natural disaster type: Flood
- Minnesota FLOODING, Incident Period: March 22, 1966, Major Disaster (Presidential) Declared DR-215: March 22, 1966, FEMA Id: 215, Natural disaster type: Flood
- Minnesota FLOODING, Incident Period: April 11, 1965, Major Disaster (Presidential) Declared DR-188: April 11, 1965, FEMA Id: 188, Natural disaster type: Flood
The number of natural disasters in Sherburne County (9) is smaller than the US average (15).
Major Disasters (Presidential) Declared: 6
Emergencies Declared: 2
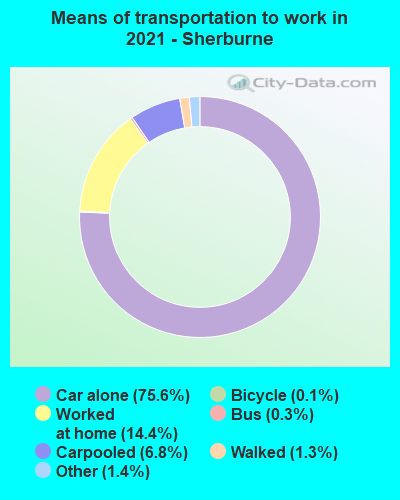
Means of transportation to work:
- Drove a car alone: 22,112 (69.9%)
- Carpooled: 2,214 (7.0%)
- Bus: 40 (0.1%)
- Long-distance train or commuter rail: 2 (0.0%)
- Taxicab, motorcycle, or other means: 506 (1.6%)
- Bicycle: 41 (0.1%)
- Walked: 342 (1.1%)
- Worked at home: 6,953 (22.0%)
- Health care and social assistance (27%)
- Retail trade (10%)
- Educational services (10%)
- Manufacturing (8%)
- Professional, scientific, and technical services (6%)
- Other services, except public administration (5%)
- Finance and insurance (4%)
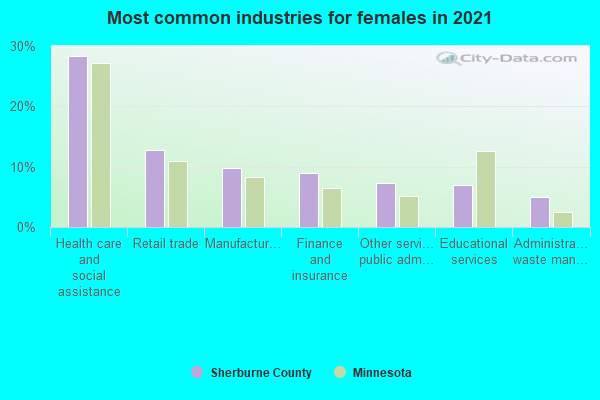
- Health care and social assistance (31%)
- Retail trade (12%)
- Educational services (11%)
- Manufacturing (9%)
- Professional, scientific, and technical services (6%)
- Other services, except public administration (6%)
- Finance and insurance (5%)
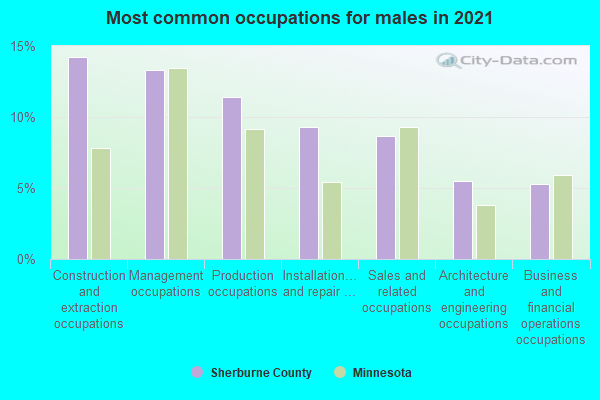
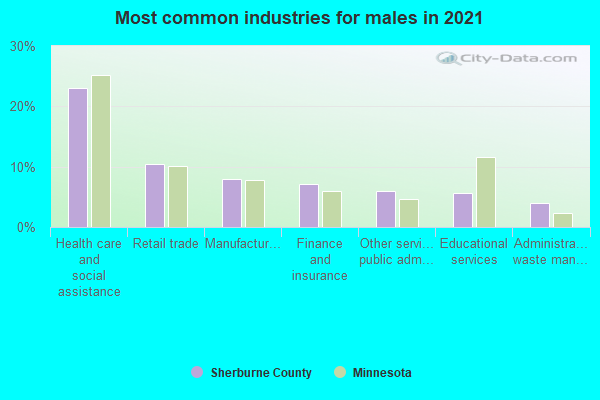
- Construction and extraction occupations (15%)
- Production occupations (14%)
- Management occupations (14%)
- Sales and related occupations (9%)
- Transportation occupations (6%)
- Building and grounds cleaning and maintenance occupations (6%)
- Installation, maintenance, and repair occupations (5%)
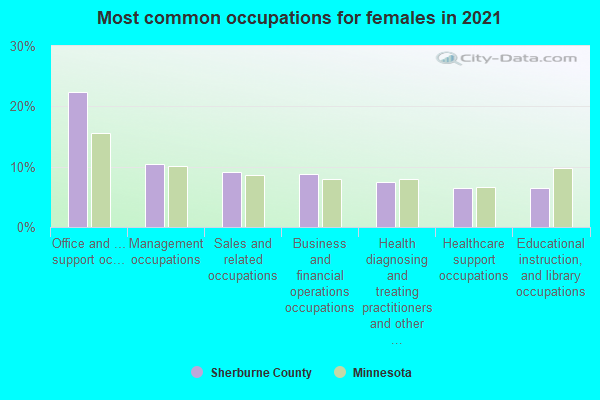
- Office and administrative support occupations (19%)
- Educational instruction, and library occupations (11%)
- Sales and related occupations (10%)
- Health diagnosing and treating practitioners and other technical occupations (10%)
- Management occupations (9%)
- Healthcare support occupations (8%)
- Personal care and service occupations (6%)
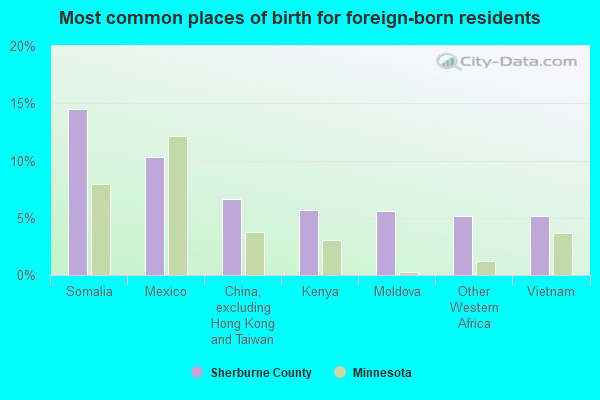
- Somalia (18%)
- Mexico (11%)
- Moldova (9%)
- Other Western Africa (7%)
- Vietnam (7%)
- Kenya (5%)
- Korea (5%)
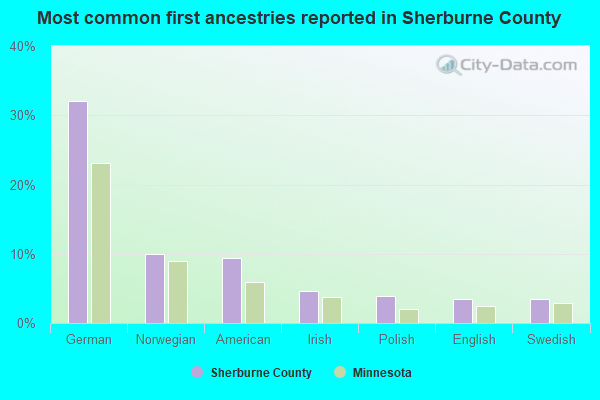
- German (31%)
- American (10%)
- Norwegian (10%)
- Irish (4%)
- Polish (4%)
- Swedish (4%)
- English (3%)
People in group quarters in Sherburne County, Minnesota in 2010:
- 1,000 people in state prisons
- 494 people in nursing facilities/skilled-nursing facilities
- 486 people in local jails and other municipal confinement facilities
- 100 people in group homes intended for adults
- 86 people in other noninstitutional facilities
- 8 people in workers' group living quarters and job corps centers
People in group quarters in Sherburne County, Minnesota in 2000:
- 800 people in state prisons
- 469 people in nursing homes
- 140 people in local jails and other confinement facilities (including police lockups)
- 109 people in religious group quarters
- 42 people in other noninstitutional group quarters
- 39 people in homes for the mentally retarded
- 10 people in short-term care, detention or diagnostic centers for delinquent children
- 7 people in agriculture workers' dormitories on farms
- 4 people in other group homes
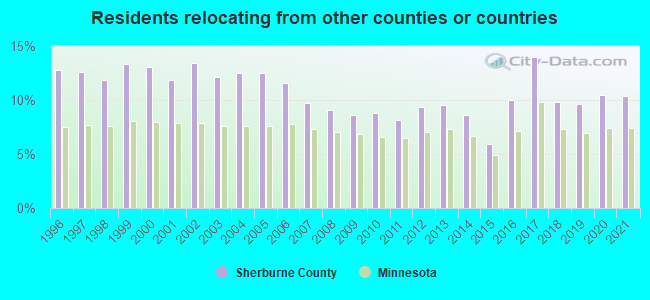
10.40% of this county's 2021 resident taxpayers lived in other counties in 2020 ($61,094 average adjusted gross income)
| Here: | 10.40% |
| Minnesota average: | 7.43% |
10 or fewer of this county's residents moved from foreign countries.
9.01% relocated from other counties in Minnesota ($52,923 average AGI)
1.39% relocated from other states ($8,171 average AGI)
Sherburne County: 1.39% Minnesota average: 2.06%
Top counties from which taxpayers relocated into this county between 2020 and 2021:
| from Hennepin County, MN | |
| from Anoka County, MN | |
| from Wright County, MN | |
| from Stearns County, MN | |
| from Ramsey County, MN | |
| from Benton County, MN | |
| from Mille Lacs County, MN |
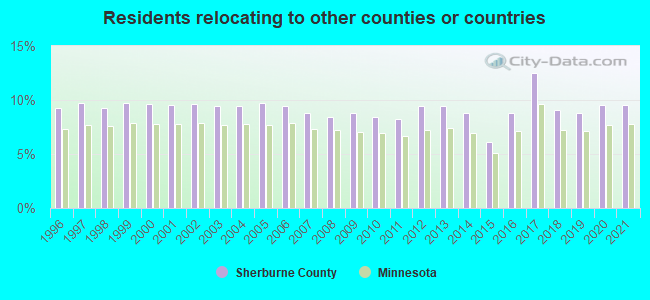
9.55% of this county's 2020 resident taxpayers moved to other counties in 2021 ($63,399 average adjusted gross income)
| Here: | 9.55% |
| Minnesota average: | 7.79% |
10 or fewer of this county's residents moved to foreign countries.
7.94% relocated to other counties in Minnesota ($50,536 average AGI)
1.61% relocated to other states ($12,863 average AGI)
Sherburne County: 1.61% Minnesota average: 2.44%
Top counties to which taxpayers relocated from this county between 2020 and 2021:
| to Wright County, MN | |
| to Hennepin County, MN | |
| to Stearns County, MN | |
| to Anoka County, MN | |
| to Mille Lacs County, MN | |
| to Benton County, MN | |
| to Isanti County, MN |
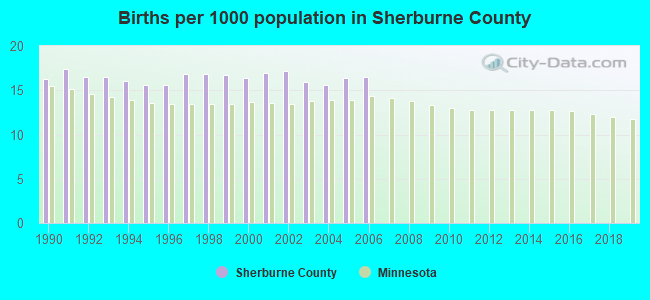
Births per 1000 population from 1990 to 1999: 16.4
Births per 1000 population from 2000 to 2006: 16.4
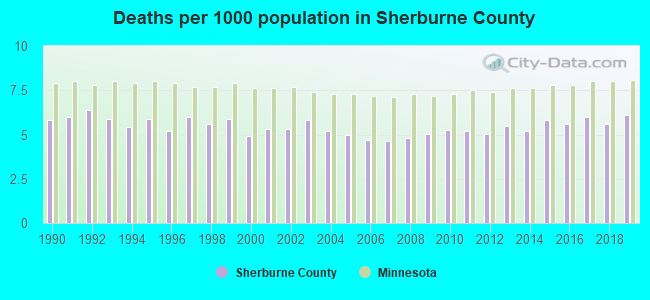
Deaths per 1000 population from 1990 to 1999: 5.8
Deaths per 1000 population from 2000 to 2009: 5.1
Deaths per 1000 population from 2010 to 2020: 5.7
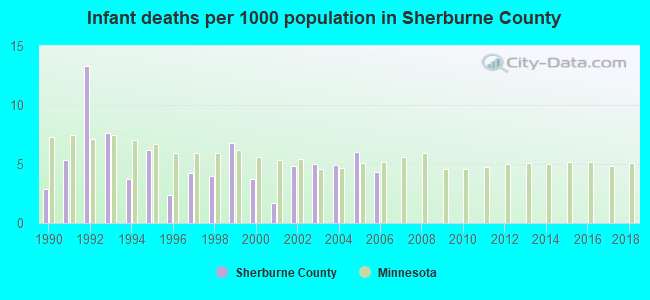
Infant deaths per 1000 live births from 1990 to 1999: 5.6
Infant deaths per 1000 live births from 2000 to 2006: 4.3
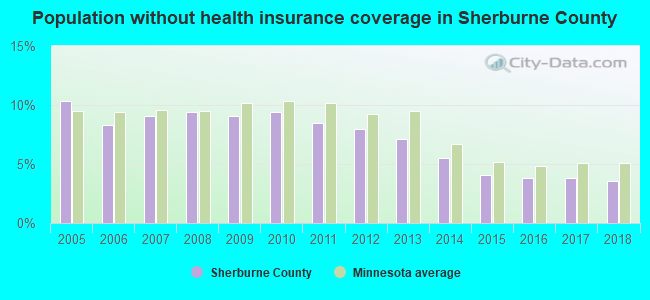
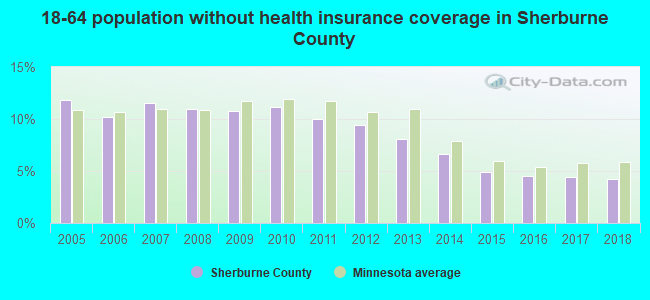
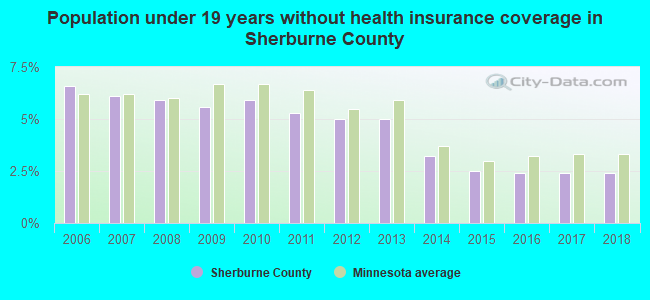
Persons under 19 years old without health insurance coverage in 2018: 2.4%
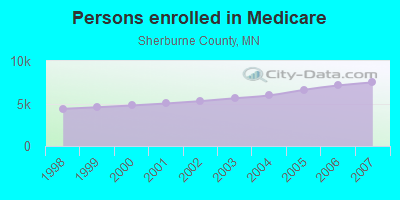
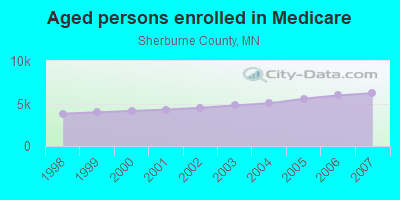
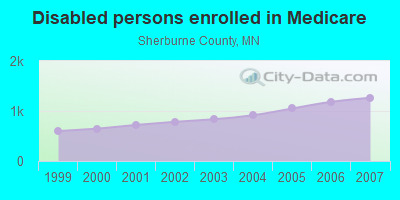
Persons enrolled in hospital insurance and/or supplemental medical insurance (Medicare) in July 1, 2007: 7,482 (6,218 aged, 1,264 disabled)
Children under 18 without health insurance coverage in 2007: 901 (3%)
Most common underlying causes of death in Sherburne County, Minnesota in 1999 - 2019:
- Bronchus or lung, unspecified - Malignant neoplasms (565)
- Atherosclerotic heart disease (557)
- Unspecified dementia (524)
- Chronic obstructive pulmonary disease, unspecified (388)
- Alzheimer disease, unspecified (366)
- Acute myocardial infarction, unspecified (227)
- Stroke, not specified as haemorrhage or infarction (200)
- Other ill-defined and unspecified causes of mortality (194)
- Breast, unspecified - Malignant neoplasms (97)
- Congestive heart failure (69)
Population without health insurance coverage in 2000: 8%
Children under 18 without health insurance coverage in 2000: 6%
Medical specialist MDs per 100,000 population in 2005: 478
Dentists per 100,000 population in 1998: 10
Total births per 100,000 population, July 2005 - July 2006 : 28
Total deaths per 100,000 population, July 2005 - July 2006: 48
Limited-service eating places per 100,000 population in 2005 : 10
Suicides per 1,000,000 population from 2000 to 2006: 139.6. This is more than state average.
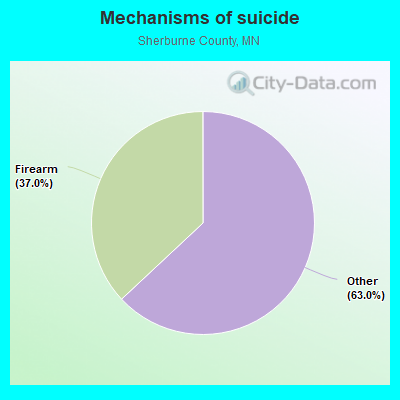
- Firearm - 51.6
- Other - 88.0
Household type by relationship:
Households: 100,824- Male householders: 17,776 (3,650 living alone), Female householders: 17,801 (3,505 living alone)
21,788 spouses (21,788 opposite-sex spouses), 2,428 unmarried partners, (2,428 opposite-sex unmarried partners), 32,970 children (31,621 natural, 404 adopted, 945 stepchildren), 1,655 grandchildren, 344 brothers or sisters, 537 parents, 0 foster children, 1,507 other relatives, 2,244 non-relatives
- In group quarters: 1,774
Size of family households: 10,456 2-persons, 5,284 3-persons, 6,410 4-persons, 2,172 5-persons, 1,413 6-persons, 247 7-or-more-persons.
Size of nonfamily households: 7,155 1-person, 1,985 2-persons, 178 3-persons, 277 4-persons.
20,320 married couples with children.
4,280 single-parent households (1,218 men, 3,062 women).
95.0% of residents of Sherburne speak English at home.
1.8% of residents speak Spanish at home (64% speak English very well, 10% speak English well, 21% speak English not well, 5% don't speak English at all).
0.5% of residents speak other Indo-European language at home (78% speak English very well, 10% speak English well, 12% speak English not well).
0.8% of residents speak Asian or Pacific Island language at home (47% speak English very well, 28% speak English well, 16% speak English not well, 9% don't speak English at all).
1.6% of residents speak other language at home (61% speak English very well, 7% speak English well, 26% speak English not well, 6% don't speak English at all).
In fiscal year 2004:
Federal Government expenditure: $160,631,000 ($2,039 per capita)
Department of Defense expenditure: $3,571,000
Federal direct payments to individuals for retirement and disability: $94,240,000
Federal other direct payments to individuals: $22,553,000
Federal direct payments not to individuals: $2,457,000
Federal grants: $25,771,000
Federal procurement contracts: $2,436,000 ($142,000 Department of Defense)
Federal salaries and wages: $13,175,000 ($37,000 Department of Defense)
Federal Government direct loans: $707,000
Federal guaranteed/insured loans: $188,639,000
Federal Government insurance: $26,625,000
Population change from April 1, 2000 to July 1, 2005:
Births: 6,160| Here: | 75 per 1000 residents |
| State: | 70 per 1000 residents |
Deaths: 2,073
| Here: | 25 per 1000 residents |
| State: | 38 per 1000 residents |
Net international migration: +111
| Here: | +1 per 1000 residents |
| State: | +14 per 1000 residents |
Net internal migration: +12,733
| Here: | |
| State: |
Total withdrawal of fresh water for public supply: 3.15 millions of gallons per day (all from ground)
| Here: | 7.2 |
| State: | 7.1 |
| Here: | 4.1 |
| State: | 3.8 |
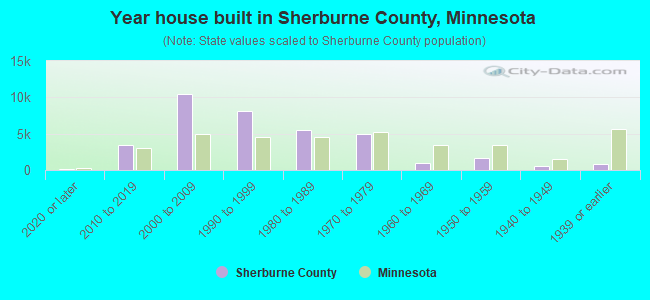
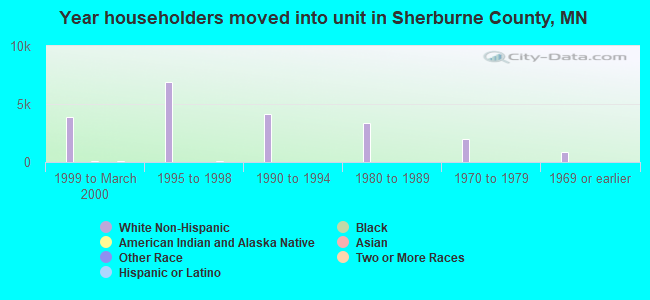
- Year house built in Sherburne County, Minnesota
- 8092020 or later
- 3,4572010 to 2019
- 10,1022000 to 2009
- 8,3011990 to 1999
- 4,9601980 to 1989
- 4,8151970 to 1979
- 1,8891960 to 1969
- 1,2461950 to 1959
- 4091940 to 1949
- 1,1021939 or earlier
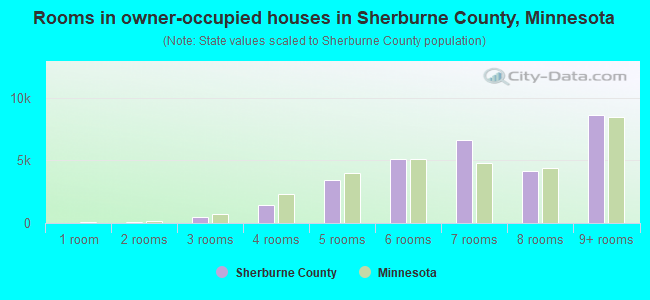
- Rooms in owner-occupied houses in Sherburne County, Minnesota
- 421 room
- 1152 rooms
- 5773 rooms
- 1,4424 rooms
- 3,6685 rooms
- 5,8176 rooms
- 4,6257 rooms
- 5,0868 rooms
- 8,7319+ rooms
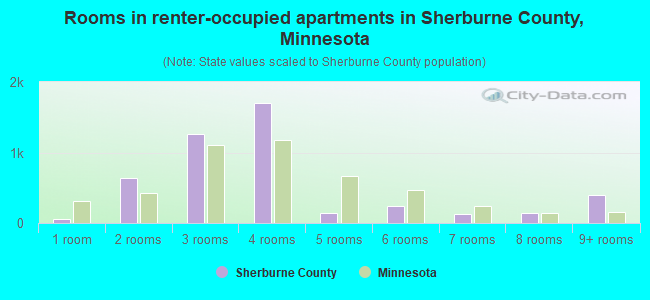
- Rooms in renter-occupied apartments in Sherburne County, Minnesota
- 831 room
- 4692 rooms
- 1,5913 rooms
- 1,0104 rooms
- 9085 rooms
- 1,0086 rooms
- 1557 rooms
- 728 rooms
- 1789+ rooms
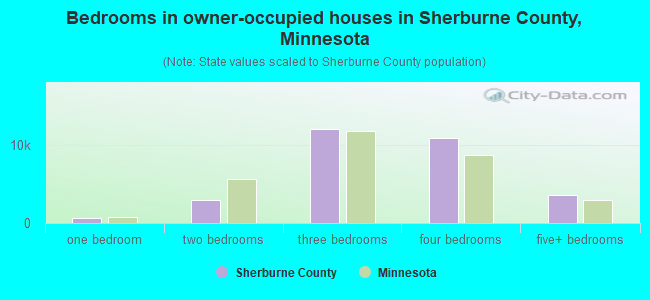
- Bedrooms in owner-occupied houses in Sherburne County, Minnesota
- 42no bedroom
- 3801 bedroom
- 4,4742 bedrooms
- 12,1663 bedrooms
- 9,2764 bedrooms
- 3,7655+ bedrooms
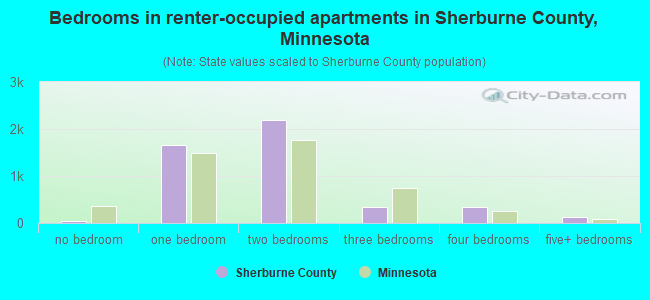
- Bedrooms in renter-occupied apartments in Sherburne County, Minnesota
- 83no bedroom
- 1,8431 bedroom
- 1,5602 bedrooms
- 1,2713 bedrooms
- 6124 bedrooms
- 1055+ bedrooms
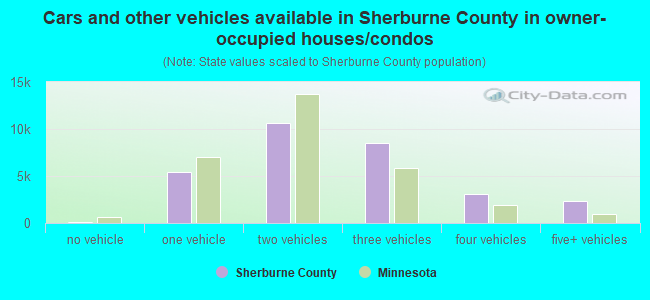
- Cars and other vehicles available in Sherburne County in owner-occupied houses/condos
- 687no vehicle
- 4,6381 vehicle
- 13,1612 vehicles
- 7,7733 vehicles
- 3,1134 vehicles
- 7315+ vehicles
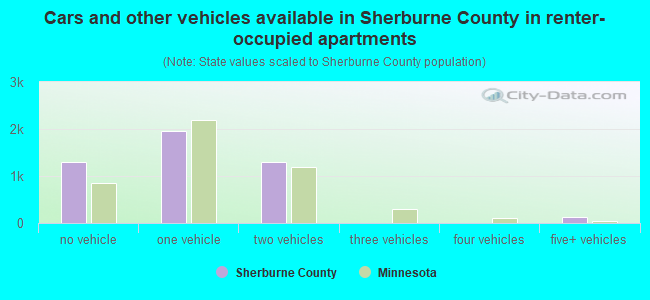
- Cars and other vehicles available in Sherburne County in renter-occupied apartments
- 680no vehicle
- 2,5751 vehicle
- 1,5872 vehicles
- 5073 vehicles
- 994 vehicles
- 265+ vehicles
88.9% of Sherburne County residents lived in the same house 1 years ago.
Out of people who lived in different houses, 22% lived in this county.
Out of people who lived in different counties, 88% lived in Minnesota.
| Sherburne County: | 88.9% |
| State average: | 87.4% |
Place of birth for U.S.-born residents:
- This state: 80,321
- Other state: 16,639
- Northeast: 1,542
- Midwest: 9,871
- South: 2,091
- West: 3,135
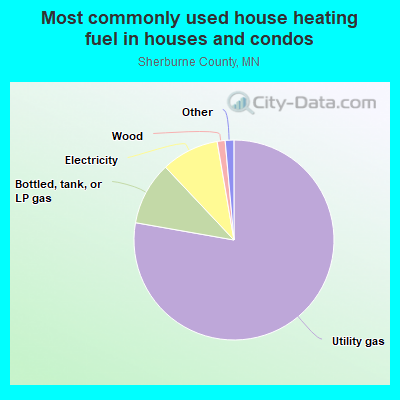
- 78.6%Utility gas
- 9.5%Bottled, tank, or LP gas
- 9.3%Electricity
- 1.2%Wood
- 0.8%Fuel oil, kerosene, etc.
- 0.5%Other fuel
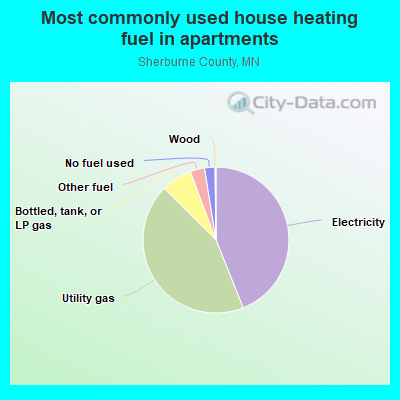
- 44.9%Electricity
- 43.8%Utility gas
- 5.5%Bottled, tank, or LP gas
- 2.6%Other fuel
- 2.4%No fuel used
- 0.6%Wood
- 0.2%Fuel oil, kerosene, etc.
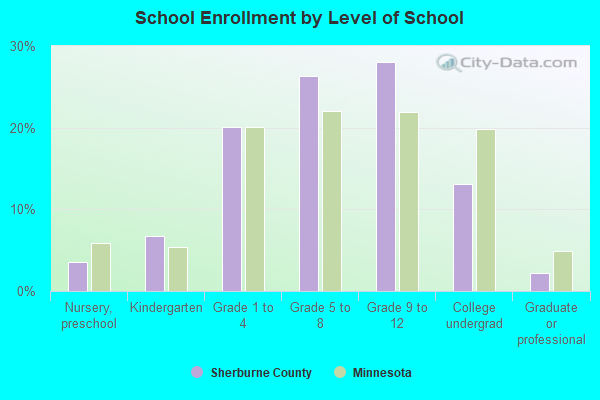
Private vs. public school enrollment:
| Here: | 7.0% |
| Minnesota: | 12.9% |
| Here: | 6.1% |
| Minnesota: | 8.6% |
| Here: | 19.2% |
| Minnesota: | 26.2% |
Sherburne County government finances - Expenditure in 2020:
- Bond Funds - Cash and Securities: $22,104,000
- Charges - Other: $11,911,000
Other: $5,966,000
Solid Waste Management: $3,264,000
Regular Highways: $77,000
- Construction - General Public Buildings: $24,190,000
Toll Highways: $22,554,000
General Public Buildings: $21,809,000
Regular Highways: $14,505,000
Corrections - Other: $176,000
- Current Operations - General - Other: $17,190,000
Public Welfare Institutions: $14,241,000
Public Welfare - Other: $12,692,000
Public Welfare Institutions: $12,607,000
Police Protection: $12,352,000
Police Protection: $11,359,000
Correctional Institutions: $10,731,000
Correctional Institutions: $10,131,000
Financial Administration: $5,862,000
Toll Highways: $4,473,000
Public Welfare, Vendor Payments for Other Purposes: $3,773,000
Central Staff Services: $3,555,000
Judicial and Legal Services: $3,479,000
General Public Buildings: $3,273,000
Public Welfare, Vendor Payments for Other Purposes: $2,961,000
Housing and Community Development: $2,564,000
General Public Buildings: $2,533,000
Judicial and Legal Services: $2,511,000
Health - Other: $2,396,000
Corrections - Other: $2,381,000
Housing and Community Development: $2,345,000
Health - Other: $2,203,000
Financial Administration: $2,163,000
Regular Highways: $1,773,000
Libraries: $1,363,000
Libraries: $1,337,000
Solid Waste Management: $1,322,000
Solid Waste Management: $1,031,000
Public Welfare, Vendor Payments for Medical Care: $970,000
General - Other: $965,000
Natural Resources - Other: $940,000
Public Welfare, Vendor Payments for Medical Care: $533,000
Parks and Recreation: $390,000
Natural Resources - Other: $360,000
Parks and Recreation: $294,000
Central Staff Services: $272,000
- Federal Intergovernmental - Public Welfare: $5,455,000
Public Welfare: $5,066,000
Other: $1,524,000
General Local Government Support: $1,336,000
General Local Government Support: $1,252,000
Other: $1,126,000
Highways: $823,000
Highways: $541,000
Health and Hospitals: $322,000
Health and Hospitals: $295,000
Transit Utilities: $28,000
Transit Utilities: $26,000
Education: $2,000
- General - Interest on Debt: $1,339,000
Interest on Debt: $357,000
- Intergovernmental to Local - Other - Regular Highways: $832,000
Other - Regular Highways: $393,000
Other - Health - Other: $109,000
Other - Public Welfare - Other: $82,000
Other - Public Welfare - Other: $65,000
Other - Health - Other: $59,000
Other - Solid Waste Management: $21,000
Other - Solid Waste Management: $18,000
- Intergovernmental to State - Public Welfare: $688,000
Public Welfare: $512,000
Health - Other: $5,000
Health - Other: $2,000
- Local Intergovernmental - Highways: $6,018,000
Other: $965,000
Highways: $937,000
General Local Government Support: $59,000
General Local Government Support: $27,000
- Long Term Debt - Outstanding Unspecified Public Purpose: $47,300,000
Beginning Outstanding - Unspecified Public Purpose: $45,175,000
Beginning Outstanding - Public Debt for Private Purpose: $45,110,000
Outstanding Unspecified Public Purpose: $43,050,000
Outstanding Nonguaranteed - Industrial Revenue: $42,855,000
Issue, Unspecified Public Purpose: $39,136,000
Beginning Outstanding - Unspecified Public Purpose: $10,289,000
Beginning Outstanding - Public Debt for Private Purpose: $8,710,000
Outstanding Nonguaranteed - Industrial Revenue: $8,365,000
Retired Nonguaranteed - Public Debt for Private Purpose: $2,255,000
Retired Unspecified Public Purpose: $2,125,000
Retired Unspecified Public Purpose: $2,125,000
Retired Nonguaranteed - Public Debt for Private Purpose: $345,000
- Miscellaneous - General Revenue - Other: $11,339,000
Interest Earnings: $3,831,000
General Revenue - Other: $3,761,000
Interest Earnings: $1,488,000
Rents: $502,000
Rents: $309,000
Special Assessments: $194,000
Fines and Forfeits: $134,000
Fines and Forfeits: $129,000
Special Assessments: $121,000
Sale of Property: $117,000
Donations From Private Sources: $33,000
Donations From Private Sources: $23,000
- Other Capital Outlay - General - Other: $25,531,000
General Public Building: $4,675,000
General Public Building: $1,277,000
Toll Highways: $698,000
Police Protection: $637,000
Regular Highways: $624,000
Public Welfare Institutions: $470,000
Public Welfare - Other: $369,000
Police Protection: $215,000
Corrections - Other: $176,000
Corrections - Other: $174,000
Natural Resources - Other: $146,000
Financial Administration: $64,000
Public Welfare Institutions: $50,000
Central Staff Services: $42,000
Health - Other: $4,000
- Other Funds - Cash and Securities: $127,696,000
Cash and Securities: $34,000
- Sinking Funds - Cash and Securities: $43,000,000
Cash and Securities: $8,546,000
- State Intergovernmental - Other: $18,848,000
Highways: $9,477,000
Highways: $6,966,000
Public Welfare: $6,077,000
Public Welfare: $4,920,000
General Local Government Support: $4,147,000
Other: $3,149,000
General Local Government Support: $1,535,000
Transit Utilities: $825,000
Health and Hospitals: $588,000
Health and Hospitals: $461,000
Transit Utilities: $4,000
- Tax - Property: $54,687,000
Property: $47,548,000
Other: $143,000
Other: $126,000
Other License: $110,000
Other License: $89,000
Severance: $65,000
Other Selective Sales: $63,000
Alcoholic Beverage Sales: $25,000
Alcoholic Beverage License: $21,000
- Total Salaries and Wages: $47,985,000
: $47,985,000
Sherburne County government finances - Revenue in 2020:
- Bond Funds - Cash and Securities: $22,104,000
- Charges - Other: $11,911,000
Other: $5,966,000
Solid Waste Management: $3,264,000
Regular Highways: $77,000
- Construction - General Public Buildings: $24,190,000
Toll Highways: $22,554,000
General Public Buildings: $21,809,000
Regular Highways: $14,505,000
Corrections - Other: $176,000
- Current Operations - General - Other: $17,190,000
Public Welfare Institutions: $14,241,000
Public Welfare - Other: $12,692,000
Public Welfare Institutions: $12,607,000
Police Protection: $12,352,000
Police Protection: $11,359,000
Correctional Institutions: $10,731,000
Correctional Institutions: $10,131,000
Financial Administration: $5,862,000
Toll Highways: $4,473,000
Public Welfare, Vendor Payments for Other Purposes: $3,773,000
Central Staff Services: $3,555,000
Judicial and Legal Services: $3,479,000
General Public Buildings: $3,273,000
Public Welfare, Vendor Payments for Other Purposes: $2,961,000
Housing and Community Development: $2,564,000
General Public Buildings: $2,533,000
Judicial and Legal Services: $2,511,000
Health - Other: $2,396,000
Corrections - Other: $2,381,000
Housing and Community Development: $2,345,000
Health - Other: $2,203,000
Financial Administration: $2,163,000
Regular Highways: $1,773,000
Libraries: $1,363,000
Libraries: $1,337,000
Solid Waste Management: $1,322,000
Solid Waste Management: $1,031,000
Public Welfare, Vendor Payments for Medical Care: $970,000
General - Other: $965,000
Natural Resources - Other: $940,000
Public Welfare, Vendor Payments for Medical Care: $533,000
Parks and Recreation: $390,000
Natural Resources - Other: $360,000
Parks and Recreation: $294,000
Central Staff Services: $272,000
- Federal Intergovernmental - Public Welfare: $5,455,000
Public Welfare: $5,066,000
Other: $1,524,000
General Local Government Support: $1,336,000
General Local Government Support: $1,252,000
Other: $1,126,000
Highways: $823,000
Highways: $541,000
Health and Hospitals: $322,000
Health and Hospitals: $295,000
Transit Utilities: $28,000
Transit Utilities: $26,000
Education: $2,000
- General - Interest on Debt: $1,339,000
Interest on Debt: $357,000
- Intergovernmental to Local - Other - Regular Highways: $832,000
Other - Regular Highways: $393,000
Other - Health - Other: $109,000
Other - Public Welfare - Other: $82,000
Other - Public Welfare - Other: $65,000
Other - Health - Other: $59,000
Other - Solid Waste Management: $21,000
Other - Solid Waste Management: $18,000
- Intergovernmental to State - Public Welfare: $688,000
Public Welfare: $512,000
Health - Other: $5,000
Health - Other: $2,000
- Local Intergovernmental - Highways: $6,018,000
Other: $965,000
Highways: $937,000
General Local Government Support: $59,000
General Local Government Support: $27,000
- Long Term Debt - Outstanding Unspecified Public Purpose: $47,300,000
Beginning Outstanding - Unspecified Public Purpose: $45,175,000
Beginning Outstanding - Public Debt for Private Purpose: $45,110,000
Outstanding Unspecified Public Purpose: $43,050,000
Outstanding Nonguaranteed - Industrial Revenue: $42,855,000
Issue, Unspecified Public Purpose: $39,136,000
Beginning Outstanding - Unspecified Public Purpose: $10,289,000
Beginning Outstanding - Public Debt for Private Purpose: $8,710,000
Outstanding Nonguaranteed - Industrial Revenue: $8,365,000
Retired Nonguaranteed - Public Debt for Private Purpose: $2,255,000
Retired Unspecified Public Purpose: $2,125,000
Retired Unspecified Public Purpose: $2,125,000
Retired Nonguaranteed - Public Debt for Private Purpose: $345,000
- Miscellaneous - General Revenue - Other: $11,339,000
Interest Earnings: $3,831,000
General Revenue - Other: $3,761,000
Interest Earnings: $1,488,000
Rents: $502,000
Rents: $309,000
Special Assessments: $194,000
Fines and Forfeits: $134,000
Fines and Forfeits: $129,000
Special Assessments: $121,000
Sale of Property: $117,000
Donations From Private Sources: $33,000
Donations From Private Sources: $23,000
- Other Capital Outlay - General - Other: $25,531,000
General Public Building: $4,675,000
General Public Building: $1,277,000
Toll Highways: $698,000
Police Protection: $637,000
Regular Highways: $624,000
Public Welfare Institutions: $470,000
Public Welfare - Other: $369,000
Police Protection: $215,000
Corrections - Other: $176,000
Corrections - Other: $174,000
Natural Resources - Other: $146,000
Financial Administration: $64,000
Public Welfare Institutions: $50,000
Central Staff Services: $42,000
Health - Other: $4,000
- Other Funds - Cash and Securities: $127,696,000
Cash and Securities: $34,000
- Sinking Funds - Cash and Securities: $43,000,000
Cash and Securities: $8,546,000
- State Intergovernmental - Other: $18,848,000
Highways: $9,477,000
Highways: $6,966,000
Public Welfare: $6,077,000
Public Welfare: $4,920,000
General Local Government Support: $4,147,000
Other: $3,149,000
General Local Government Support: $1,535,000
Transit Utilities: $825,000
Health and Hospitals: $588,000
Health and Hospitals: $461,000
Transit Utilities: $4,000
- Tax - Property: $54,687,000
Property: $47,548,000
Other: $143,000
Other: $126,000
Other License: $110,000
Other License: $89,000
Severance: $65,000
Other Selective Sales: $63,000
Alcoholic Beverage Sales: $25,000
Alcoholic Beverage License: $21,000
- Total Salaries and Wages: $47,985,000
: $47,985,000
Sherburne County government finances - Debt in 2020:
- Bond Funds - Cash and Securities: $22,104,000
- Charges - Other: $11,911,000
Other: $5,966,000
Solid Waste Management: $3,264,000
Regular Highways: $77,000
- Construction - General Public Buildings: $24,190,000
Toll Highways: $22,554,000
General Public Buildings: $21,809,000
Regular Highways: $14,505,000
Corrections - Other: $176,000
- Current Operations - General - Other: $17,190,000
Public Welfare Institutions: $14,241,000
Public Welfare - Other: $12,692,000
Public Welfare Institutions: $12,607,000
Police Protection: $12,352,000
Police Protection: $11,359,000
Correctional Institutions: $10,731,000
Correctional Institutions: $10,131,000
Financial Administration: $5,862,000
Toll Highways: $4,473,000
Public Welfare, Vendor Payments for Other Purposes: $3,773,000
Central Staff Services: $3,555,000
Judicial and Legal Services: $3,479,000
General Public Buildings: $3,273,000
Public Welfare, Vendor Payments for Other Purposes: $2,961,000
Housing and Community Development: $2,564,000
General Public Buildings: $2,533,000
Judicial and Legal Services: $2,511,000
Health - Other: $2,396,000
Corrections - Other: $2,381,000
Housing and Community Development: $2,345,000
Health - Other: $2,203,000
Financial Administration: $2,163,000
Regular Highways: $1,773,000
Libraries: $1,363,000
Libraries: $1,337,000
Solid Waste Management: $1,322,000
Solid Waste Management: $1,031,000
Public Welfare, Vendor Payments for Medical Care: $970,000
General - Other: $965,000
Natural Resources - Other: $940,000
Public Welfare, Vendor Payments for Medical Care: $533,000
Parks and Recreation: $390,000
Natural Resources - Other: $360,000
Parks and Recreation: $294,000
Central Staff Services: $272,000
- Federal Intergovernmental - Public Welfare: $5,455,000
Public Welfare: $5,066,000
Other: $1,524,000
General Local Government Support: $1,336,000
General Local Government Support: $1,252,000
Other: $1,126,000
Highways: $823,000
Highways: $541,000
Health and Hospitals: $322,000
Health and Hospitals: $295,000
Transit Utilities: $28,000
Transit Utilities: $26,000
Education: $2,000
- General - Interest on Debt: $1,339,000
Interest on Debt: $357,000
- Intergovernmental to Local - Other - Regular Highways: $832,000
Other - Regular Highways: $393,000
Other - Health - Other: $109,000
Other - Public Welfare - Other: $82,000
Other - Public Welfare - Other: $65,000
Other - Health - Other: $59,000
Other - Solid Waste Management: $21,000
Other - Solid Waste Management: $18,000
- Intergovernmental to State - Public Welfare: $688,000
Public Welfare: $512,000
Health - Other: $5,000
Health - Other: $2,000
- Local Intergovernmental - Highways: $6,018,000
Other: $965,000
Highways: $937,000
General Local Government Support: $59,000
General Local Government Support: $27,000
- Long Term Debt - Outstanding Unspecified Public Purpose: $47,300,000
Beginning Outstanding - Unspecified Public Purpose: $45,175,000
Beginning Outstanding - Public Debt for Private Purpose: $45,110,000
Outstanding Unspecified Public Purpose: $43,050,000
Outstanding Nonguaranteed - Industrial Revenue: $42,855,000
Issue, Unspecified Public Purpose: $39,136,000
Beginning Outstanding - Unspecified Public Purpose: $10,289,000
Beginning Outstanding - Public Debt for Private Purpose: $8,710,000
Outstanding Nonguaranteed - Industrial Revenue: $8,365,000
Retired Nonguaranteed - Public Debt for Private Purpose: $2,255,000
Retired Unspecified Public Purpose: $2,125,000
Retired Unspecified Public Purpose: $2,125,000
Retired Nonguaranteed - Public Debt for Private Purpose: $345,000
- Miscellaneous - General Revenue - Other: $11,339,000
Interest Earnings: $3,831,000
General Revenue - Other: $3,761,000
Interest Earnings: $1,488,000
Rents: $502,000
Rents: $309,000
Special Assessments: $194,000
Fines and Forfeits: $134,000
Fines and Forfeits: $129,000
Special Assessments: $121,000
Sale of Property: $117,000
Donations From Private Sources: $33,000
Donations From Private Sources: $23,000
- Other Capital Outlay - General - Other: $25,531,000
General Public Building: $4,675,000
General Public Building: $1,277,000
Toll Highways: $698,000
Police Protection: $637,000
Regular Highways: $624,000
Public Welfare Institutions: $470,000
Public Welfare - Other: $369,000
Police Protection: $215,000
Corrections - Other: $176,000
Corrections - Other: $174,000
Natural Resources - Other: $146,000
Financial Administration: $64,000
Public Welfare Institutions: $50,000
Central Staff Services: $42,000
Health - Other: $4,000
- Other Funds - Cash and Securities: $127,696,000
Cash and Securities: $34,000
- Sinking Funds - Cash and Securities: $43,000,000
Cash and Securities: $8,546,000
- State Intergovernmental - Other: $18,848,000
Highways: $9,477,000
Highways: $6,966,000
Public Welfare: $6,077,000
Public Welfare: $4,920,000
General Local Government Support: $4,147,000
Other: $3,149,000
General Local Government Support: $1,535,000
Transit Utilities: $825,000
Health and Hospitals: $588,000
Health and Hospitals: $461,000
Transit Utilities: $4,000
- Tax - Property: $54,687,000
Property: $47,548,000
Other: $143,000
Other: $126,000
Other License: $110,000
Other License: $89,000
Severance: $65,000
Other Selective Sales: $63,000
Alcoholic Beverage Sales: $25,000
Alcoholic Beverage License: $21,000
- Total Salaries and Wages: $47,985,000
: $47,985,000
Sherburne County government finances - Cash and Securities in 2020:
- Bond Funds - Cash and Securities: $22,104,000
- Charges - Other: $11,911,000
Other: $5,966,000
Solid Waste Management: $3,264,000
Regular Highways: $77,000
- Construction - General Public Buildings: $24,190,000
Toll Highways: $22,554,000
General Public Buildings: $21,809,000
Regular Highways: $14,505,000
Corrections - Other: $176,000
- Current Operations - General - Other: $17,190,000
Public Welfare Institutions: $14,241,000
Public Welfare - Other: $12,692,000
Public Welfare Institutions: $12,607,000
Police Protection: $12,352,000
Police Protection: $11,359,000
Correctional Institutions: $10,731,000
Correctional Institutions: $10,131,000
Financial Administration: $5,862,000
Toll Highways: $4,473,000
Public Welfare, Vendor Payments for Other Purposes: $3,773,000
Central Staff Services: $3,555,000
Judicial and Legal Services: $3,479,000
General Public Buildings: $3,273,000
Public Welfare, Vendor Payments for Other Purposes: $2,961,000
Housing and Community Development: $2,564,000
General Public Buildings: $2,533,000
Judicial and Legal Services: $2,511,000
Health - Other: $2,396,000
Corrections - Other: $2,381,000
Housing and Community Development: $2,345,000
Health - Other: $2,203,000
Financial Administration: $2,163,000
Regular Highways: $1,773,000
Libraries: $1,363,000
Libraries: $1,337,000
Solid Waste Management: $1,322,000
Solid Waste Management: $1,031,000
Public Welfare, Vendor Payments for Medical Care: $970,000
General - Other: $965,000
Natural Resources - Other: $940,000
Public Welfare, Vendor Payments for Medical Care: $533,000
Parks and Recreation: $390,000
Natural Resources - Other: $360,000
Parks and Recreation: $294,000
Central Staff Services: $272,000
- Federal Intergovernmental - Public Welfare: $5,455,000
Public Welfare: $5,066,000
Other: $1,524,000
General Local Government Support: $1,336,000
General Local Government Support: $1,252,000
Other: $1,126,000
Highways: $823,000
Highways: $541,000
Health and Hospitals: $322,000
Health and Hospitals: $295,000
Transit Utilities: $28,000
Transit Utilities: $26,000
Education: $2,000
- General - Interest on Debt: $1,339,000
Interest on Debt: $357,000
- Intergovernmental to Local - Other - Regular Highways: $832,000
Other - Regular Highways: $393,000
Other - Health - Other: $109,000
Other - Public Welfare - Other: $82,000
Other - Public Welfare - Other: $65,000
Other - Health - Other: $59,000
Other - Solid Waste Management: $21,000
Other - Solid Waste Management: $18,000
- Intergovernmental to State - Public Welfare: $688,000
Public Welfare: $512,000
Health - Other: $5,000
Health - Other: $2,000
- Local Intergovernmental - Highways: $6,018,000
Other: $965,000
Highways: $937,000
General Local Government Support: $59,000
General Local Government Support: $27,000
- Long Term Debt - Outstanding Unspecified Public Purpose: $47,300,000
Beginning Outstanding - Unspecified Public Purpose: $45,175,000
Beginning Outstanding - Public Debt for Private Purpose: $45,110,000
Outstanding Unspecified Public Purpose: $43,050,000
Outstanding Nonguaranteed - Industrial Revenue: $42,855,000
Issue, Unspecified Public Purpose: $39,136,000
Beginning Outstanding - Unspecified Public Purpose: $10,289,000
Beginning Outstanding - Public Debt for Private Purpose: $8,710,000
Outstanding Nonguaranteed - Industrial Revenue: $8,365,000
Retired Nonguaranteed - Public Debt for Private Purpose: $2,255,000
Retired Unspecified Public Purpose: $2,125,000
Retired Unspecified Public Purpose: $2,125,000
Retired Nonguaranteed - Public Debt for Private Purpose: $345,000
- Miscellaneous - General Revenue - Other: $11,339,000
Interest Earnings: $3,831,000
General Revenue - Other: $3,761,000
Interest Earnings: $1,488,000
Rents: $502,000
Rents: $309,000
Special Assessments: $194,000
Fines and Forfeits: $134,000
Fines and Forfeits: $129,000
Special Assessments: $121,000
Sale of Property: $117,000
Donations From Private Sources: $33,000
Donations From Private Sources: $23,000
- Other Capital Outlay - General - Other: $25,531,000
General Public Building: $4,675,000
General Public Building: $1,277,000
Toll Highways: $698,000
Police Protection: $637,000
Regular Highways: $624,000
Public Welfare Institutions: $470,000
Public Welfare - Other: $369,000
Police Protection: $215,000
Corrections - Other: $176,000
Corrections - Other: $174,000
Natural Resources - Other: $146,000
Financial Administration: $64,000
Public Welfare Institutions: $50,000
Central Staff Services: $42,000
Health - Other: $4,000
- Other Funds - Cash and Securities: $127,696,000
Cash and Securities: $34,000
- Sinking Funds - Cash and Securities: $43,000,000
Cash and Securities: $8,546,000
- State Intergovernmental - Other: $18,848,000
Highways: $9,477,000
Highways: $6,966,000
Public Welfare: $6,077,000
Public Welfare: $4,920,000
General Local Government Support: $4,147,000
Other: $3,149,000
General Local Government Support: $1,535,000
Transit Utilities: $825,000
Health and Hospitals: $588,000
Health and Hospitals: $461,000
Transit Utilities: $4,000
- Tax - Property: $54,687,000
Property: $47,548,000
Other: $143,000
Other: $126,000
Other License: $110,000
Other License: $89,000
Severance: $65,000
Other Selective Sales: $63,000
Alcoholic Beverage Sales: $25,000
Alcoholic Beverage License: $21,000
- Total Salaries and Wages: $47,985,000
: $47,985,000
Supplemental Security Income (SSI) in 2006:
- Total number of recipients: 471
- Number of aged recipients: 47
- Number of blind and disabled recipients: 424
- Number of recipients under 18: 86
- Number of recipients between 18 and 64: 300
- Number of recipients older than 64: 85
- Number of recipients also receiving OASDI: 153
- Amount of payments (thousands of dollars): 211
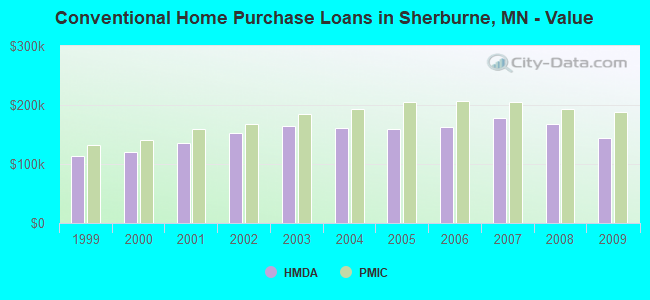
| Home Mortgage Disclosure Act Aggregated Statistics For Year 2009 (Based on 8 full tracts) | ||||||||||||||
| A) FHA, FSA/RHS & VA Home Purchase Loans | B) Conventional Home Purchase Loans | C) Refinancings | D) Home Improvement Loans | E) Loans on Dwellings For 5+ Families | F) Non-occupant Loans on < 5 Family Dwellings (A B C & D) | G) Loans On Manufactured Home Dwelling (A B C & D) | ||||||||
|---|---|---|---|---|---|---|---|---|---|---|---|---|---|---|
| Number | Average Value | Number | Average Value | Number | Average Value | Number | Average Value | Number | Average Value | Number | Average Value | Number | Average Value | |
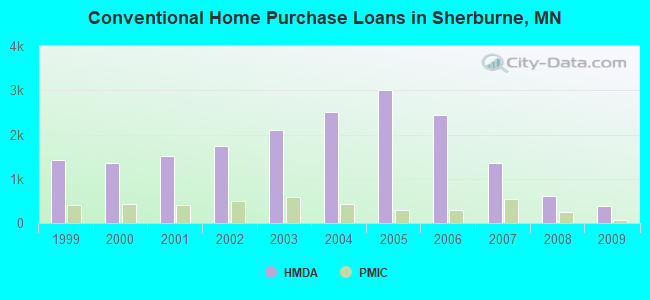
| LOANS ORIGINATED | 823 | $153,384 | 387 | $143,948 | 2,249 | $182,558 | 122 | $74,754 | 8 | $844,250 | 155 | $130,652 | 15 | $93,667 |
| APPLICATIONS APPROVED, NOT ACCEPTED | 33 | $162,061 | 31 | $172,903 | 208 | $188,553 | 13 | $69,846 | 0 | $0 | 9 | $139,222 | 4 | $73,750 |
| APPLICATIONS DENIED | 113 | $164,053 | 65 | $147,415 | 803 | $204,996 | 66 | $62,197 | 0 | $0 | 39 | $138,897 | 10 | $53,400 |
| APPLICATIONS WITHDRAWN | 59 | $154,441 | 50 | $135,320 | 532 | $195,237 | 37 | $91,027 | 0 | $0 | 25 | $133,960 | 2 | $179,500 |
| FILES CLOSED FOR INCOMPLETENESS | 19 | $165,263 | 6 | $207,000 | 141 | $177,894 | 12 | $86,833 | 0 | $0 | 3 | $55,000 | 1 | $1,000 |
| Private Mortgage Insurance Companies Aggregated Statistics For Year 2009 (Based on 8 full tracts) | ||||||
| A) Conventional Home Purchase Loans | B) Refinancings | C) Non-occupant Loans on < 5 Family Dwellings (A & B) | ||||
|---|---|---|---|---|---|---|
| Number | Average Value | Number | Average Value | Number | Average Value | |
| LOANS ORIGINATED | 67 | $188,582 | 65 | $236,169 | 3 | $98,000 |
| APPLICATIONS APPROVED, NOT ACCEPTED | 22 | $193,545 | 20 | $263,400 | 1 | $224,000 |
| APPLICATIONS DENIED | 15 | $206,333 | 14 | $240,857 | 0 | $0 |
| APPLICATIONS WITHDRAWN | 4 | $175,750 | 7 | $236,286 | 0 | $0 |
| FILES CLOSED FOR INCOMPLETENESS | 2 | $209,000 | 0 | $0 | 0 | $0 |
| Most common first names in Sherburne County, MN among deceased individuals | ||
| Name | Count | Lived (average) |
|---|---|---|
| John | 114 | 75.7 years |
| Robert | 82 | 71.7 years |
| William | 78 | 77.6 years |
| Mary | 77 | 79.9 years |
| James | 68 | 68.4 years |
| Donald | 66 | 69.3 years |
| Dorothy | 56 | 79.9 years |
| George | 53 | 77.0 years |
| Charles | 52 | 76.0 years |
| Margaret | 52 | 80.6 years |
| Most common last names in Sherburne County, MN among deceased individuals | ||
| Last name | Count | Lived (average) |
|---|---|---|
| Johnson | 117 | 75.5 years |
| Peterson | 71 | 78.7 years |
| Olson | 70 | 76.8 years |
| Anderson | 69 | 80.6 years |
| Nelson | 40 | 72.7 years |
| Smith | 31 | 75.7 years |
| Hanson | 30 | 80.4 years |
| Larson | 30 | 80.0 years |
| Erickson | 27 | 79.3 years |
| Brown | 23 | 68.2 years |
| Businesses in Sherburne County, MN | ||||
| Name | Count | Name | Count | |
|---|---|---|---|---|
| Advance Auto Parts | 1 | Lane Furniture | 1 | |
| Applebee's | 1 | Little Caesars Pizza | 1 | |
| Arby's | 1 | Long John Silver's | 1 | |
| Buffalo Wild Wings | 1 | MasterBrand Cabinets | 8 | |
| Burger King | 1 | Maurices | 1 | |
| Caribou Coffee | 4 | McDonald's | 4 | |
| Chipotle | 1 | Menards | 1 | |
| Circle K | 3 | Nike | 1 | |
| Cold Stone Creamery | 1 | OfficeMax | 1 | |
| Curves | 1 | Panera Bread | 1 | |
| DHL | 1 | Payless | 1 | |
| Dairy Queen | 3 | Pizza Hut | 1 | |
| Dennys | 1 | RadioShack | 1 | |
| Domino's Pizza | 2 | SONIC Drive-In | 1 | |
| Famous Footwear | 1 | Sprint Nextel | 1 | |
| Fashion Bug | 1 | Starbucks | 1 | |
| FedEx | 6 | Subway | 6 | |
| Ford | 1 | Super 8 | 1 | |
| GNC | 1 | T-Mobile | 4 | |
| GameStop | 1 | Taco Bell | 1 | |
| Goodwill | 1 | Target | 1 | |
| H&R Block | 1 | True Value | 2 | |
| Hardee's | 2 | U-Haul | 4 | |
| Holiday Inn | 1 | UPS | 6 | |
| Home Depot | 1 | Verizon Wireless | 1 | |
| Jones New York | 1 | Walgreens | 1 | |
| KFC | 1 | Walmart | 1 | |
| Kincaid | 1 | YMCA | 1 | |
Sherburne County on our top lists:
- #39 on the list of "Top 101 counties with the lowest number of deaths per 1000 residents 2007-2013 (pop. 50,000+)"
- #51 on the list of "Top 101 counties with the lowest total withdrawal of fresh water for public supply (pop. 50,000+)"
- #53 on the list of "Top 101 counties with the largest number of children under 18 without health insurance coverage in 2000 (pop. 50,000+)"
- #95 on the list of "Top 101 counties with the lowest number of deaths per 1000 residents 2007-2013"