Mineral County, Colorado (CO)
County owner-occupied free and clear houses and condos in 2010: 152
County owner-occupied houses and condos in 2000: 276
Renter-occupied apartments: 61 (it was 101 in 2000)
| % of renters here: | 27% |
| State: | 34% |
Land area: 876 sq. mi.
Water area: 2.0 sq. mi.
Population density: 1 people per square mile (very low).
Industries providing employment: Educational, health and social services (24.4%), Arts, entertainment, recreation, accommodation and food services (19.3%), Construction (18.6%), Retail trade (10.1%).
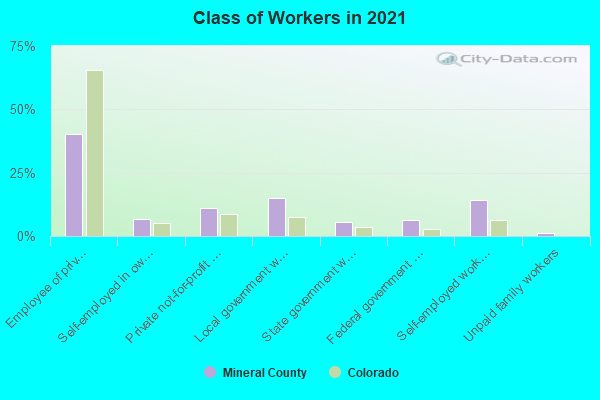
Type of workers:
- Private wage or salary: 57%
- Government: 30%
- Self-employed, not incorporated: 12%
- Unpaid family work: 1%
- OSM Map
- General Map
- Google Map
- MSN Map

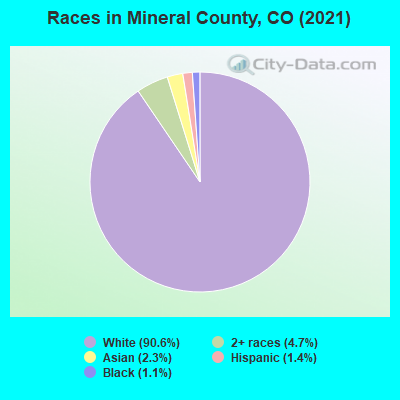
- 73192.2%White Non-Hispanic Alone
- 354.4%Two or more races
- 212.6%Hispanic or Latino
- 60.8%Asian alone
| Median resident age: | 55.3 years |
| Colorado median age: | 37.7 years |
| Males: 399 | |
| Females: 404 |

 | Lake City, Colorado (31 replies) |
| homesteading the San Luis valley, co (395 replies) |
| Weld county leading the charge for a new state (138 replies) |
| Creede Colorado (6 replies) |
| Your favorite Colorado places (33 replies) |
| An Alternative View of Prosperity (39 replies) |
| Mineral County: | 2.0 people |
| Colorado: | 2 people |
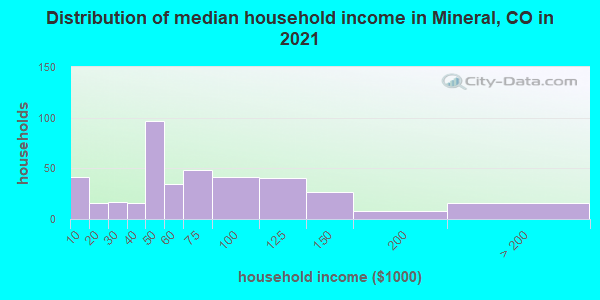
Estimated median household income in 2022: $60,075 ($34,844 in 1999)
| This county: | $60,075 |
| Colorado: | $89,302 |
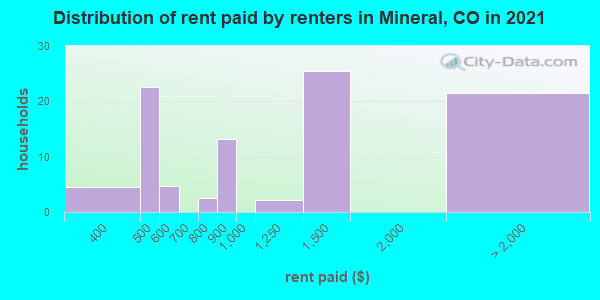
Median contract rent in 2022 for apartments: $702 (lower quartile is $498, upper quartile is $1,328)
| This county: | $702 |
| State: | $1513 |
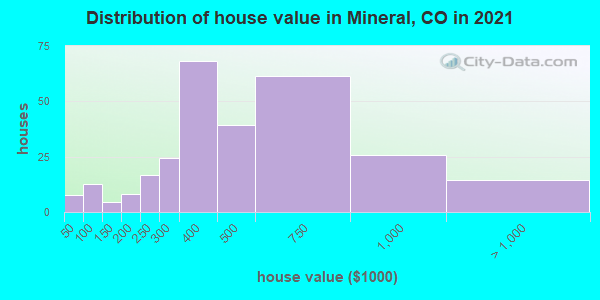
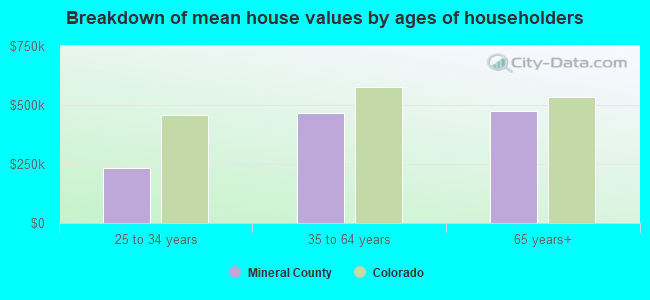
Estimated median house or condo value in 2022: $432,039 (it was $129,000 in 2000)
| Mineral: | $432,039 |
| Colorado: | $531,100 |
Mean price in 2022:
Median monthly housing costs for homes and condos with a mortgage: $1,684Detached houses: $480,210
Here: $480,210 State: $676,667 Mobile homes: $94,175
Here: $94,175 State: $115,510
Median monthly housing costs for units without a mortgage: $569
Institutionalized population: 0
Crime in 2018 (reported by the sheriff's office or county police, not the county total):
- Murders: 0
- Rapes: 0
- Robberies: 0
- Assaults: 1
- Burglaries: 0
- Thefts: 0
- Auto thefts: 0
Crime in 2017 (reported by the sheriff's office or county police, not the county total):
- Murders: 0
- Rapes: 0
- Robberies: 0
- Assaults: 1
- Burglaries: 0
- Thefts: 0
- Auto thefts: 0
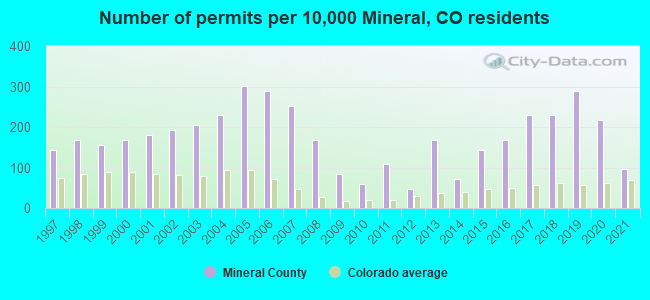
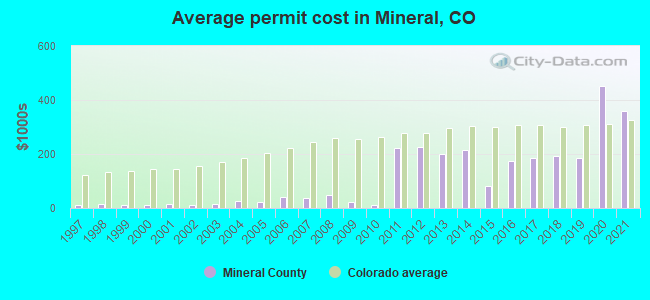
Single-family new house construction building permits:
- 2022: 9 buildings, average cost: $421,300
- 2021: 8 buildings, average cost: $361,300
- 2020: 18 buildings, average cost: $449,600
- 2019: 24 buildings, average cost: $183,800
- 2018: 19 buildings, average cost: $192,600
- 2017: 19 buildings, average cost: $183,700
- 2016: 14 buildings, average cost: $174,100
- 2015: 12 buildings, average cost: $81,300
- 2014: 6 buildings, average cost: $212,800
- 2013: 14 buildings, average cost: $201,300
- 2012: 4 buildings, average cost: $225,100
- 2011: 9 buildings, average cost: $222,100
- 2010: 5 buildings, average cost: $10,800
- 2009: 7 buildings, average cost: $24,300
- 2008: 14 buildings, average cost: $49,900
- 2007: 21 buildings, average cost: $35,500
- 2006: 24 buildings, average cost: $41,200
- 2005: 25 buildings, average cost: $21,100
- 2004: 19 buildings, average cost: $24,900
- 2003: 17 buildings, average cost: $13,000
- 2002: 16 buildings, average cost: $12,400
- 2001: 15 buildings, average cost: $14,600
- 2000: 14 buildings, average cost: $10,800
- 1999: 13 buildings, average cost: $10,800
- 1998: 14 buildings, average cost: $14,900
- 1997: 12 buildings, average cost: $10,800
Median real estate property taxes paid for housing units with mortgages in 2022: $1,545 (0.3%)
Median real estate property taxes paid for housing units with no mortgage in 2022: $1,535 (0.4%)
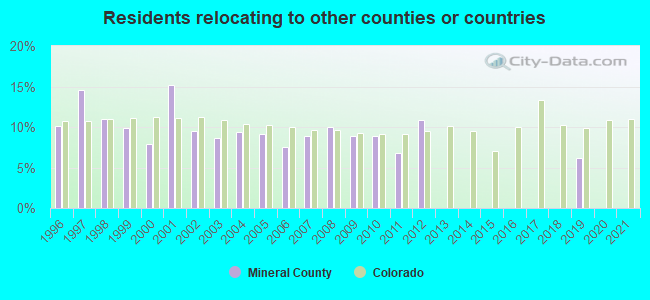
| Mineral County: | 11.1% |
| Colorado: | 9.4% |
Median age of residents in 2022: 55.3 years old
(Males: 59.1 years old, Females: 54.4 years old)
(Median age for: White residents: 55.1 years old, Hispanic or Latino residents: 60.8 years old)
Fair market rent in 2006 for a 1-bedroom apartment in Mineral County is $771 a month.
Fair market rent for a 2-bedroom apartment is $931 a month.
Fair market rent for a 3-bedroom apartment is $1159 a month.
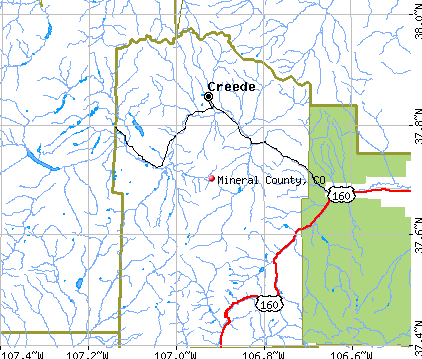
Cities in this county include: Creede, City of Creede.
Neighboring counties: Accomack County, Virginia  , Casey County, Kentucky , Cumberland County, Virginia , Harrison County, Indiana , San Juan County
  , Spotsylvania County, Virginia , Rockcastle County, Kentucky , Lexington city, Virginia .
| Here: | 2.0% |
| Colorado: | 3.2% |
Current college students: 25
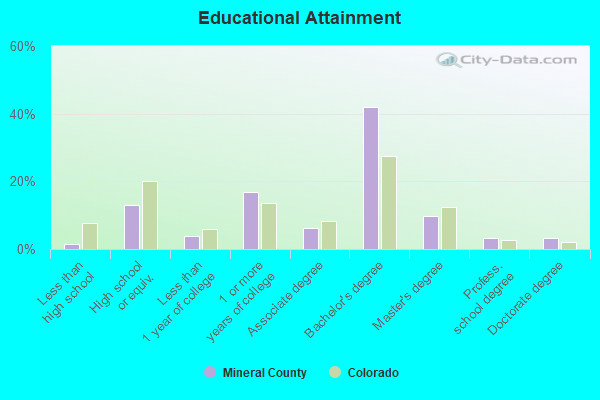
People 25 years of age or older with a high school degree or higher: 97.8%
People 25 years of age or older with a bachelor's degree or higher: 57.7%
Number of foreign born residents: 5 (102.3% naturalized citizens)
| Mineral County: | 0.6% |
| Whole state: | 9.5% |
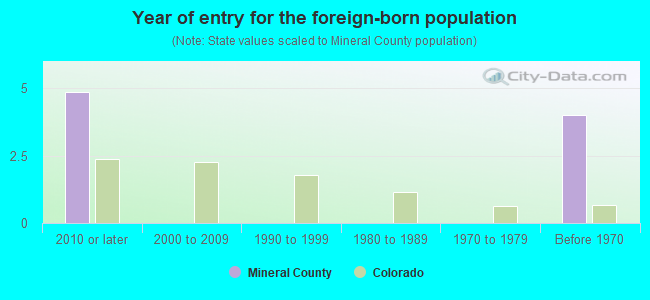
- Year of entry for the foreign-born population
- 62010 or later
- 02000 to 2009
- 01990 to 1999
- 01980 to 1989
- 01970 to 1979
- 4Before 1970
Mean travel time to work (commute): minutes
Percentage of county residents living and working in this county: 99.3%


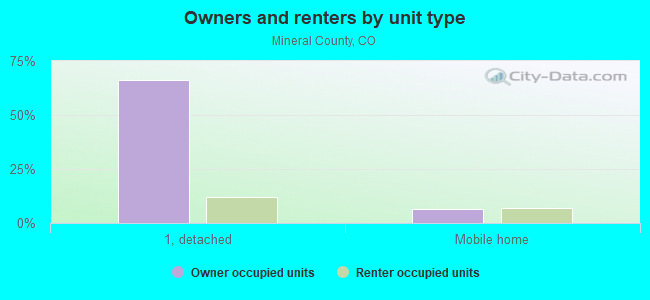
Housing units in structures:
- One, detached: 1,134
- One, attached: 6
- Two: 5
- 3 or 4: 29
- Mobile homes: 114
Housing units in Mineral County with a mortgage: 156 (0 second mortgage, 0 home equity loan, 0 both second mortgage and home equity loan)
Houses without a mortgage: 0
| Here: | 100.0% with mortgage |
| State: | 98.2% with mortgage |
Religion statistics for Mineral County
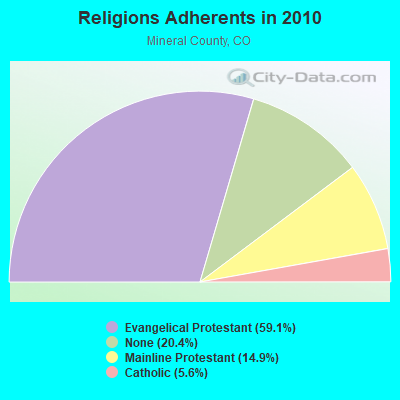
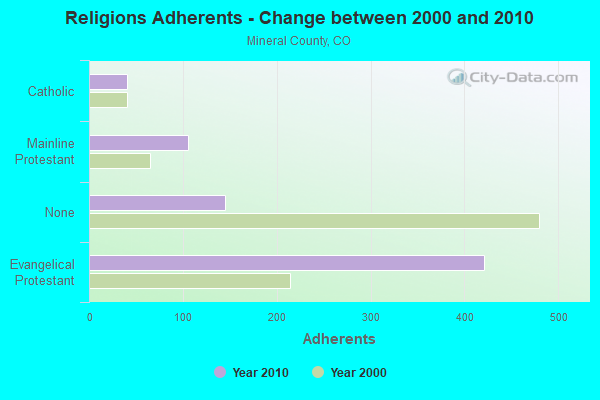
| Religion | Adherents | Congregations |
|---|---|---|
| Evangelical Protestant | 421 | 2 |
| Mainline Protestant | 106 | 2 |
| Catholic | 40 | 1 |
| None | 145 | - |
Source: Clifford Grammich, Kirk Hadaway, Richard Houseal, Dale E.Jones, Alexei Krindatch, Richie Stanley and Richard H.Taylor. 2012. 2010 U.S.Religion Census: Religious Congregations & Membership Study. Association of Statisticians of American Religious Bodies. Jones, Dale E., et al. 2002. Congregations and Membership in the United States 2000. Nashville, TN: Glenmary Research Center.
Food Environment Statistics:
| Mineral County: | 10.42 / 10,000 pop. |
| State: | 1.50 / 10,000 pop. |
| This county: | 52.08 / 10,000 pop. |
| State: | 8.99 / 10,000 pop. |
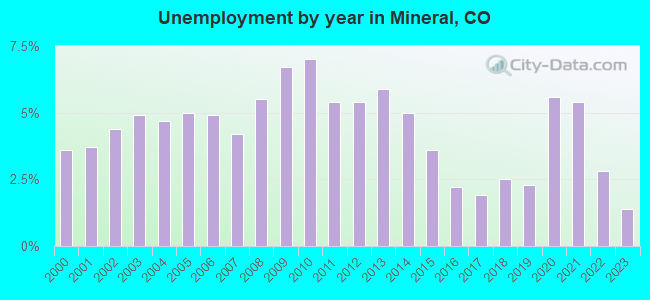
| Mineral County: | 6.1% |
| Colorado: | 5.3% |
| Mineral County: | 18.1% |
| State: | 18.4% |
Agriculture in Mineral County:
Average size of farms: 317 acresAverage value of agricultural products sold per farm: $11,856
The value of nursery, greenhouse, floriculture, and sod as a percentage of the total market value of agricultural products sold: 0.00%
Average total farm production expenses per farm: $22,186
Average market value of all machinery and equipment per farm: $20,263
The percentage of farms operated by a family or individual: 64.29%
Average age of principal farm operators: 65 years
Average number of cattle and calves per 100 acres of all land in farms: 16.73
Earthquake activity:
Mineral County-area historical earthquake activity is significantly above Colorado state average. It is 1009% greater than the overall U.S. average.On 8/18/1959 at 06:37:13, a magnitude 7.7 (7.7 UK, Class: Major, Intensity: VIII - XII) earthquake occurred 513.0 miles away from Mineral County center, causing $26,000,000 total damage
On 8/23/2011 at 05:46:18, a magnitude 5.3 (5.3 MW, Depth: 2.5 mi, Class: Moderate, Intensity: VI - VII) earthquake occurred 129.7 miles away from the county center
On 8/10/2005 at 22:08:22, a magnitude 5.0 (5.0 MW, Depth: 3.1 mi) earthquake occurred 126.1 miles away from the county center
On 6/28/1992 at 11:57:34, a magnitude 7.6 (6.2 MB, 7.6 MS, 7.3 MW, Depth: 0.7 mi) earthquake occurred 590.2 miles away from the county center, causing 3 deaths (1 shaking deaths, 2 other deaths) and 400 injuries, causing $100,000,000 total damage and $40,000,000 insured losses
On 8/10/2005 at 22:08:22, a magnitude 5.0 (5.0 MB, 4.7 MS, 5.0 MW) earthquake occurred 130.2 miles away from Mineral County center
On 10/3/1915 at 06:52:48, a magnitude 7.6 (7.6 UK) earthquake occurred 599.5 miles away from the county center
Magnitude types: body-wave magnitude (MB), surface-wave magnitude (MS), moment magnitude (MW)
Most recent natural disasters:
- Colorado Covid-19 Pandemic, Incident Period: January 20, 2020, FEMA Id: 4498, Natural disaster type: Other
- Colorado Hurricane Katrina Evacuation, Incident Period: August 29, 2005 to October 01, 2005, Emergency Declared EM-3224: September 05, 2005, FEMA Id: 3224, Natural disaster type: Hurricane
- Colorado Wildfires, Incident Period: April 23, 2002 to August 06, 2002, Major Disaster (Presidential) Declared DR-1421: June 19, 2002, FEMA Id: 1421, Natural disaster type: Fire
- Colorado Drought, Incident Period: January 29, 1977, Emergency Declared EM-3025: January 29, 1977, FEMA Id: 3025, Natural disaster type: Drought
- Colorado FLOODING, LANDSLIDES, Incident Period: July 06, 1973, Major Disaster (Presidential) Declared DR-396: July 06, 1973, FEMA Id: 396, Natural disaster type: Landslide, Flood
- Colorado Heavy Rains, Flooding, Incident Period: September 22, 1970, Major Disaster (Presidential) Declared DR-293: September 22, 1970, FEMA Id: 293, Natural disaster type: Flood, Heavy Rain
The number of natural disasters in Mineral County (6) is a lot smaller than the US average (15).
Major Disasters (Presidential) Declared: 3
Emergencies Declared: 2
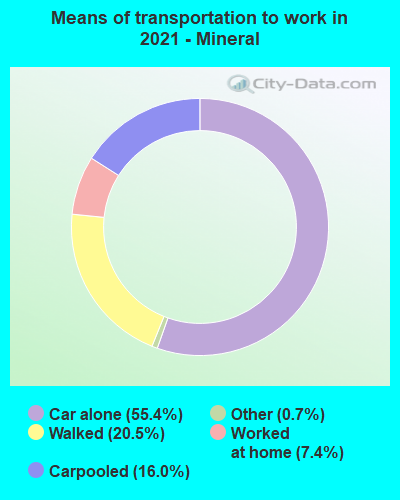
Means of transportation to work:
- Drove a car alone: 261 (58.4%)
- Carpooled: 57 (12.8%)
- Taxicab, motorcycle, or other means: 2 (0.4%)
- Walked: 70 (15.7%)
- Worked at home: 46 (10.3%)
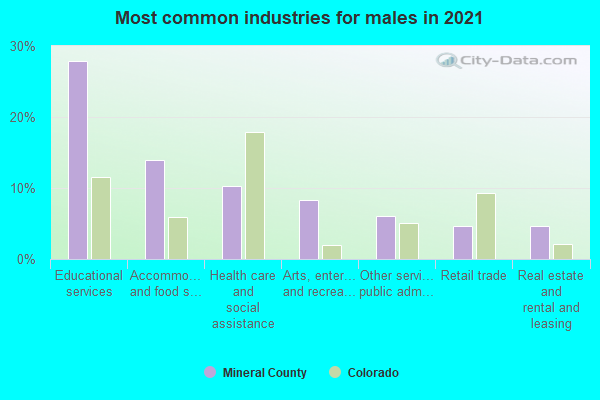
- Educational services (27%)
- Arts, entertainment, and recreation (14%)
- Health care and social assistance (11%)
- Retail trade (7%)
- Accommodation and food services (7%)
- Real estate and rental and leasing (5%)
- Other services, except public administration (5%)
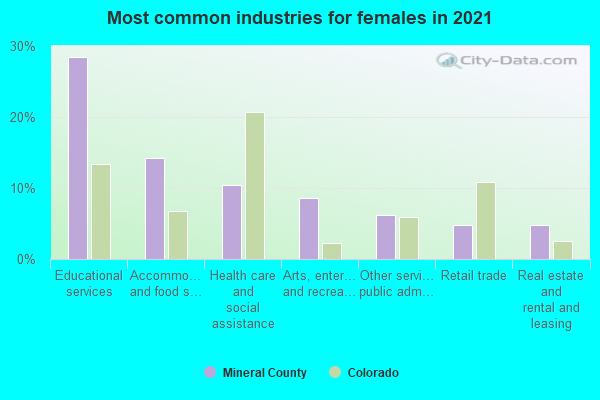
- Educational services (29%)
- Arts, entertainment, and recreation (15%)
- Health care and social assistance (12%)
- Retail trade (8%)
- Accommodation and food services (8%)
- Real estate and rental and leasing (6%)
- Other services, except public administration (5%)
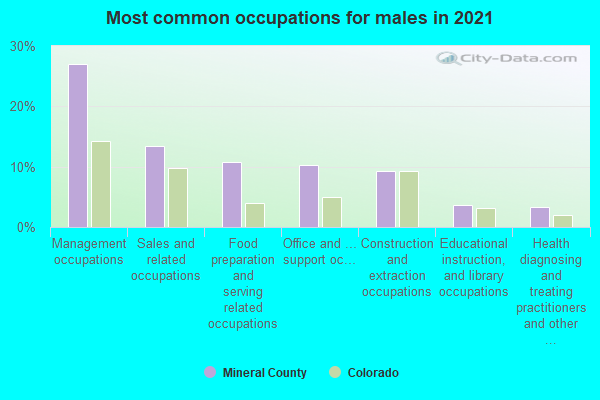
- Management occupations (28%)
- Sales and related occupations (14%)
- Office and administrative support occupations (10%)
- Construction and extraction occupations (10%)
- Food preparation and serving related occupations (8%)
- Educational instruction, and library occupations (5%)
- Arts, design, entertainment, sports, and media occupations (3%)
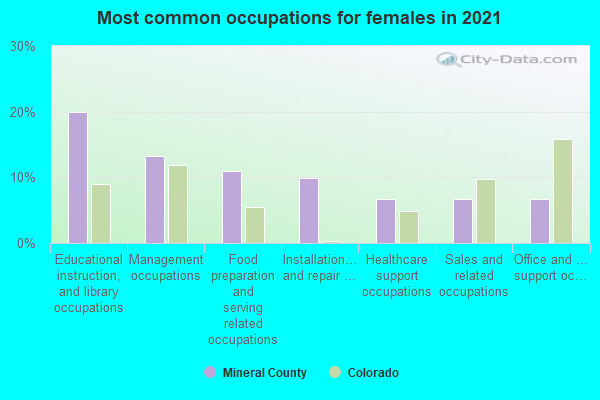
- Educational instruction, and library occupations (20%)
- Installation, maintenance, and repair occupations (16%)
- Management occupations (15%)
- Sales and related occupations (10%)
- Office and administrative support occupations (8%)
- Healthcare support occupations (5%)
- Life, physical, and social science occupations (5%)
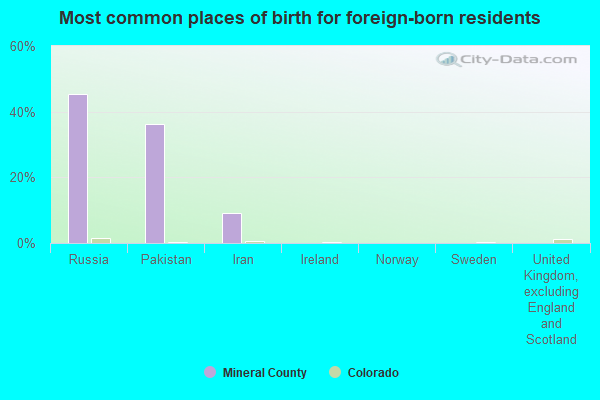
- Russia (80%)
- Denmark (0%)
- Ireland (0%)
- Norway (0%)
- Sweden (0%)
- United Kingdom, excluding England and Scotland (0%)
- England (0%)
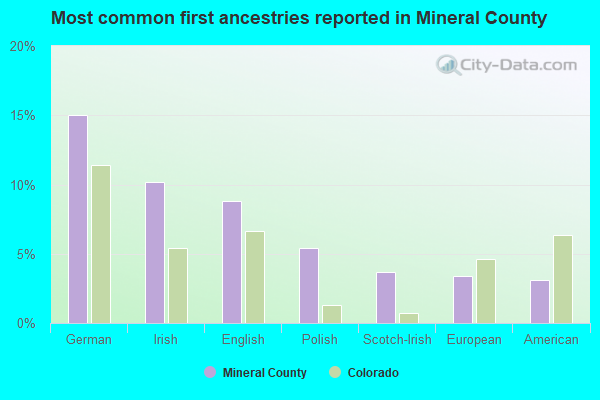
- German (17%)
- English (12%)
- Polish (6%)
- Irish (6%)
- Scotch-Irish (5%)
- British (5%)
- American (4%)
10 or fewer of this county's residents relocated from other counties between 2020 and 2021.1,000 average adjusted gross income)
10 or fewer of this county's residents moved from foreign countries.
10 or fewer of this county's residents relocated from other counties in Colorado.
10 or fewer of this county's residents relocated from other states.

10 or fewer of this county's residents relocated to other counties between 2020 and 2021.1,000 average adjusted gross income)
10 or fewer of this county's residents moved to foreign countries.
10 or fewer of this county's residents relocated to other counties in Colorado.
10 or fewer of this county's residents relocated to other states.
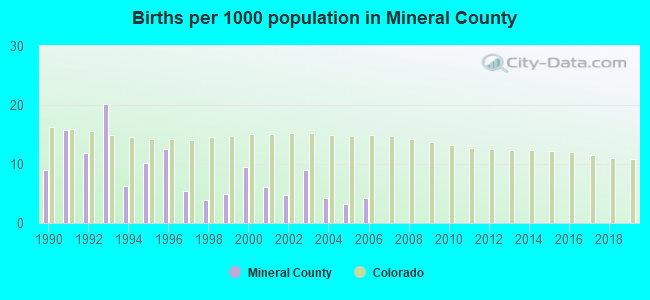
Births per 1000 population from 1990 to 1999: 10.0
Births per 1000 population from 2000 to 2006: 5.9
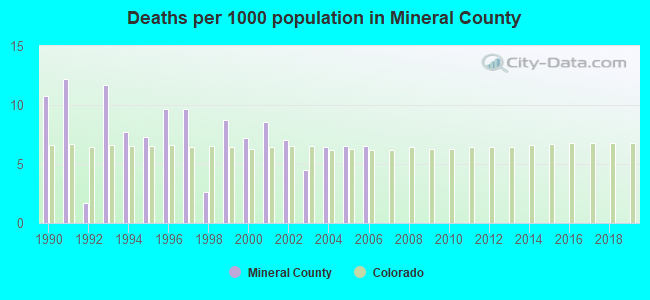
Deaths per 1000 population from 1990 to 1999: 8.2
Deaths per 1000 population from 2000 to 2009: 4.7
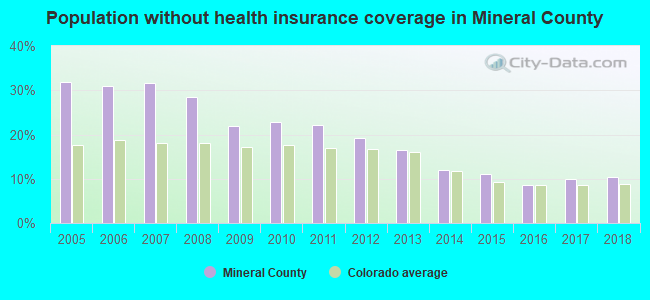
Persons under 19 years old without health insurance coverage in 2018: 6.8%

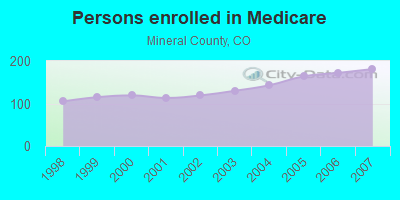
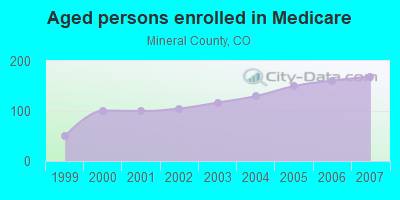
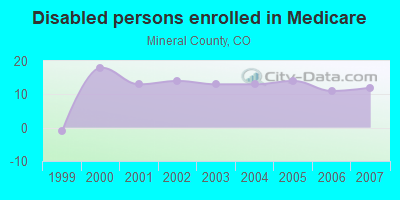
Persons enrolled in hospital insurance and/or supplemental medical insurance (Medicare) in July 1, 2007: 181 (169 aged, 12 disabled)
Children under 18 without health insurance coverage in 2007: 29 (21%)
Population without health insurance coverage in 2000: 14%
Children under 18 without health insurance coverage in 2000: 11%
Household type by relationship:
Households: 803- Male householders: 227 (85 living alone), Female householders: 209 (68 living alone)
243 spouses (242 opposite-sex spouses), 7 unmarried partners, (7 opposite-sex unmarried partners), 110 children (102 natural, 7 adopted, 0 stepchildren), 0 grandchildren, 0 brothers or sisters, 0 parents, 0 foster children, 0 other relatives, 6 non-relatives
- In group quarters: 8
Size of family households: 207 2-persons, 13 3-persons, 37 4-persons, 6 5-persons.
Size of nonfamily households: 154 1-person, 20 2-persons.
86 married couples with children.
6 single-parent households (6 men, 0 women).
100.8% of residents of Mineral speak English at home.
In fiscal year 2004:
Federal Government expenditure: $6,066,000 ($6,509 per capita)
Department of Defense expenditure: $69,000
Federal direct payments to individuals for retirement and disability: $2,494,000
Federal other direct payments to individuals: $355,000
Federal direct payments not to individuals: $0,000
Federal grants: $2,828,000
Federal procurement contracts: $156,000 ($0,000 Department of Defense)
Federal salaries and wages: $233,000 ($0,000 Department of Defense)
Federal Government direct loans: $0,000
Federal guaranteed/insured loans: $200,000
Federal Government insurance: $1,421,000
Population change from April 1, 2000 to July 1, 2005:
Births: 35| Here: | 38 per 1000 residents |
| State: | 76 per 1000 residents |
Deaths: 27
| Here: | 29 per 1000 residents |
| State: | 32 per 1000 residents |
Net international migration: -4
| Here: | |
| State: |
Net internal migration: +101
| Here: | +108 per 1000 residents |
| State: | +10 per 1000 residents |
Total withdrawal of fresh water for public supply: 0.08 millions of gallons per day (all from ground)
| Here: | 6.0 |
| State: | 6.8 |
| Here: | 3.1 |
| State: | 4.0 |
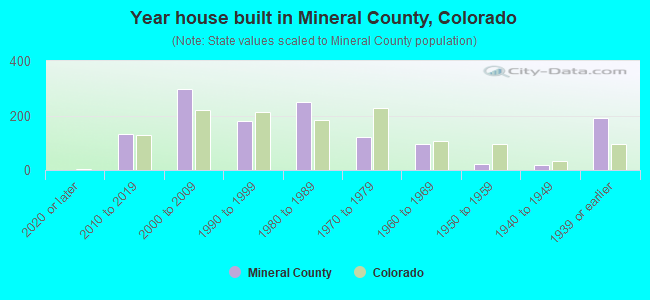
- Year house built in Mineral County, Colorado
- 02020 or later
- 1472010 to 2019
- 2522000 to 2009
- 1761990 to 1999
- 2491980 to 1989
- 1351970 to 1979
- 891960 to 1969
- 211950 to 1959
- 281940 to 1949
- 1821939 or earlier
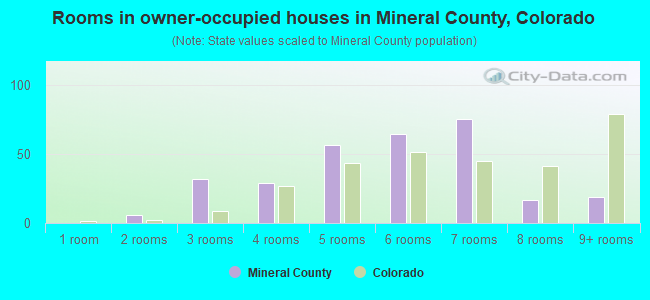
- Rooms in owner-occupied houses in Mineral County, Colorado
- 01 room
- 72 rooms
- 363 rooms
- 294 rooms
- 505 rooms
- 736 rooms
- 867 rooms
- 268 rooms
- 169+ rooms
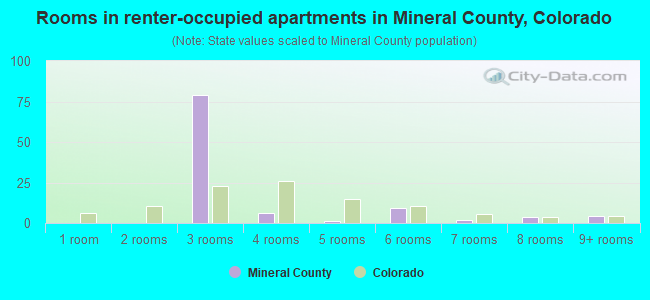
- Rooms in renter-occupied apartments in Mineral County, Colorado
- 61 room
- 02 rooms
- 813 rooms
- 84 rooms
- 25 rooms
- 106 rooms
- 27 rooms
- 48 rooms
- 09+ rooms
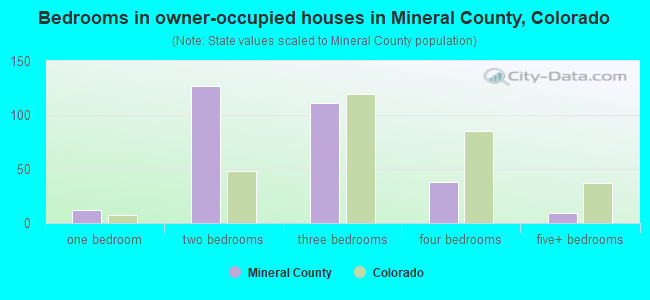
- Bedrooms in owner-occupied houses in Mineral County, Colorado
- 0no bedroom
- 171 bedroom
- 1402 bedrooms
- 1213 bedrooms
- 424 bedrooms
- 35+ bedrooms
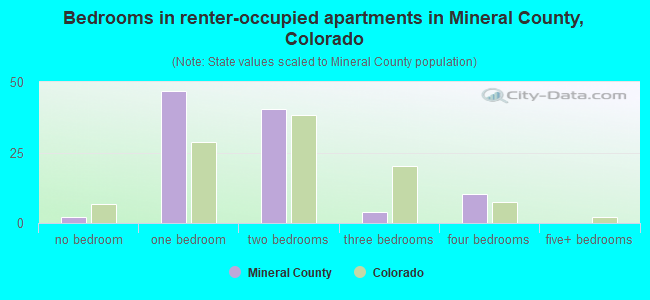
- Bedrooms in renter-occupied apartments in Mineral County, Colorado
- 9no bedroom
- 541 bedroom
- 392 bedrooms
- 03 bedrooms
- 124 bedrooms
- 05+ bedrooms
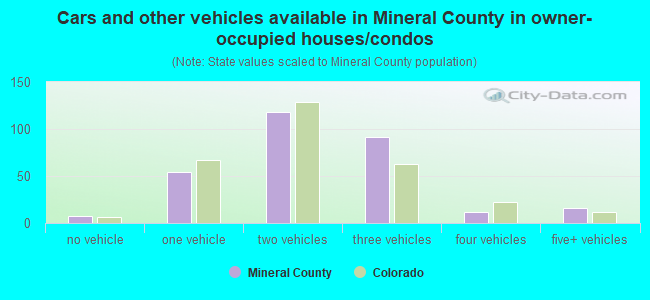
- Cars and other vehicles available in Mineral County in owner-occupied houses/condos
- 14no vehicle
- 581 vehicle
- 1242 vehicles
- 963 vehicles
- 124 vehicles
- 195+ vehicles
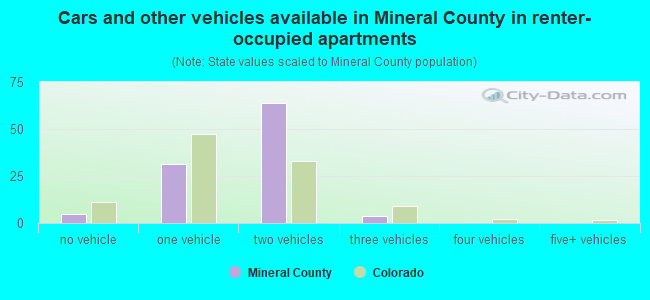
- Cars and other vehicles available in Mineral County in renter-occupied apartments
- 0no vehicle
- 501 vehicle
- 592 vehicles
- 43 vehicles
- 04 vehicles
- 05+ vehicles
86.5% of Mineral County residents lived in the same house 1 years ago.
Out of people who lived in different houses, 2% lived in this county.
Out of people who lived in different counties, 11% lived in Colorado.
| Mineral County: | 86.5% |
| State average: | 83.6% |
Place of birth for U.S.-born residents:
- This state: 267
- Other state: 526
- Northeast: 50
- Midwest: 121
- South: 180
- West: 172
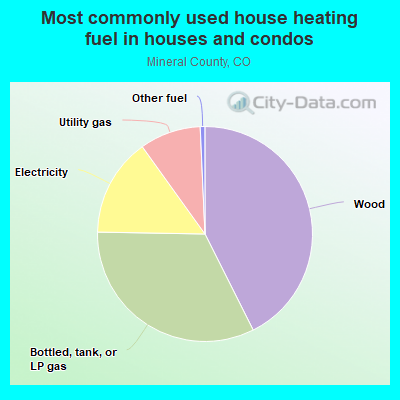
- 44.8%Wood
- 31.2%Bottled, tank, or LP gas
- 15.9%Electricity
- 7.5%Utility gas
- 0.6%Other fuel
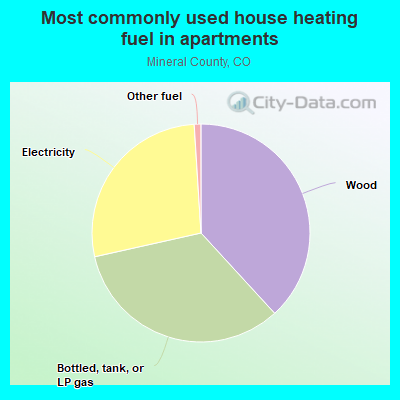
- 37.3%Electricity
- 33.6%Wood
- 27.3%Bottled, tank, or LP gas
- 1.8%Other fuel
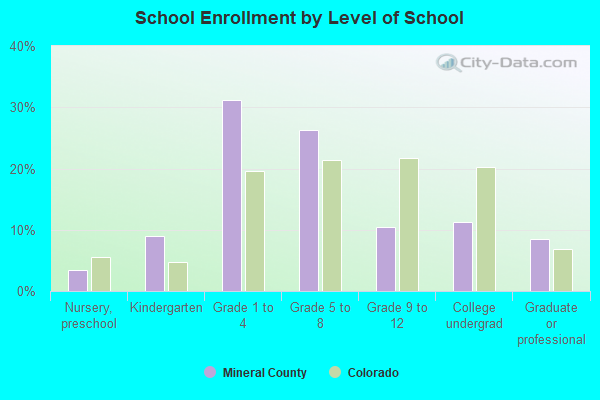
Private vs. public school enrollment:
| Here: | 0.0% |
| Colorado: | 11.4% |
| Here: | 0.0% |
| Colorado: | 8.5% |
| Here: | 100.0% |
| Colorado: | 14.0% |
Mineral County government finances - Expenditure in 2018:
- Assistance and Subsidies - Public Welfare, Federal Categorical Assistance Programs: $365,000
- Charges - Other: $493,000
Parks and Recreation: $149,000
Other: $49,000
Air Transportation: $40,000
Regular Highways: $38,000
Air Transportation: $4,000
- Construction - Regular Highways: $142,000
General - Other: $133,000
Regular Highways: $102,000
- Current Operations - Central Staff Services: $1,479,000
Regular Highways: $698,000
Police Protection: $653,000
Health - Other: $412,000
Parks and Recreation: $254,000
Health - Other: $225,000
General - Other: $196,000
Air Transportation: $134,000
Public Welfare - Other: $132,000
Correctional Institutions: $72,000
Regular Highways: $64,000
Financial Administration: $62,000
General - Other: $61,000
Police Protection: $51,000
Central Staff Services: $48,000
General Public Buildings: $13,000
Judicial and Legal Services: $12,000
Protective Inspection and Regulation - Other: $8,000
Air Transportation: $7,000
Parks and Recreation: $4,000
- Federal Intergovernmental - Air Transportation: $84,000
General Local Government Support: $55,000
- General - Interest on Debt: $5,000
Interest on Debt: $4,000
- Long Term Debt - Beginning Outstanding - Unspecified Public Purpose: $112,000
Outstanding Unspecified Public Purpose: $102,000
Beginning Outstanding - Unspecified Public Purpose: $92,000
Outstanding Unspecified Public Purpose: $82,000
Retired Unspecified Public Purpose: $10,000
Retired Unspecified Public Purpose: $10,000
- Miscellaneous - General Revenue - Other: $100,000
Sale of Property: $53,000
Donations From Private Sources: $24,000
General Revenue - Other: $10,000
Interest Earnings: $7,000
Fines and Forfeits: $1,000
- Other Capital Outlay - Regular Highways: $31,000
Correctional Institutions: $13,000
Health - Other: $5,000
Police Protection: $3,000
Air Transportation: $1,000
- Other Funds - Cash and Securities: $4,111,000
Cash and Securities: $750,000
- State Intergovernmental - Highways: $875,000
Public Welfare: $563,000
Other: $439,000
Highways: $168,000
Public Welfare: $88,000
Other: $37,000
General Local Government Support: $10,000
- Tax - Property: $1,109,000
General Sales and Gross Receipts: $490,000
Other: $266,000
Property: $194,000
General Sales and Gross Receipts: $61,000
Other License: $24,000
Motor Vehicle License: $20,000
Other Selective Sales: $11,000
Other: $6,000
- Total Salaries and Wages: $335,000
Mineral County government finances - Revenue in 2018:
- Assistance and Subsidies - Public Welfare, Federal Categorical Assistance Programs: $365,000
- Charges - Other: $493,000
Parks and Recreation: $149,000
Other: $49,000
Air Transportation: $40,000
Regular Highways: $38,000
Air Transportation: $4,000
- Construction - Regular Highways: $142,000
General - Other: $133,000
Regular Highways: $102,000
- Current Operations - Central Staff Services: $1,479,000
Regular Highways: $698,000
Police Protection: $653,000
Health - Other: $412,000
Parks and Recreation: $254,000
Health - Other: $225,000
General - Other: $196,000
Air Transportation: $134,000
Public Welfare - Other: $132,000
Correctional Institutions: $72,000
Regular Highways: $64,000
Financial Administration: $62,000
General - Other: $61,000
Police Protection: $51,000
Central Staff Services: $48,000
General Public Buildings: $13,000
Judicial and Legal Services: $12,000
Protective Inspection and Regulation - Other: $8,000
Air Transportation: $7,000
Parks and Recreation: $4,000
- Federal Intergovernmental - Air Transportation: $84,000
General Local Government Support: $55,000
- General - Interest on Debt: $5,000
Interest on Debt: $4,000
- Long Term Debt - Beginning Outstanding - Unspecified Public Purpose: $112,000
Outstanding Unspecified Public Purpose: $102,000
Beginning Outstanding - Unspecified Public Purpose: $92,000
Outstanding Unspecified Public Purpose: $82,000
Retired Unspecified Public Purpose: $10,000
Retired Unspecified Public Purpose: $10,000
- Miscellaneous - General Revenue - Other: $100,000
Sale of Property: $53,000
Donations From Private Sources: $24,000
General Revenue - Other: $10,000
Interest Earnings: $7,000
Fines and Forfeits: $1,000
- Other Capital Outlay - Regular Highways: $31,000
Correctional Institutions: $13,000
Health - Other: $5,000
Police Protection: $3,000
Air Transportation: $1,000
- Other Funds - Cash and Securities: $4,111,000
Cash and Securities: $750,000
- State Intergovernmental - Highways: $875,000
Public Welfare: $563,000
Other: $439,000
Highways: $168,000
Public Welfare: $88,000
Other: $37,000
General Local Government Support: $10,000
- Tax - Property: $1,109,000
General Sales and Gross Receipts: $490,000
Other: $266,000
Property: $194,000
General Sales and Gross Receipts: $61,000
Other License: $24,000
Motor Vehicle License: $20,000
Other Selective Sales: $11,000
Other: $6,000
- Total Salaries and Wages: $335,000
Mineral County government finances - Debt in 2018:
- Assistance and Subsidies - Public Welfare, Federal Categorical Assistance Programs: $365,000
- Charges - Other: $493,000
Parks and Recreation: $149,000
Other: $49,000
Air Transportation: $40,000
Regular Highways: $38,000
Air Transportation: $4,000
- Construction - Regular Highways: $142,000
General - Other: $133,000
Regular Highways: $102,000
- Current Operations - Central Staff Services: $1,479,000
Regular Highways: $698,000
Police Protection: $653,000
Health - Other: $412,000
Parks and Recreation: $254,000
Health - Other: $225,000
General - Other: $196,000
Air Transportation: $134,000
Public Welfare - Other: $132,000
Correctional Institutions: $72,000
Regular Highways: $64,000
Financial Administration: $62,000
General - Other: $61,000
Police Protection: $51,000
Central Staff Services: $48,000
General Public Buildings: $13,000
Judicial and Legal Services: $12,000
Protective Inspection and Regulation - Other: $8,000
Air Transportation: $7,000
Parks and Recreation: $4,000
- Federal Intergovernmental - Air Transportation: $84,000
General Local Government Support: $55,000
- General - Interest on Debt: $5,000
Interest on Debt: $4,000
- Long Term Debt - Beginning Outstanding - Unspecified Public Purpose: $112,000
Outstanding Unspecified Public Purpose: $102,000
Beginning Outstanding - Unspecified Public Purpose: $92,000
Outstanding Unspecified Public Purpose: $82,000
Retired Unspecified Public Purpose: $10,000
Retired Unspecified Public Purpose: $10,000
- Miscellaneous - General Revenue - Other: $100,000
Sale of Property: $53,000
Donations From Private Sources: $24,000
General Revenue - Other: $10,000
Interest Earnings: $7,000
Fines and Forfeits: $1,000
- Other Capital Outlay - Regular Highways: $31,000
Correctional Institutions: $13,000
Health - Other: $5,000
Police Protection: $3,000
Air Transportation: $1,000
- Other Funds - Cash and Securities: $4,111,000
Cash and Securities: $750,000
- State Intergovernmental - Highways: $875,000
Public Welfare: $563,000
Other: $439,000
Highways: $168,000
Public Welfare: $88,000
Other: $37,000
General Local Government Support: $10,000
- Tax - Property: $1,109,000
General Sales and Gross Receipts: $490,000
Other: $266,000
Property: $194,000
General Sales and Gross Receipts: $61,000
Other License: $24,000
Motor Vehicle License: $20,000
Other Selective Sales: $11,000
Other: $6,000
- Total Salaries and Wages: $335,000
Mineral County government finances - Cash and Securities in 2018:
- Assistance and Subsidies - Public Welfare, Federal Categorical Assistance Programs: $365,000
- Charges - Other: $493,000
Parks and Recreation: $149,000
Other: $49,000
Air Transportation: $40,000
Regular Highways: $38,000
Air Transportation: $4,000
- Construction - Regular Highways: $142,000
General - Other: $133,000
Regular Highways: $102,000
- Current Operations - Central Staff Services: $1,479,000
Regular Highways: $698,000
Police Protection: $653,000
Health - Other: $412,000
Parks and Recreation: $254,000
Health - Other: $225,000
General - Other: $196,000
Air Transportation: $134,000
Public Welfare - Other: $132,000
Correctional Institutions: $72,000
Regular Highways: $64,000
Financial Administration: $62,000
General - Other: $61,000
Police Protection: $51,000
Central Staff Services: $48,000
General Public Buildings: $13,000
Judicial and Legal Services: $12,000
Protective Inspection and Regulation - Other: $8,000
Air Transportation: $7,000
Parks and Recreation: $4,000
- Federal Intergovernmental - Air Transportation: $84,000
General Local Government Support: $55,000
- General - Interest on Debt: $5,000
Interest on Debt: $4,000
- Long Term Debt - Beginning Outstanding - Unspecified Public Purpose: $112,000
Outstanding Unspecified Public Purpose: $102,000
Beginning Outstanding - Unspecified Public Purpose: $92,000
Outstanding Unspecified Public Purpose: $82,000
Retired Unspecified Public Purpose: $10,000
Retired Unspecified Public Purpose: $10,000
- Miscellaneous - General Revenue - Other: $100,000
Sale of Property: $53,000
Donations From Private Sources: $24,000
General Revenue - Other: $10,000
Interest Earnings: $7,000
Fines and Forfeits: $1,000
- Other Capital Outlay - Regular Highways: $31,000
Correctional Institutions: $13,000
Health - Other: $5,000
Police Protection: $3,000
Air Transportation: $1,000
- Other Funds - Cash and Securities: $4,111,000
Cash and Securities: $750,000
- State Intergovernmental - Highways: $875,000
Public Welfare: $563,000
Other: $439,000
Highways: $168,000
Public Welfare: $88,000
Other: $37,000
General Local Government Support: $10,000
- Tax - Property: $1,109,000
General Sales and Gross Receipts: $490,000
Other: $266,000
Property: $194,000
General Sales and Gross Receipts: $61,000
Other License: $24,000
Motor Vehicle License: $20,000
Other Selective Sales: $11,000
Other: $6,000
- Total Salaries and Wages: $335,000
Supplemental Security Income (SSI) in 2006:
- Total number of recipients: 5
- Number of aged recipients: 0
- Number of blind and disabled recipients: 0
- Number of recipients under 18: 0
- Number of recipients between 18 and 64: 0
- Number of recipients older than 64: 0
- Number of recipients also receiving OASDI: 0
- Amount of payments (thousands of dollars): 2
| Most common first names in Mineral County, CO among deceased individuals | ||
| Name | Count | Lived (average) |
|---|---|---|
| William | 9 | 74.4 years |
| John | 7 | 78.0 years |
| Margaret | 6 | 84.3 years |
| Charles | 5 | 77.6 years |
| George | 5 | 68.2 years |
| Carl | 3 | 66.0 years |
| Donald | 3 | 68.0 years |
| Mary | 3 | 78.4 years |
| Bertha | 2 | 87.0 years |
| Eugene | 2 | 58.4 years |
| Most common last names in Mineral County, CO among deceased individuals | ||
| Last name | Count | Lived (average) |
|---|---|---|
| Brown | 5 | 82.2 years |
| Powell | 5 | 76.6 years |
| Lafont | 4 | 79.0 years |
| Gustafson | 4 | 76.5 years |
| Davis | 4 | 79.7 years |
| Hosselkus | 4 | 81.0 years |
| Fairchild | 3 | 86.6 years |
| Birdsey | 3 | 76.0 years |
| Kroll | 3 | 66.4 years |
| Dabney | 3 | 78.4 years |
Businesses in Mineral County, CO
- True Value: 1
Mineral County on our top lists:
- #2 on the list of "Top 101 counties with the largest number of children under 18 without health insurance coverage in 2000"
- #11 on the list of "Top 101 counties with the smallest number of people without health insurance coverage in 2000"
- #58 on the list of "Top 101 counties with the lowest total withdrawal of fresh water for public supply"